Zip Codes with the Highest Percentage of Renter-Occupied Units in Kannapolis, NC
RELATED REPORTS & OPTIONS
Highest Renter-Occupied
Kannapolis
Compare Zip Codes
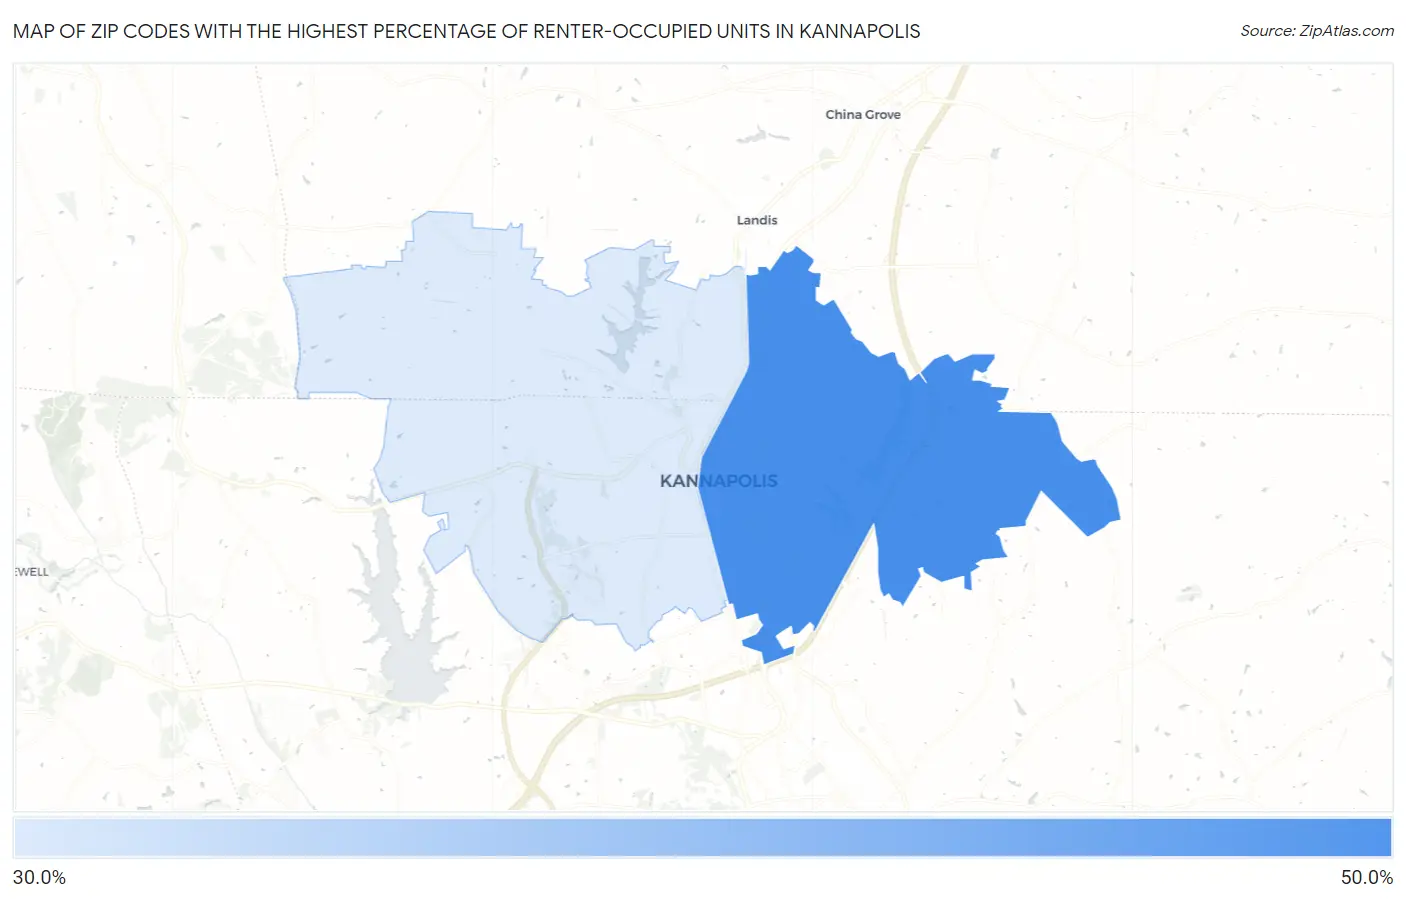
Map of Zip Codes with the Highest Percentage of Renter-Occupied Units in Kannapolis
0.0%
50.0%
Zip Codes with the Highest Percentage of Renter-Occupied Units in Kannapolis, NC
| Zip Code | % Renter-Occupied | vs State | vs National | |
| 1. | 28083 | 41.4% | 33.8%(+7.65)#121 | 35.2%(+6.26)#4,977 |
| 2. | 28081 | 32.5% | 33.8%(-1.31)#238 | 35.2%(-2.70)#8,593 |
1
Common Questions
What are the Top Zip Codes with the Highest Percentage of Renter-Occupied Units in Kannapolis, NC?
Top Zip Codes with the Highest Percentage of Renter-Occupied Units in Kannapolis, NC are:
What zip code has the Highest Percentage of Renter-Occupied Units in Kannapolis, NC?
28083 has the Highest Percentage of Renter-Occupied Units in Kannapolis, NC with 41.4%.
What is the Percentage of Renter-Occupied Units in Kannapolis, NC?
Percentage of Renter-Occupied Units in Kannapolis is 37.5%.
What is the Percentage of Renter-Occupied Units in North Carolina?
Percentage of Renter-Occupied Units in North Carolina is 33.8%.
What is the Percentage of Renter-Occupied Units in the United States?
Percentage of Renter-Occupied Units in the United States is 35.2%.