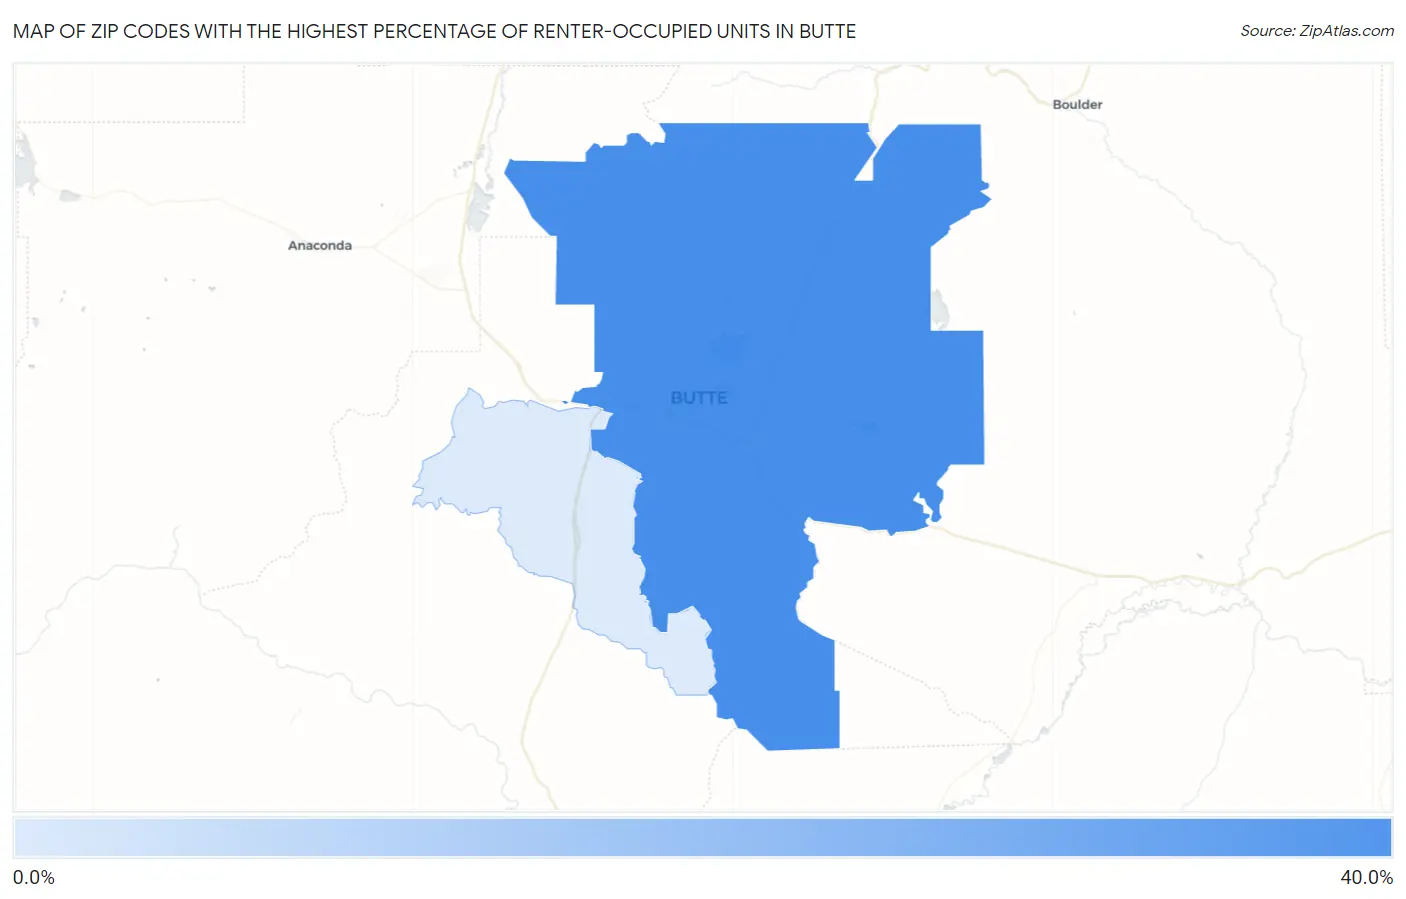
Zip Codes with the Highest Percentage of Renter-Occupied Units in Butte, MT
RELATED REPORTS & OPTIONS
Highest Renter-Occupied
Butte
Compare Zip Codes
Map of Zip Codes with the Highest Percentage of Renter-Occupied Units in Butte
0.0%
40.0%
Zip Codes with the Highest Percentage of Renter-Occupied Units in Butte, MT
| Zip Code | % Renter-Occupied | vs State | vs National | |
| 1. | 59701 | 30.6% | 31.0%(-0.325)#105 | 35.2%(-4.54)#9,646 |
| 2. | 59750 | 2.7% | 31.0%(-28.3)#336 | 35.2%(-32.5)#30,824 |
1
Common Questions
What are the Top Zip Codes with the Highest Percentage of Renter-Occupied Units in Butte, MT?
Top Zip Codes with the Highest Percentage of Renter-Occupied Units in Butte, MT are:
What zip code has the Highest Percentage of Renter-Occupied Units in Butte, MT?
59701 has the Highest Percentage of Renter-Occupied Units in Butte, MT with 30.6%.
What is the Percentage of Renter-Occupied Units in Montana?
Percentage of Renter-Occupied Units in Montana is 31.0%.
What is the Percentage of Renter-Occupied Units in the United States?
Percentage of Renter-Occupied Units in the United States is 35.2%.