Zip Codes with the Highest Percentage of Population Employed in Sales & Related in Massachusetts
RELATED REPORTS & OPTIONS
Sales & Related
Massachusetts
Compare Zip Codes
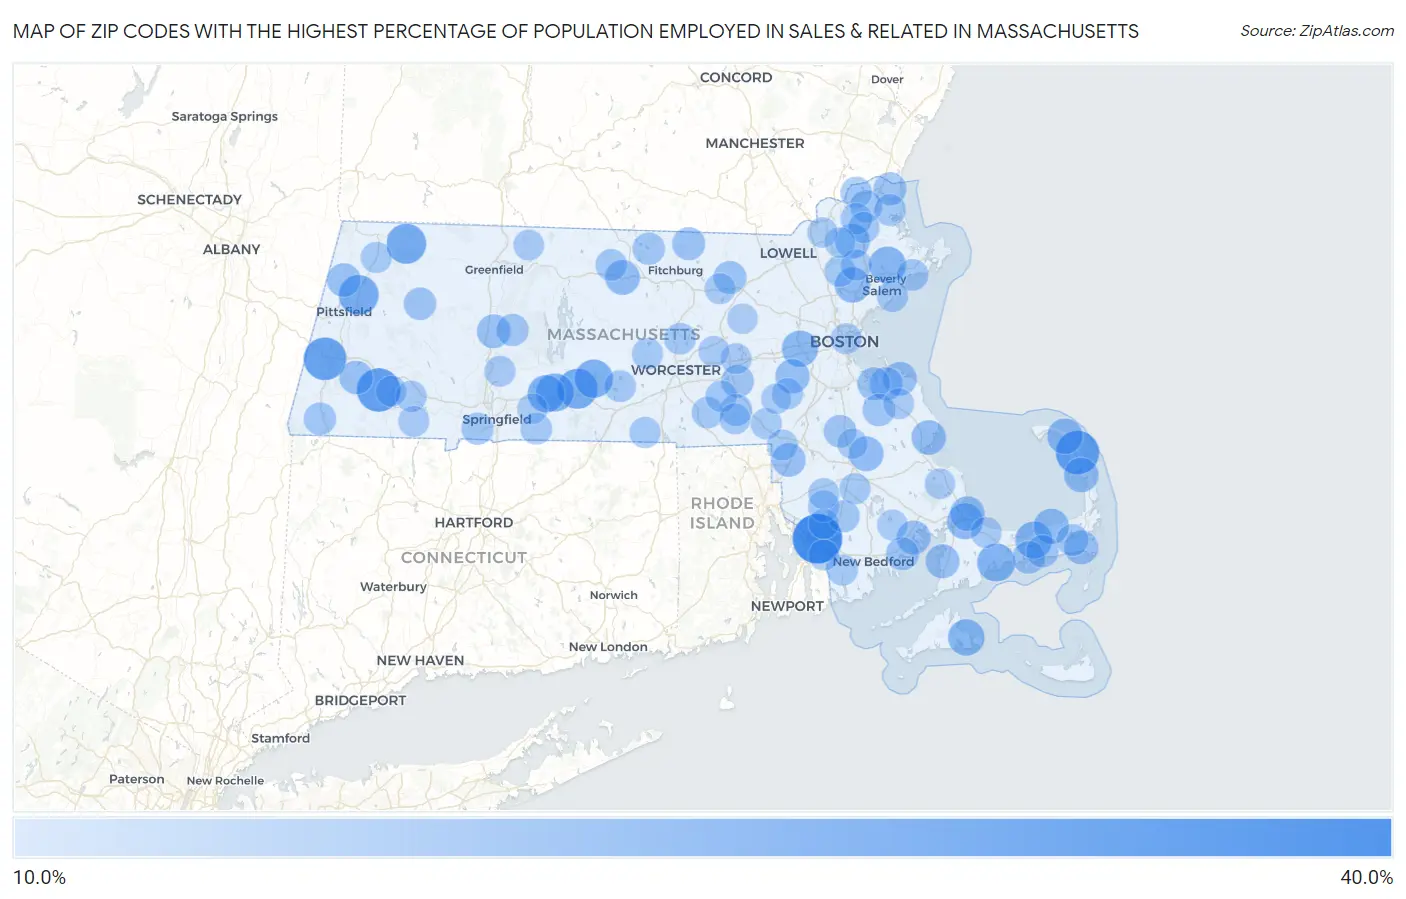
Map of Zip Codes with the Highest Percentage of Population Employed in Sales & Related in Massachusetts
10.0%
40.0%
Zip Codes with the Highest Percentage of Population Employed in Sales & Related in Massachusetts
| Zip Code | % Employed | vs State | vs National | |
| 1. | 02725 | 34.7% | 8.6%(+26.1)#1 | 9.6%(+25.1)#280 |
| 2. | 01253 | 27.3% | 8.6%(+18.7)#2 | 9.6%(+17.7)#508 |
| 3. | 02666 | 27.1% | 8.6%(+18.5)#3 | 9.6%(+17.5)#517 |
| 4. | 01229 | 26.0% | 8.6%(+17.4)#4 | 9.6%(+16.4)#566 |
| 5. | 01092 | 22.8% | 8.6%(+14.2)#5 | 9.6%(+13.2)#818 |
| 6. | 01343 | 22.7% | 8.6%(+14.1)#6 | 9.6%(+13.1)#829 |
| 7. | 01224 | 22.5% | 8.6%(+13.9)#7 | 9.6%(+13.0)#841 |
| 8. | 01585 | 20.8% | 8.6%(+12.2)#8 | 9.6%(+11.2)#1,044 |
| 9. | 01079 | 20.5% | 8.6%(+11.9)#9 | 9.6%(+10.9)#1,090 |
| 10. | 02655 | 20.3% | 8.6%(+11.7)#10 | 9.6%(+10.7)#1,113 |
| 11. | 01080 | 19.4% | 8.6%(+10.8)#11 | 9.6%(+9.82)#1,259 |
| 12. | 01984 | 18.9% | 8.6%(+10.3)#12 | 9.6%(+9.34)#1,361 |
| 13. | 02675 | 18.9% | 8.6%(+10.3)#13 | 9.6%(+9.34)#1,362 |
| 14. | 02539 | 18.5% | 8.6%(+9.86)#14 | 9.6%(+8.88)#1,443 |
| 15. | 02462 | 18.2% | 8.6%(+9.59)#15 | 9.6%(+8.61)#1,514 |
| 16. | 02561 | 17.7% | 8.6%(+9.10)#16 | 9.6%(+8.12)#1,638 |
| 17. | 02652 | 17.4% | 8.6%(+8.82)#17 | 9.6%(+7.84)#1,709 |
| 18. | 01940 | 17.2% | 8.6%(+8.57)#18 | 9.6%(+7.59)#1,777 |
| 19. | 02641 | 16.9% | 8.6%(+8.24)#19 | 9.6%(+7.26)#1,883 |
| 20. | 01438 | 16.4% | 8.6%(+7.82)#20 | 9.6%(+6.84)#2,041 |
| 21. | 01921 | 16.4% | 8.6%(+7.80)#21 | 9.6%(+6.82)#2,053 |
| 22. | 02325 | 16.3% | 8.6%(+7.71)#22 | 9.6%(+6.73)#2,091 |
| 23. | 02667 | 16.2% | 8.6%(+7.62)#23 | 9.6%(+6.64)#2,126 |
| 24. | 02562 | 16.2% | 8.6%(+7.55)#24 | 9.6%(+6.57)#2,157 |
| 25. | 02332 | 16.1% | 8.6%(+7.46)#25 | 9.6%(+6.49)#2,192 |
| 26. | 02030 | 15.8% | 8.6%(+7.21)#26 | 9.6%(+6.23)#2,326 |
| 27. | 02659 | 15.4% | 8.6%(+6.81)#27 | 9.6%(+5.83)#2,513 |
| 28. | 02738 | 15.3% | 8.6%(+6.69)#28 | 9.6%(+5.71)#2,570 |
| 29. | 02556 | 15.3% | 8.6%(+6.65)#29 | 9.6%(+5.68)#2,583 |
| 30. | 02025 | 15.2% | 8.6%(+6.58)#30 | 9.6%(+5.60)#2,629 |
| 31. | 02763 | 15.1% | 8.6%(+6.49)#31 | 9.6%(+5.51)#2,673 |
| 32. | 01038 | 15.1% | 8.6%(+6.44)#32 | 9.6%(+5.46)#2,702 |
| 33. | 01237 | 14.9% | 8.6%(+6.32)#33 | 9.6%(+5.34)#2,778 |
| 34. | 01264 | 14.9% | 8.6%(+6.29)#34 | 9.6%(+5.32)#2,798 |
| 35. | 02043 | 14.5% | 8.6%(+5.89)#35 | 9.6%(+4.91)#3,082 |
| 36. | 01474 | 14.3% | 8.6%(+5.68)#36 | 9.6%(+4.70)#3,237 |
| 37. | 01432 | 14.2% | 8.6%(+5.63)#37 | 9.6%(+4.65)#3,295 |
| 38. | 02739 | 14.2% | 8.6%(+5.63)#38 | 9.6%(+4.65)#3,301 |
| 39. | 02189 | 14.2% | 8.6%(+5.56)#39 | 9.6%(+4.58)#3,338 |
| 40. | 01952 | 14.1% | 8.6%(+5.48)#40 | 9.6%(+4.50)#3,395 |
| 41. | 01748 | 14.0% | 8.6%(+5.36)#41 | 9.6%(+4.38)#3,498 |
| 42. | 02673 | 13.9% | 8.6%(+5.25)#42 | 9.6%(+4.27)#3,583 |
| 43. | 02357 | 13.8% | 8.6%(+5.15)#43 | 9.6%(+4.17)#3,686 |
| 44. | 01026 | 13.7% | 8.6%(+5.10)#44 | 9.6%(+4.12)#3,735 |
| 45. | 02370 | 13.6% | 8.6%(+5.03)#45 | 9.6%(+4.05)#3,795 |
| 46. | 01257 | 13.6% | 8.6%(+5.02)#46 | 9.6%(+4.04)#3,811 |
| 47. | 02664 | 13.6% | 8.6%(+5.01)#47 | 9.6%(+4.03)#3,816 |
| 48. | 01430 | 13.5% | 8.6%(+4.88)#48 | 9.6%(+3.90)#3,942 |
| 49. | 01003 | 13.4% | 8.6%(+4.81)#49 | 9.6%(+3.84)#4,012 |
| 50. | 01030 | 13.1% | 8.6%(+4.48)#50 | 9.6%(+3.50)#4,395 |
| 51. | 01747 | 13.1% | 8.6%(+4.47)#51 | 9.6%(+3.49)#4,398 |
| 52. | 02702 | 13.0% | 8.6%(+4.39)#52 | 9.6%(+3.41)#4,476 |
| 53. | 01985 | 13.0% | 8.6%(+4.33)#53 | 9.6%(+3.36)#4,535 |
| 54. | 01944 | 12.9% | 8.6%(+4.23)#54 | 9.6%(+3.26)#4,668 |
| 55. | 02645 | 12.8% | 8.6%(+4.16)#55 | 9.6%(+3.19)#4,782 |
| 56. | 01583 | 12.7% | 8.6%(+4.10)#56 | 9.6%(+3.12)#4,862 |
| 57. | 01515 | 12.7% | 8.6%(+4.09)#57 | 9.6%(+3.11)#4,871 |
| 58. | 01951 | 12.7% | 8.6%(+4.09)#58 | 9.6%(+3.11)#4,874 |
| 59. | 01436 | 12.7% | 8.6%(+4.06)#59 | 9.6%(+3.08)#4,918 |
| 60. | 01036 | 12.6% | 8.6%(+3.99)#60 | 9.6%(+3.01)#4,997 |
| 61. | 01588 | 12.6% | 8.6%(+3.95)#61 | 9.6%(+2.97)#5,059 |
| 62. | 01568 | 12.6% | 8.6%(+3.95)#62 | 9.6%(+2.97)#5,065 |
| 63. | 01860 | 12.5% | 8.6%(+3.91)#63 | 9.6%(+2.93)#5,129 |
| 64. | 02715 | 12.5% | 8.6%(+3.84)#64 | 9.6%(+2.86)#5,244 |
| 65. | 01834 | 12.3% | 8.6%(+3.71)#65 | 9.6%(+2.73)#5,441 |
| 66. | 01945 | 12.3% | 8.6%(+3.66)#66 | 9.6%(+2.68)#5,526 |
| 67. | 01864 | 12.2% | 8.6%(+3.58)#67 | 9.6%(+2.60)#5,673 |
| 68. | 01949 | 12.2% | 8.6%(+3.53)#68 | 9.6%(+2.56)#5,764 |
| 69. | 01612 | 12.1% | 8.6%(+3.52)#69 | 9.6%(+2.54)#5,786 |
| 70. | 01571 | 12.1% | 8.6%(+3.50)#70 | 9.6%(+2.52)#5,834 |
| 71. | 02038 | 12.1% | 8.6%(+3.48)#71 | 9.6%(+2.50)#5,879 |
| 72. | 01833 | 12.1% | 8.6%(+3.47)#72 | 9.6%(+2.49)#5,897 |
| 73. | 02764 | 12.0% | 8.6%(+3.40)#73 | 9.6%(+2.42)#6,010 |
| 74. | 02052 | 12.0% | 8.6%(+3.38)#74 | 9.6%(+2.40)#6,055 |
| 75. | 01220 | 12.0% | 8.6%(+3.36)#75 | 9.6%(+2.38)#6,087 |
| 76. | 02718 | 12.0% | 8.6%(+3.35)#76 | 9.6%(+2.37)#6,111 |
| 77. | 01008 | 11.9% | 8.6%(+3.30)#77 | 9.6%(+2.32)#6,190 |
| 78. | 01756 | 11.9% | 8.6%(+3.24)#78 | 9.6%(+2.26)#6,314 |
| 79. | 02790 | 11.8% | 8.6%(+3.23)#79 | 9.6%(+2.25)#6,332 |
| 80. | 01034 | 11.8% | 8.6%(+3.17)#80 | 9.6%(+2.20)#6,421 |
| 81. | 02109 | 11.8% | 8.6%(+3.17)#81 | 9.6%(+2.19)#6,426 |
| 82. | 02762 | 11.7% | 8.6%(+3.13)#82 | 9.6%(+2.15)#6,516 |
| 83. | 02537 | 11.7% | 8.6%(+3.10)#83 | 9.6%(+2.12)#6,569 |
| 84. | 02721 | 11.7% | 8.6%(+3.09)#84 | 9.6%(+2.11)#6,597 |
| 85. | 01075 | 11.7% | 8.6%(+3.08)#85 | 9.6%(+2.11)#6,599 |
| 86. | 01029 | 11.7% | 8.6%(+3.08)#86 | 9.6%(+2.11)#6,601 |
| 87. | 02770 | 11.7% | 8.6%(+3.03)#87 | 9.6%(+2.06)#6,706 |
| 88. | 01772 | 11.6% | 8.6%(+3.03)#88 | 9.6%(+2.05)#6,720 |
| 89. | 01434 | 11.6% | 8.6%(+2.95)#89 | 9.6%(+1.98)#6,866 |
| 90. | 02061 | 11.5% | 8.6%(+2.91)#90 | 9.6%(+1.94)#6,948 |
| 91. | 01360 | 11.5% | 8.6%(+2.89)#91 | 9.6%(+1.92)#6,983 |
| 92. | 01532 | 11.4% | 8.6%(+2.82)#92 | 9.6%(+1.84)#7,166 |
| 93. | 01775 | 11.3% | 8.6%(+2.64)#93 | 9.6%(+1.66)#7,566 |
| 94. | 01845 | 11.3% | 8.6%(+2.63)#94 | 9.6%(+1.66)#7,590 |
| 95. | 02360 | 11.2% | 8.6%(+2.61)#95 | 9.6%(+1.63)#7,644 |
| 96. | 02726 | 11.2% | 8.6%(+2.60)#96 | 9.6%(+1.62)#7,653 |
| 97. | 01095 | 11.2% | 8.6%(+2.53)#97 | 9.6%(+1.56)#7,814 |
| 98. | 02054 | 11.1% | 8.6%(+2.51)#98 | 9.6%(+1.54)#7,870 |
| 99. | 02379 | 11.1% | 8.6%(+2.47)#99 | 9.6%(+1.49)#7,983 |
| 100. | 01840 | 11.1% | 8.6%(+2.47)#100 | 9.6%(+1.49)#7,987 |
Common Questions
What are the Top 10 Zip Codes with the Highest Percentage of Population Employed in Sales & Related in Massachusetts?
Top 10 Zip Codes with the Highest Percentage of Population Employed in Sales & Related in Massachusetts are:
What zip code has the Highest Percentage of Population Employed in Sales & Related in Massachusetts?
02725 has the Highest Percentage of Population Employed in Sales & Related in Massachusetts with 34.7%.
What is the Percentage of Population Employed in Sales & Related in the State of Massachusetts?
Percentage of Population Employed in Sales & Related in Massachusetts is 8.6%.
What is the Percentage of Population Employed in Sales & Related in the United States?
Percentage of Population Employed in Sales & Related in the United States is 9.6%.