Zip Codes with the Highest Percentage of Population Employed in Professional & Scientific Services in Massachusetts
RELATED REPORTS & OPTIONS
Professional & Scientific Services
Massachusetts
Compare Zip Codes
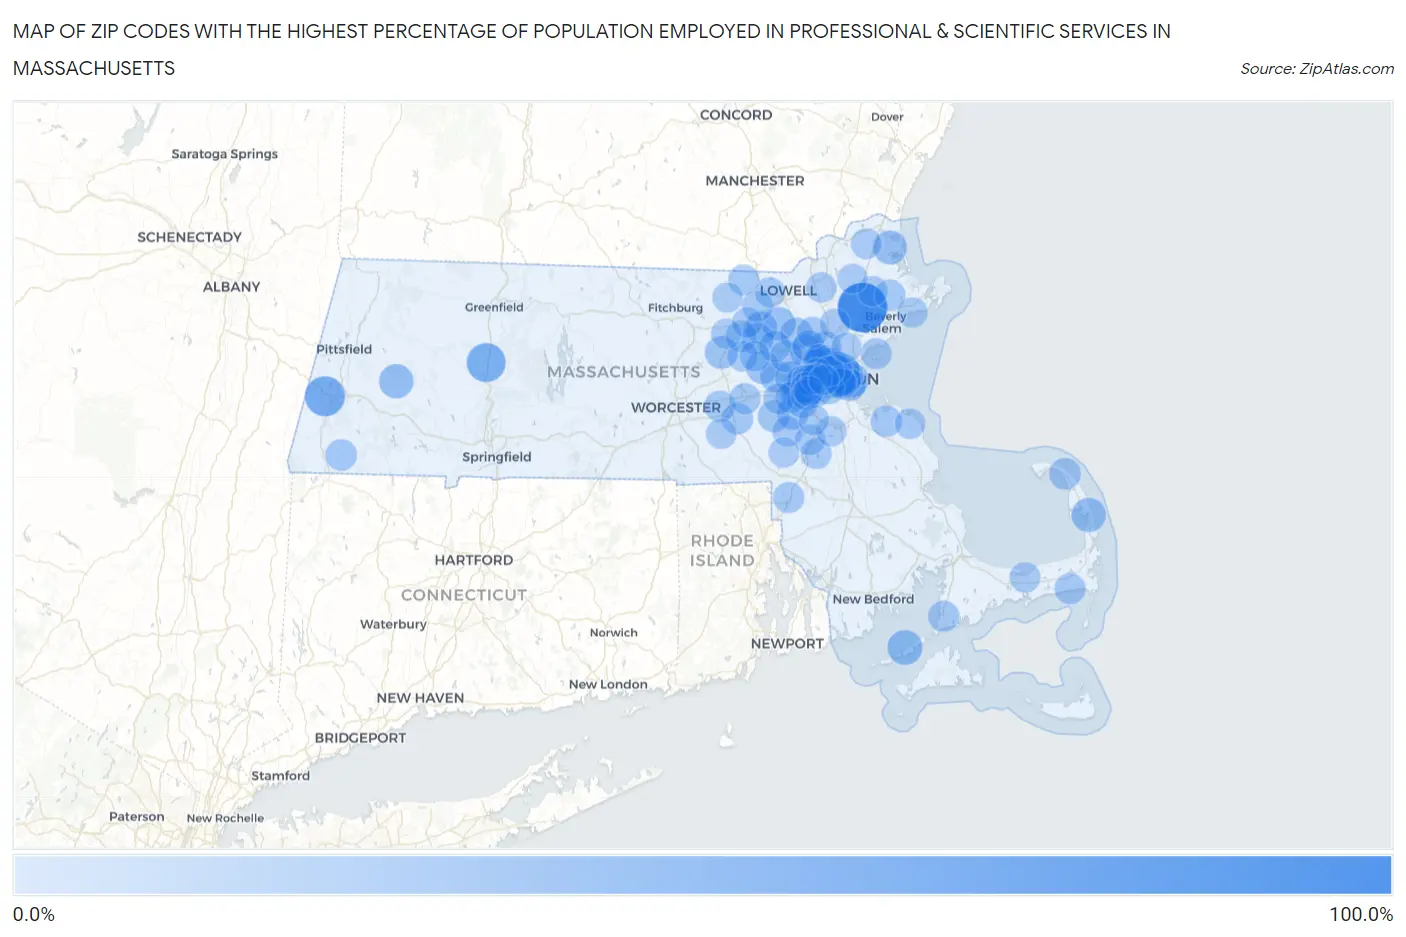
Map of Zip Codes with the Highest Percentage of Population Employed in Professional & Scientific Services in Massachusetts
0.0%
100.0%
Zip Codes with the Highest Percentage of Population Employed in Professional & Scientific Services in Massachusetts
| Zip Code | % Employed | vs State | vs National | |
| 1. | 01937 | 100.0% | 11.5%(+88.5)#1 | 7.8%(+92.2)#5 |
| 2. | 01229 | 58.0% | 11.5%(+46.5)#2 | 7.8%(+50.2)#36 |
| 3. | 01066 | 53.8% | 11.5%(+42.4)#3 | 7.8%(+46.0)#43 |
| 4. | 02543 | 36.5% | 11.5%(+25.0)#4 | 7.8%(+28.7)#117 |
| 5. | 02210 | 36.4% | 11.5%(+24.9)#5 | 7.8%(+28.5)#118 |
| 6. | 02462 | 35.7% | 11.5%(+24.2)#6 | 7.8%(+27.8)#128 |
| 7. | 02109 | 34.8% | 11.5%(+23.3)#7 | 7.8%(+26.9)#137 |
| 8. | 02108 | 34.5% | 11.5%(+23.0)#8 | 7.8%(+26.7)#142 |
| 9. | 02663 | 33.8% | 11.5%(+22.3)#9 | 7.8%(+25.9)#154 |
| 10. | 01243 | 33.3% | 11.5%(+21.9)#10 | 7.8%(+25.5)#163 |
| 11. | 01951 | 32.0% | 11.5%(+20.5)#11 | 7.8%(+24.2)#178 |
| 12. | 02114 | 31.5% | 11.5%(+20.0)#12 | 7.8%(+23.6)#191 |
| 13. | 02142 | 30.2% | 11.5%(+18.8)#13 | 7.8%(+22.4)#217 |
| 14. | 01741 | 30.0% | 11.5%(+18.5)#14 | 7.8%(+22.1)#221 |
| 15. | 02141 | 29.1% | 11.5%(+17.6)#15 | 7.8%(+21.2)#253 |
| 16. | 02113 | 28.9% | 11.5%(+17.5)#16 | 7.8%(+21.1)#258 |
| 17. | 01740 | 27.8% | 11.5%(+16.3)#17 | 7.8%(+19.9)#303 |
| 18. | 01776 | 27.4% | 11.5%(+15.9)#18 | 7.8%(+19.6)#315 |
| 19. | 02140 | 26.4% | 11.5%(+15.0)#19 | 7.8%(+18.6)#355 |
| 20. | 02478 | 26.4% | 11.5%(+14.9)#20 | 7.8%(+18.6)#357 |
| 21. | 02421 | 26.3% | 11.5%(+14.8)#21 | 7.8%(+18.4)#363 |
| 22. | 01778 | 26.1% | 11.5%(+14.7)#22 | 7.8%(+18.3)#368 |
| 23. | 02110 | 25.4% | 11.5%(+13.9)#23 | 7.8%(+17.6)#397 |
| 24. | 01730 | 25.4% | 11.5%(+13.9)#24 | 7.8%(+17.6)#399 |
| 25. | 02493 | 25.0% | 11.5%(+13.5)#25 | 7.8%(+17.1)#427 |
| 26. | 02129 | 24.9% | 11.5%(+13.4)#26 | 7.8%(+17.1)#431 |
| 27. | 01890 | 24.9% | 11.5%(+13.4)#27 | 7.8%(+17.0)#432 |
| 28. | 01773 | 24.9% | 11.5%(+13.4)#28 | 7.8%(+17.0)#433 |
| 29. | 01718 | 24.8% | 11.5%(+13.3)#29 | 7.8%(+17.0)#438 |
| 30. | 02459 | 24.8% | 11.5%(+13.3)#30 | 7.8%(+16.9)#442 |
| 31. | 02116 | 24.7% | 11.5%(+13.3)#31 | 7.8%(+16.9)#445 |
| 32. | 02420 | 24.7% | 11.5%(+13.2)#32 | 7.8%(+16.8)#448 |
| 33. | 02144 | 24.4% | 11.5%(+12.9)#33 | 7.8%(+16.5)#472 |
| 34. | 01720 | 24.4% | 11.5%(+12.9)#34 | 7.8%(+16.5)#473 |
| 35. | 02474 | 24.0% | 11.5%(+12.5)#35 | 7.8%(+16.1)#504 |
| 36. | 01770 | 23.9% | 11.5%(+12.4)#36 | 7.8%(+16.1)#511 |
| 37. | 02139 | 23.5% | 11.5%(+12.0)#37 | 7.8%(+15.6)#530 |
| 38. | 02030 | 23.3% | 11.5%(+11.9)#38 | 7.8%(+15.5)#543 |
| 39. | 02466 | 23.3% | 11.5%(+11.8)#39 | 7.8%(+15.4)#548 |
| 40. | 02652 | 23.2% | 11.5%(+11.8)#40 | 7.8%(+15.4)#552 |
| 41. | 02127 | 23.2% | 11.5%(+11.7)#41 | 7.8%(+15.4)#558 |
| 42. | 02481 | 22.2% | 11.5%(+10.7)#42 | 7.8%(+14.4)#642 |
| 43. | 01244 | 22.2% | 11.5%(+10.7)#43 | 7.8%(+14.4)#643 |
| 44. | 02446 | 22.0% | 11.5%(+10.6)#44 | 7.8%(+14.2)#660 |
| 45. | 01719 | 22.0% | 11.5%(+10.6)#45 | 7.8%(+14.2)#662 |
| 46. | 02111 | 21.9% | 11.5%(+10.4)#46 | 7.8%(+14.1)#672 |
| 47. | 02145 | 21.9% | 11.5%(+10.4)#47 | 7.8%(+14.0)#680 |
| 48. | 02043 | 21.8% | 11.5%(+10.3)#48 | 7.8%(+14.0)#685 |
| 49. | 02461 | 21.6% | 11.5%(+10.2)#49 | 7.8%(+13.8)#705 |
| 50. | 01742 | 21.6% | 11.5%(+10.1)#50 | 7.8%(+13.8)#709 |
| 51. | 02476 | 21.5% | 11.5%(+10.0)#51 | 7.8%(+13.6)#721 |
| 52. | 02482 | 21.4% | 11.5%(+9.91)#52 | 7.8%(+13.5)#739 |
| 53. | 01748 | 21.2% | 11.5%(+9.72)#53 | 7.8%(+13.3)#752 |
| 54. | 02492 | 21.2% | 11.5%(+9.69)#54 | 7.8%(+13.3)#754 |
| 55. | 01581 | 21.1% | 11.5%(+9.67)#55 | 7.8%(+13.3)#759 |
| 56. | 02540 | 21.1% | 11.5%(+9.60)#56 | 7.8%(+13.2)#769 |
| 57. | 01803 | 20.9% | 11.5%(+9.47)#57 | 7.8%(+13.1)#780 |
| 58. | 02646 | 20.5% | 11.5%(+9.00)#58 | 7.8%(+12.6)#830 |
| 59. | 02143 | 20.3% | 11.5%(+8.86)#59 | 7.8%(+12.5)#850 |
| 60. | 01760 | 20.3% | 11.5%(+8.81)#60 | 7.8%(+12.4)#854 |
| 61. | 02199 | 20.3% | 11.5%(+8.80)#61 | 7.8%(+12.4)#856 |
| 62. | 01886 | 20.2% | 11.5%(+8.75)#62 | 7.8%(+12.4)#861 |
| 63. | 02472 | 20.2% | 11.5%(+8.70)#63 | 7.8%(+12.3)#865 |
| 64. | 02445 | 20.1% | 11.5%(+8.58)#64 | 7.8%(+12.2)#880 |
| 65. | 02763 | 20.1% | 11.5%(+8.57)#65 | 7.8%(+12.2)#881 |
| 66. | 01982 | 20.0% | 11.5%(+8.56)#66 | 7.8%(+12.2)#884 |
| 67. | 02465 | 19.9% | 11.5%(+8.45)#67 | 7.8%(+12.1)#898 |
| 68. | 01908 | 19.9% | 11.5%(+8.45)#68 | 7.8%(+12.1)#899 |
| 69. | 01745 | 19.8% | 11.5%(+8.35)#69 | 7.8%(+12.0)#907 |
| 70. | 02460 | 19.7% | 11.5%(+8.18)#70 | 7.8%(+11.8)#930 |
| 71. | 02118 | 19.6% | 11.5%(+8.17)#71 | 7.8%(+11.8)#932 |
| 72. | 01827 | 19.6% | 11.5%(+8.15)#72 | 7.8%(+11.8)#935 |
| 73. | 02468 | 19.2% | 11.5%(+7.70)#73 | 7.8%(+11.3)#984 |
| 74. | 02494 | 19.1% | 11.5%(+7.59)#74 | 7.8%(+11.2)#992 |
| 75. | 02067 | 18.8% | 11.5%(+7.36)#75 | 7.8%(+11.0)#1,031 |
| 76. | 01810 | 18.7% | 11.5%(+7.19)#76 | 7.8%(+10.8)#1,048 |
| 77. | 02637 | 18.7% | 11.5%(+7.18)#77 | 7.8%(+10.8)#1,050 |
| 78. | 02052 | 18.4% | 11.5%(+6.89)#78 | 7.8%(+10.5)#1,096 |
| 79. | 01985 | 18.3% | 11.5%(+6.81)#79 | 7.8%(+10.4)#1,110 |
| 80. | 02032 | 18.2% | 11.5%(+6.71)#80 | 7.8%(+10.3)#1,128 |
| 81. | 01867 | 18.2% | 11.5%(+6.70)#81 | 7.8%(+10.3)#1,133 |
| 82. | 02138 | 18.0% | 11.5%(+6.55)#82 | 7.8%(+10.2)#1,153 |
| 83. | 02458 | 18.0% | 11.5%(+6.52)#83 | 7.8%(+10.2)#1,160 |
| 84. | 01775 | 18.0% | 11.5%(+6.48)#84 | 7.8%(+10.1)#1,167 |
| 85. | 02066 | 18.0% | 11.5%(+6.47)#85 | 7.8%(+10.1)#1,169 |
| 86. | 01983 | 17.9% | 11.5%(+6.41)#86 | 7.8%(+10.0)#1,177 |
| 87. | 01754 | 17.8% | 11.5%(+6.35)#87 | 7.8%(+9.98)#1,187 |
| 88. | 01460 | 17.7% | 11.5%(+6.22)#88 | 7.8%(+9.85)#1,207 |
| 89. | 02056 | 17.6% | 11.5%(+6.12)#89 | 7.8%(+9.75)#1,233 |
| 90. | 02464 | 17.6% | 11.5%(+6.09)#90 | 7.8%(+9.73)#1,237 |
| 91. | 01944 | 17.6% | 11.5%(+6.08)#91 | 7.8%(+9.71)#1,241 |
| 92. | 01863 | 17.5% | 11.5%(+6.04)#92 | 7.8%(+9.67)#1,250 |
| 93. | 01568 | 17.5% | 11.5%(+6.03)#93 | 7.8%(+9.66)#1,254 |
| 94. | 01450 | 17.5% | 11.5%(+5.98)#94 | 7.8%(+9.61)#1,263 |
| 95. | 02021 | 17.4% | 11.5%(+5.92)#95 | 7.8%(+9.55)#1,274 |
| 96. | 01451 | 17.4% | 11.5%(+5.88)#96 | 7.8%(+9.51)#1,278 |
| 97. | 02090 | 17.3% | 11.5%(+5.80)#97 | 7.8%(+9.43)#1,303 |
| 98. | 02135 | 17.3% | 11.5%(+5.79)#98 | 7.8%(+9.42)#1,305 |
| 99. | 02176 | 17.1% | 11.5%(+5.65)#99 | 7.8%(+9.28)#1,332 |
| 100. | 01921 | 17.0% | 11.5%(+5.53)#100 | 7.8%(+9.16)#1,363 |
Common Questions
What are the Top 10 Zip Codes with the Highest Percentage of Population Employed in Professional & Scientific Services in Massachusetts?
Top 10 Zip Codes with the Highest Percentage of Population Employed in Professional & Scientific Services in Massachusetts are:
What zip code has the Highest Percentage of Population Employed in Professional & Scientific Services in Massachusetts?
01937 has the Highest Percentage of Population Employed in Professional & Scientific Services in Massachusetts with 100.0%.
What is the Percentage of Population Employed in Professional & Scientific Services in the State of Massachusetts?
Percentage of Population Employed in Professional & Scientific Services in Massachusetts is 11.5%.
What is the Percentage of Population Employed in Professional & Scientific Services in the United States?
Percentage of Population Employed in Professional & Scientific Services in the United States is 7.8%.