Zip Codes with the Highest Percentage of Renter-Occupied Units in Buzzards Bay, MA
RELATED REPORTS & OPTIONS
Highest Renter-Occupied
Buzzards Bay
Compare Zip Codes
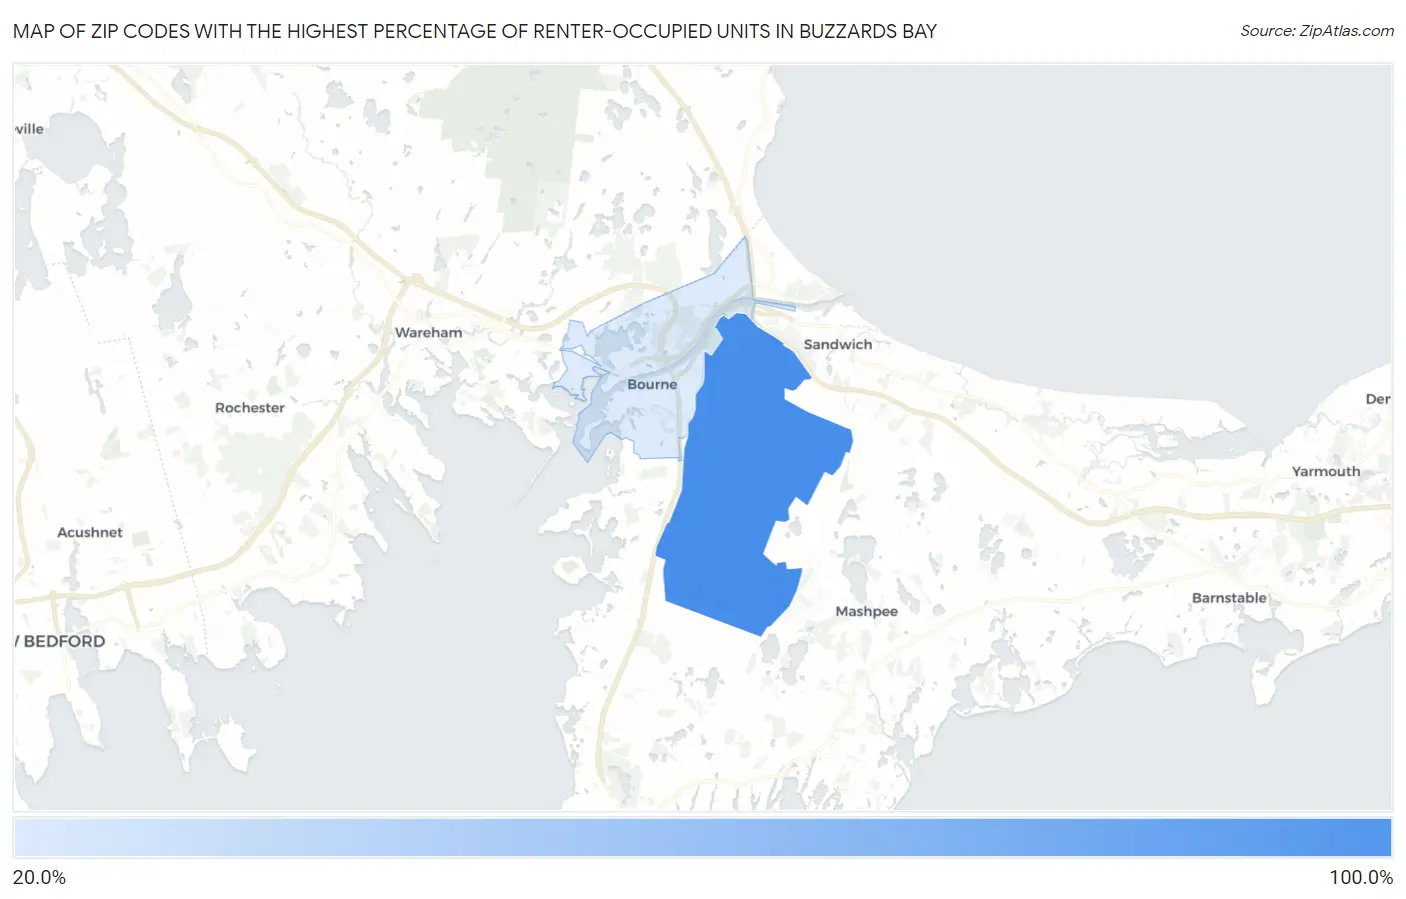
Map of Zip Codes with the Highest Percentage of Renter-Occupied Units in Buzzards Bay
0.0%
100.0%
Zip Codes with the Highest Percentage of Renter-Occupied Units in Buzzards Bay, MA
| Zip Code | % Renter-Occupied | vs State | vs National | |
| 1. | 02542 | 100.0% | 37.6%(+62.4)#6 | 35.2%(+64.8)#106 |
| 2. | 02532 | 21.9% | 37.6%(-15.6)#256 | 35.2%(-13.3)#16,415 |
1
Common Questions
What are the Top Zip Codes with the Highest Percentage of Renter-Occupied Units in Buzzards Bay, MA?
Top Zip Codes with the Highest Percentage of Renter-Occupied Units in Buzzards Bay, MA are:
What zip code has the Highest Percentage of Renter-Occupied Units in Buzzards Bay, MA?
02542 has the Highest Percentage of Renter-Occupied Units in Buzzards Bay, MA with 100.0%.
What is the Percentage of Renter-Occupied Units in Buzzards Bay, MA?
Percentage of Renter-Occupied Units in Buzzards Bay is 26.1%.
What is the Percentage of Renter-Occupied Units in Massachusetts?
Percentage of Renter-Occupied Units in Massachusetts is 37.6%.
What is the Percentage of Renter-Occupied Units in the United States?
Percentage of Renter-Occupied Units in the United States is 35.2%.