Zip Codes with the Highest Percentage of Households Heated by Bottled Gas / Liquid Propane in Macon, GA
RELATED REPORTS & OPTIONS
Bottled Gas / LP Heating
Macon
Compare Zip Codes
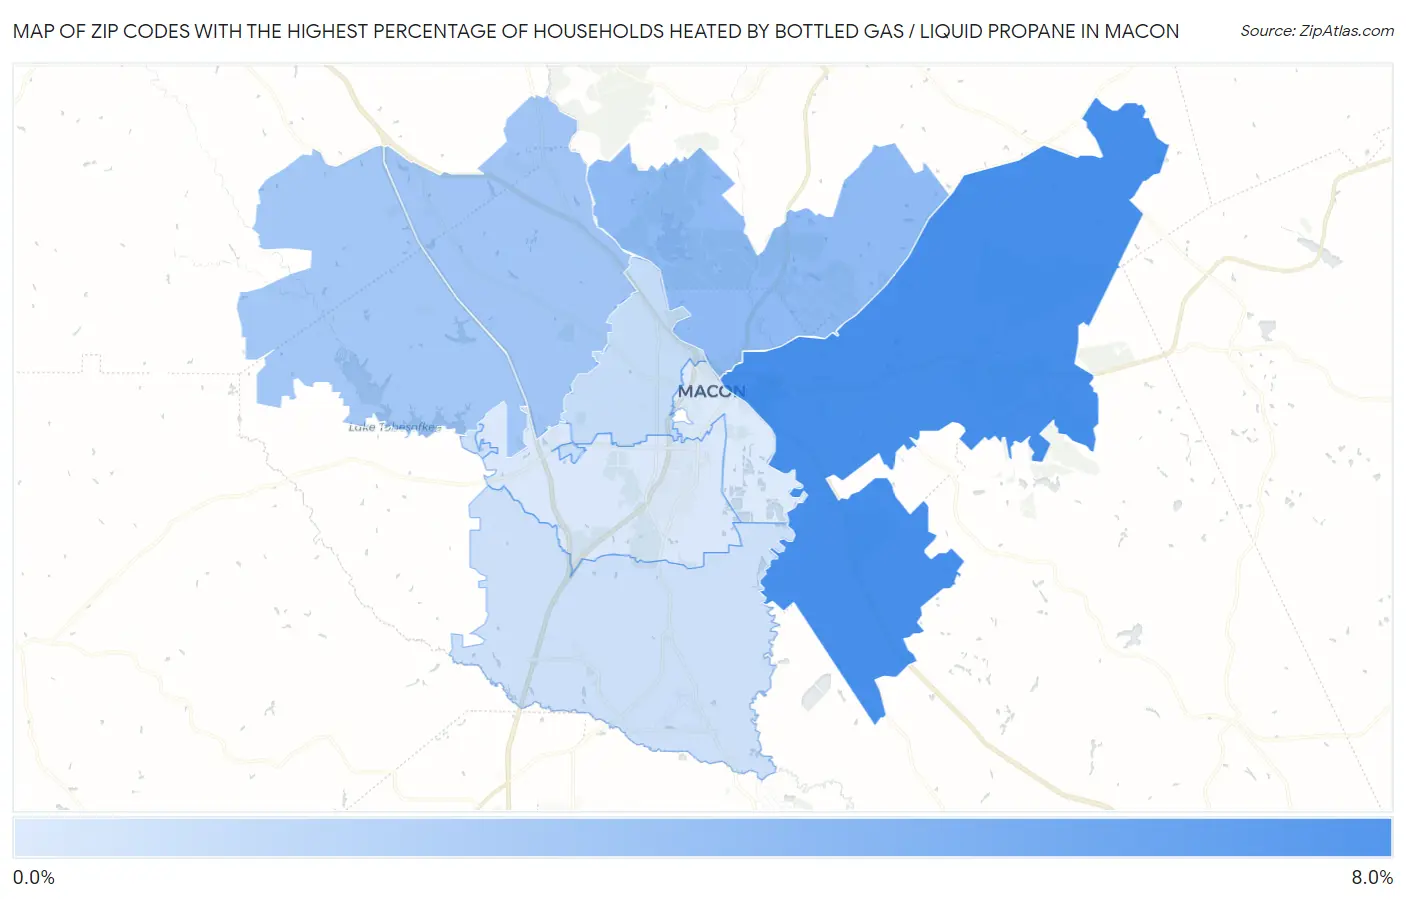
Map of Zip Codes with the Highest Percentage of Households Heated by Bottled Gas / Liquid Propane in Macon
0.0%
8.0%
Zip Codes with the Highest Percentage of Households Heated by Bottled Gas / Liquid Propane in Macon, GA
| Zip Code | Bottled Gas / LP Heating | vs State | vs National | |
| 1. | 31217 | 6.3% | 4.4%(+1.90)#319 | 4.9%(+1.40)#17,322 |
| 2. | 31211 | 3.5% | 4.4%(-0.900)#424 | 4.9%(-1.40)#20,257 |
| 3. | 31210 | 2.8% | 4.4%(-1.60)#463 | 4.9%(-2.10)#21,347 |
| 4. | 31220 | 2.7% | 4.4%(-1.70)#474 | 4.9%(-2.20)#21,576 |
| 5. | 31204 | 1.4% | 4.4%(-3.00)#581 | 4.9%(-3.50)#25,085 |
| 6. | 31216 | 1.1% | 4.4%(-3.30)#615 | 4.9%(-3.80)#26,346 |
| 7. | 31206 | 0.60% | 4.4%(-3.80)#661 | 4.9%(-4.30)#28,270 |
| 8. | 31201 | 0.50% | 4.4%(-3.90)#675 | 4.9%(-4.40)#28,740 |
1
Common Questions
What are the Top 5 Zip Codes with the Highest Percentage of Households Heated by Bottled Gas / Liquid Propane in Macon, GA?
Top 5 Zip Codes with the Highest Percentage of Households Heated by Bottled Gas / Liquid Propane in Macon, GA are:
What zip code has the Highest Percentage of Households Heated by Bottled Gas / Liquid Propane in Macon, GA?
31217 has the Highest Percentage of Households Heated by Bottled Gas / Liquid Propane in Macon, GA with 6.3%.
What is the Percentage of Households Heated by Bottled Gas / Liquid Propane in Georgia?
Percentage of Households Heated by Bottled Gas / Liquid Propane in Georgia is 4.4%.
What is the Percentage of Households Heated by Bottled Gas / Liquid Propane in the United States?
Percentage of Households Heated by Bottled Gas / Liquid Propane in the United States is 4.9%.