Zip Codes with the Highest Percentage of Population Employed in Farming, Fishing & Forestry in Largo, FL

RELATED REPORTS & OPTIONS

Farming, Fishing & Forestry
Population
Families and Households
Female Fertility
Female Fertility (Unmarried)
Race (Community Size)
Race (Percentage)
Ancestry (Community Size)
AfricanAlbanianAmericanArabArgentineanArmenianAustrianBahamianBelgianBhutaneseBrazilianBritishBulgarianBurmeseCanadianCentral AmericanCherokeeChileanChoctawColombianCroatianCubanCzechCzechoslovakianDanishDominicanDutchEastern EuropeanEcuadorianEnglishEuropeanFinnishFrenchFrench American IndianFrench CanadianGermanGreekGuyaneseHaitianHungarianIndian (Asian)IrishIsraeliItalianJamaicanKoreanLatvianLebaneseLithuanianMexicanNative HawaiianNicaraguanNorthern EuropeanNorwegianPakistaniPennsylvania GermanPeruvianPolishPortuguesePuerto RicanRomanianRussianSalvadoranScandinavianScotch-IrishScottishSeminoleSerbianSiouxSlavicSlovakSloveneSouth AmericanSouth American IndianSpaniardSpanishSri LankanSubsaharan AfricanSwedishSwissSyrianThaiTrinidadian and TobagonianUkrainianVenezuelanWelshWest IndianYugoslavian
Ancestry (Percentage)
AfricanAlbanianAmericanArabArgentineanArmenianAustrianBahamianBelgianBhutaneseBrazilianBritishBulgarianBurmeseCanadianCentral AmericanCherokeeChileanChoctawColombianCroatianCubanCzechCzechoslovakianDanishDominicanDutchEastern EuropeanEcuadorianEnglishEuropeanFinnishFrenchFrench American IndianFrench CanadianGermanGreekGuyaneseHaitianHungarianIndian (Asian)IrishIsraeliItalianJamaicanKoreanLatvianLebaneseLithuanianMexicanNative HawaiianNicaraguanNorthern EuropeanNorwegianPakistaniPennsylvania GermanPeruvianPolishPortuguesePuerto RicanRomanianRussianSalvadoranScandinavianScotch-IrishScottishSeminoleSerbianSiouxSlavicSlovakSloveneSouth AmericanSouth American IndianSpaniardSpanishSri LankanSubsaharan AfricanSwedishSwissSyrianThaiTrinidadian and TobagonianUkrainianVenezuelanWelshWest IndianYugoslavian
Immigrant Origin (Total)
Immigrant Origin (Percentage)
Income
Income (Families)
Income (Households)
Poverty
Poverty (Families)
Unemployment
Employment Occupations
Employment Industries
Employer Class
Commute Time
Commute Means
School Enrollment
Education by Degree Field
Occupancy
Finances
Physical Characteristics
Largo
Compare Zip Codes
Comparison Subject

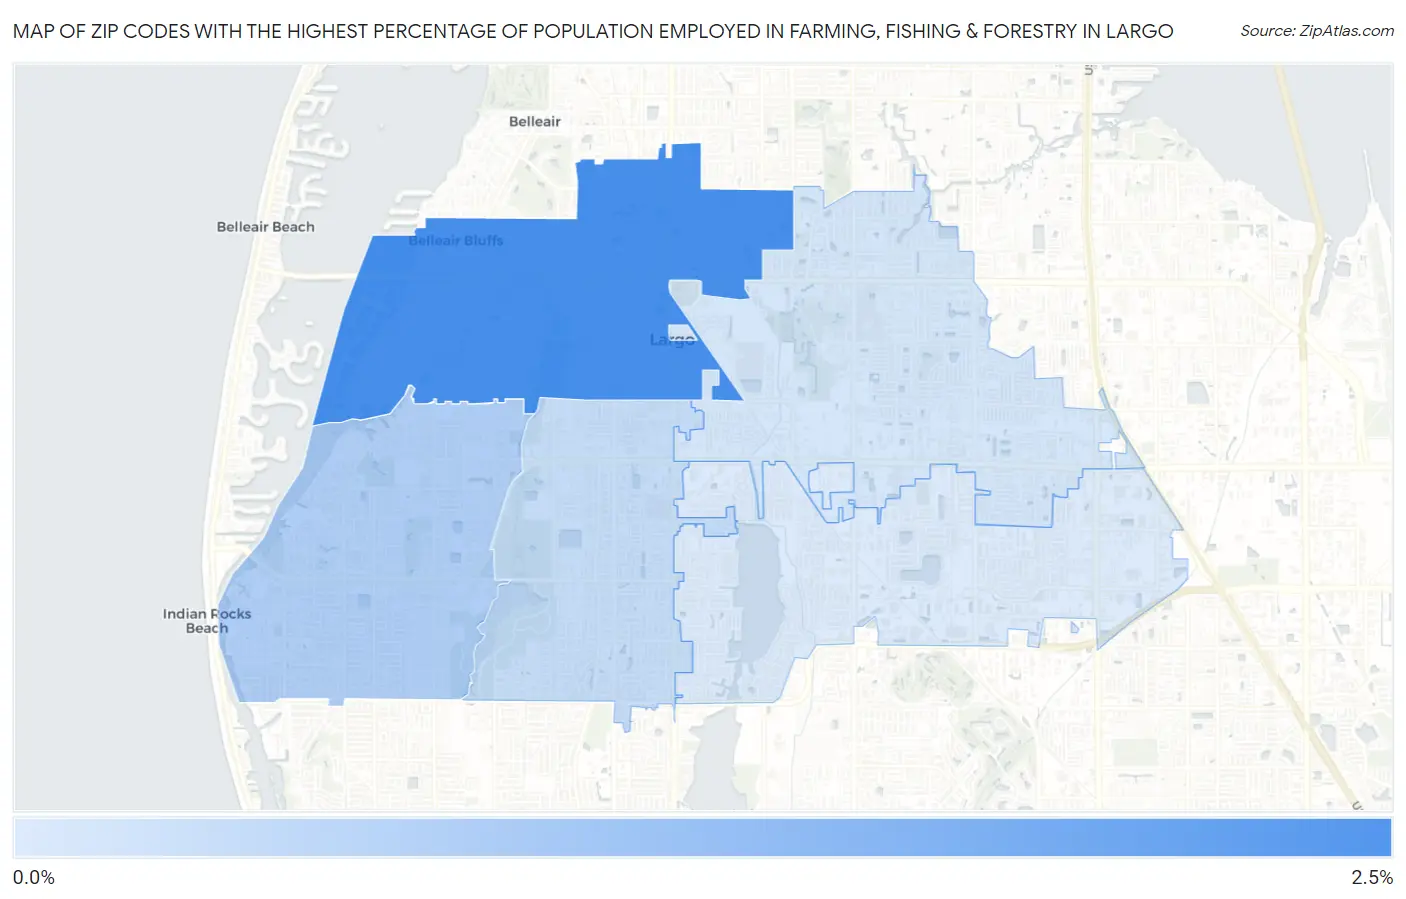
Map of Zip Codes with the Highest Percentage of Population Employed in Farming, Fishing & Forestry in Largo

0.0%
2.5%
Zip Codes with the Highest Percentage of Population Employed in Farming, Fishing & Forestry in Largo Map

Zip Codes with the Highest Percentage of Population Employed in Farming, Fishing & Forestry in Largo, FL

Zip Code % Employed vs State vs National
1.337702.1%0.47%(+1.61)#1060.61%(+1.48)#6,362
2.337740.68%0.47%(+0.215)#2320.61%(+0.078)#11,490
3.337780.36%0.47%(-0.113)#3570.61%(-0.250)#14,196
4.337710.14%0.47%(-0.331)#5060.61%(-0.468)#17,149
5.337730.056%0.47%(-0.412)#5950.61%(-0.549)#18,546

Common Questions

What are the Top 3 Zip Codes with the Highest Percentage of Population Employed in Farming, Fishing & Forestry in Largo, FL?
Top 3 Zip Codes with the Highest Percentage of Population Employed in Farming, Fishing & Forestry in Largo, FL are:
#1
2.1%
#2
0.68%
#3
0.36%
What zip code has the Highest Percentage of Population Employed in Farming, Fishing & Forestry in Largo, FL?
33770 has the Highest Percentage of Population Employed in Farming, Fishing & Forestry in Largo, FL with 2.1%.
What is the Percentage of Population Employed in Farming, Fishing & Forestry in Largo, FL?
Percentage of Population Employed in Farming, Fishing & Forestry in Largo is 0.81%.
What is the Percentage of Population Employed in Farming, Fishing & Forestry in Florida?
Percentage of Population Employed in Farming, Fishing & Forestry in Florida is 0.47%.
What is the Percentage of Population Employed in Farming, Fishing & Forestry in the United States?
Percentage of Population Employed in Farming, Fishing & Forestry in the United States is 0.61%.