Zip Codes with the Highest Percentage of Population Employed in Agriculture, Fishing & Hunting in Santa Barbara, CA
RELATED REPORTS & OPTIONS
Agriculture, Fishing & Hunting
Santa Barbara
Compare Zip Codes
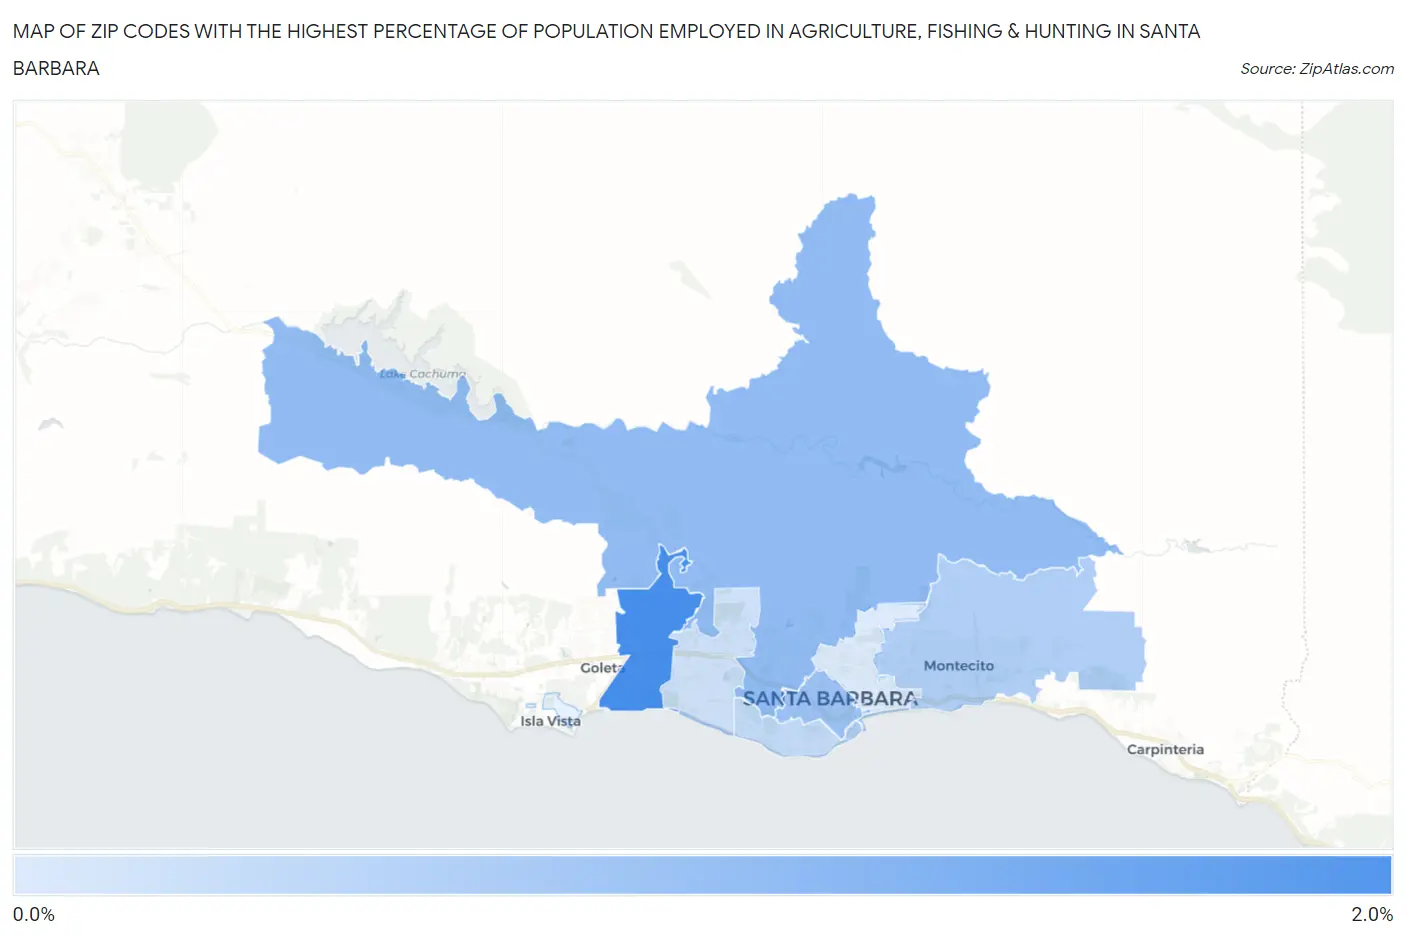
Map of Zip Codes with the Highest Percentage of Population Employed in Agriculture, Fishing & Hunting in Santa Barbara
0.0%
2.0%
Zip Codes with the Highest Percentage of Population Employed in Agriculture, Fishing & Hunting in Santa Barbara, CA
| Zip Code | % Employed | vs State | vs National | |
| 1. | 93111 | 2.0% | 2.0%(-0.035)#564 | 1.2%(+0.752)#12,895 |
| 2. | 93105 | 1.1% | 2.0%(-0.877)#707 | 1.2%(-0.091)#15,768 |
| 3. | 93101 | 1.00% | 2.0%(-0.990)#729 | 1.2%(-0.204)#16,239 |
| 4. | 93108 | 0.75% | 2.0%(-1.24)#819 | 1.2%(-0.453)#17,564 |
| 5. | 93109 | 0.55% | 2.0%(-1.43)#926 | 1.2%(-0.646)#18,827 |
| 6. | 93110 | 0.40% | 2.0%(-1.58)#1,033 | 1.2%(-0.796)#20,126 |
| 7. | 93103 | 0.26% | 2.0%(-1.73)#1,163 | 1.2%(-0.941)#21,671 |
1
Common Questions
What are the Top 5 Zip Codes with the Highest Percentage of Population Employed in Agriculture, Fishing & Hunting in Santa Barbara, CA?
Top 5 Zip Codes with the Highest Percentage of Population Employed in Agriculture, Fishing & Hunting in Santa Barbara, CA are:
What zip code has the Highest Percentage of Population Employed in Agriculture, Fishing & Hunting in Santa Barbara, CA?
93111 has the Highest Percentage of Population Employed in Agriculture, Fishing & Hunting in Santa Barbara, CA with 2.0%.
What is the Percentage of Population Employed in Agriculture, Fishing & Hunting in Santa Barbara, CA?
Percentage of Population Employed in Agriculture, Fishing & Hunting in Santa Barbara is 0.66%.
What is the Percentage of Population Employed in Agriculture, Fishing & Hunting in California?
Percentage of Population Employed in Agriculture, Fishing & Hunting in California is 2.0%.
What is the Percentage of Population Employed in Agriculture, Fishing & Hunting in the United States?
Percentage of Population Employed in Agriculture, Fishing & Hunting in the United States is 1.2%.