Zip Codes with the Highest Percentage of Population Employed in Agriculture, Fishing & Hunting in Lake Elsinore, CA
RELATED REPORTS & OPTIONS
Agriculture, Fishing & Hunting
Lake Elsinore
Compare Zip Codes
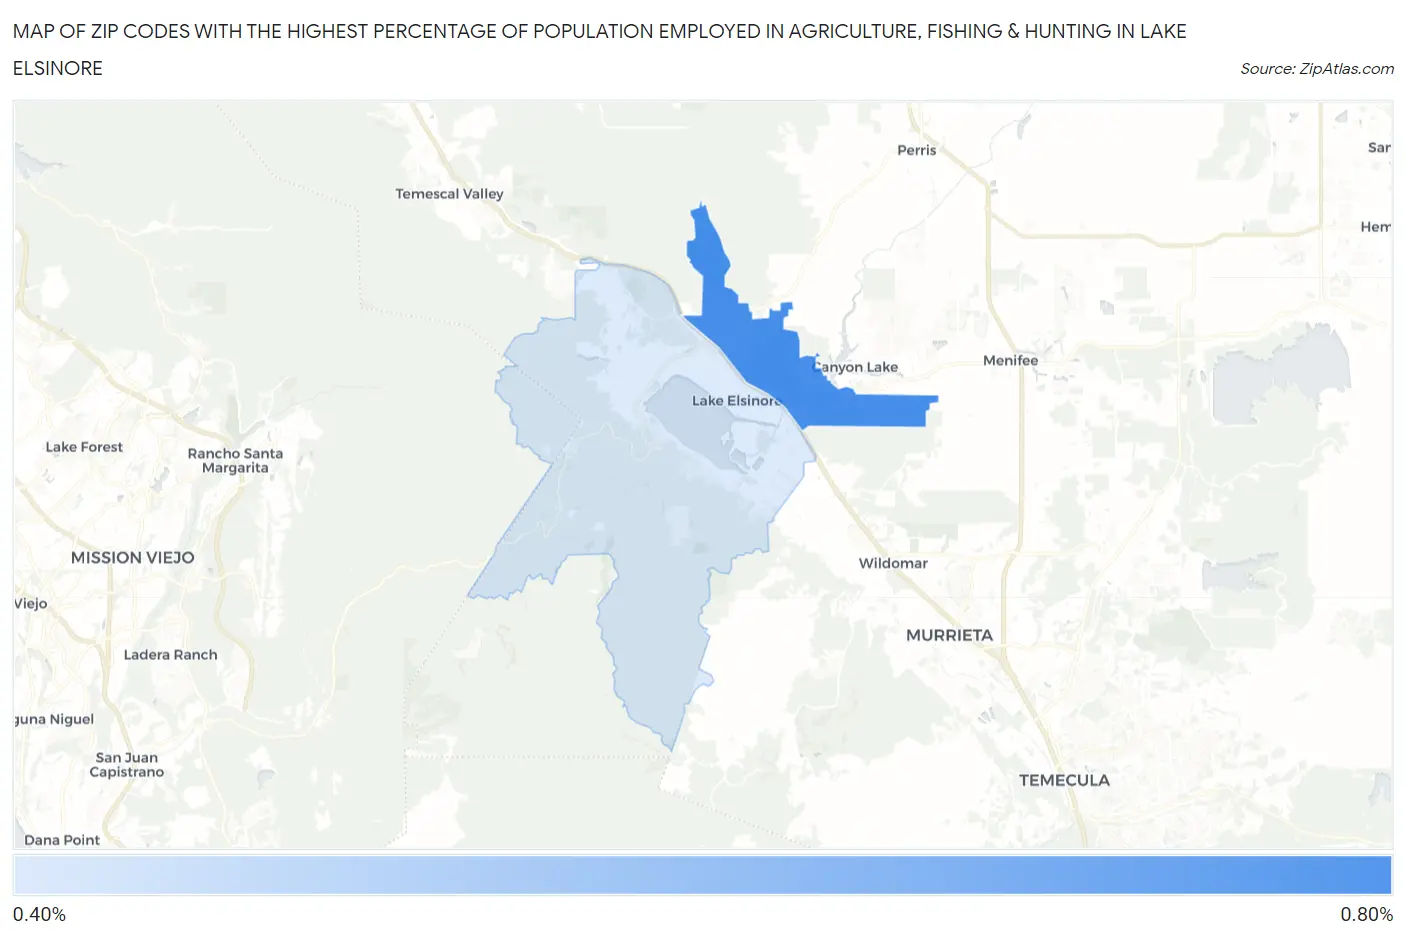
Map of Zip Codes with the Highest Percentage of Population Employed in Agriculture, Fishing & Hunting in Lake Elsinore
0.0%
0.80%
Zip Codes with the Highest Percentage of Population Employed in Agriculture, Fishing & Hunting in Lake Elsinore, CA
| Zip Code | % Employed | vs State | vs National | |
| 1. | 92532 | 0.73% | 2.0%(-1.26)#826 | 1.2%(-0.471)#17,681 |
| 2. | 92530 | 0.44% | 2.0%(-1.55)#1,016 | 1.2%(-0.763)#19,831 |
1
Common Questions
What are the Top Zip Codes with the Highest Percentage of Population Employed in Agriculture, Fishing & Hunting in Lake Elsinore, CA?
Top Zip Codes with the Highest Percentage of Population Employed in Agriculture, Fishing & Hunting in Lake Elsinore, CA are:
What zip code has the Highest Percentage of Population Employed in Agriculture, Fishing & Hunting in Lake Elsinore, CA?
92532 has the Highest Percentage of Population Employed in Agriculture, Fishing & Hunting in Lake Elsinore, CA with 0.73%.
What is the Percentage of Population Employed in Agriculture, Fishing & Hunting in Lake Elsinore, CA?
Percentage of Population Employed in Agriculture, Fishing & Hunting in Lake Elsinore is 0.49%.
What is the Percentage of Population Employed in Agriculture, Fishing & Hunting in California?
Percentage of Population Employed in Agriculture, Fishing & Hunting in California is 2.0%.
What is the Percentage of Population Employed in Agriculture, Fishing & Hunting in the United States?
Percentage of Population Employed in Agriculture, Fishing & Hunting in the United States is 1.2%.