Zip Codes with the Highest Percentage of Population Employed in Agriculture, Fishing & Hunting in Bakersfield, CA

RELATED REPORTS & OPTIONS

Agriculture, Fishing & Hunting
Population
Families and Households
Female Fertility
Female Fertility (Unmarried)
Race (Community Size)
Race (Percentage)
Ancestry (Community Size)
AfghanAfricanAlaska NativeAmericanApacheArabArgentineanArmenianAustralianAustrianBangladeshiBasqueBelgianBelizeanBhutaneseBlackfeetBolivianBrazilianBritishBulgarianBurmeseCanadianCentral AmericanCentral American IndianCherokeeCheyenneChickasawChippewaChoctawColombianComancheCosta RicanCreeCreekCroatianCubanCzechCzechoslovakianDanishDominicanDutchDutch West IndianEastern EuropeanEcuadorianEgyptianEnglishEthiopianEuropeanFilipinoFinnishFrenchFrench American IndianFrench CanadianGermanGhanaianGreekGuamanian / ChamorroGuatemalanHaitianHonduranHopiHungarianIndian (Asian)IndonesianIranianIrishIroquoisItalianJamaicanJapaneseJordanianKiowaKoreanLaotianLatvianLebaneseLithuanianLumbeeLuxembourgerMalaysianMexicanMexican American IndianMongolianMoroccanNative HawaiianNavajoNicaraguanNigerianNorthern EuropeanNorwegianPaiutePakistaniPalestinianPanamanianPeruvianPolishPortuguesePotawatomiPuebloPuerto RicanRomanianRussianSalvadoranSamoanScandinavianScotch-IrishScottishSeminoleSerbianSiouxSlavicSlovakSouth AfricanSouth AmericanSouth American IndianSpaniardSpanishSpanish AmericanSri LankanSubsaharan AfricanSwedishSwissSyrianThaiTonganTurkishUkrainianVenezuelanVietnameseWelshWest IndianYaquiYugoslavian
Ancestry (Percentage)
AfghanAfricanAlaska NativeAmericanApacheArabArgentineanArmenianAustralianAustrianBangladeshiBasqueBelgianBelizeanBhutaneseBlackfeetBolivianBrazilianBritishBulgarianBurmeseCanadianCentral AmericanCentral American IndianCherokeeCheyenneChickasawChippewaChoctawColombianComancheCosta RicanCreeCreekCroatianCubanCzechCzechoslovakianDanishDominicanDutchDutch West IndianEastern EuropeanEcuadorianEgyptianEnglishEthiopianEuropeanFilipinoFinnishFrenchFrench American IndianFrench CanadianGermanGhanaianGreekGuamanian / ChamorroGuatemalanHaitianHonduranHopiHungarianIndian (Asian)IndonesianIranianIrishIroquoisItalianJamaicanJapaneseJordanianKiowaKoreanLaotianLatvianLebaneseLithuanianLumbeeLuxembourgerMalaysianMexicanMexican American IndianMongolianMoroccanNative HawaiianNavajoNicaraguanNigerianNorthern EuropeanNorwegianPaiutePakistaniPalestinianPanamanianPeruvianPolishPortuguesePotawatomiPuebloPuerto RicanRomanianRussianSalvadoranSamoanScandinavianScotch-IrishScottishSeminoleSerbianSiouxSlavicSlovakSouth AfricanSouth AmericanSouth American IndianSpaniardSpanishSpanish AmericanSri LankanSubsaharan AfricanSwedishSwissSyrianThaiTonganTurkishUkrainianVenezuelanVietnameseWelshWest IndianYaquiYugoslavian
Immigrant Origin (Total)
Immigrant Origin (Percentage)
Income
Income (Families)
Income (Households)
Poverty
Poverty (Families)
Unemployment
Employment Occupations
Employment Industries
Employer Class
Commute Time
Commute Means
School Enrollment
Education by Degree Field
Occupancy
Finances
Physical Characteristics
Bakersfield
States
California Cities
AlamedaAlhambraAnaheimAntiochApple ValleyArcadiaAuburnBakersfieldBerkeleyBuena ParkBurbankCamarilloCanoga ParkCanyon CountryCarlsbadCastro ValleyChicoChula VistaCitrus HeightsClovisComptonConcordCoronaCosta MesaCovinaCulver CityDaly CityDanvilleDavisDesert Hot SpringsDowneyDuarteEl CajonEl MonteElk GroveEncinoEscondidoEurekaFairfieldFontanaFremontFresnoFullertonGarden GroveGardenaGlendaleGlendoraGrass ValleyHaywardHemetHesperiaHuntington BeachIndioInglewoodIrvineLa MesaLa PuenteLake ElsinoreLakewoodLancasterLivermoreLodiLompocLong BeachLos AltosLos AngelesLos GatosMaderaMantecaMenifeeMercedMission ViejoModestoMoreno ValleyMountain ViewMurrietaNapaNorth HollywoodNovatoOaklandOceansideOntarioOrangeOrovilleOxnardPalm SpringsPalmdalePalo AltoPasadenaPerrisPetalumaPleasantonPomonaPortervilleRancho CordovaRancho CucamongaReddingRedlandsRedondo BeachRedwood CityRialtoRichmondRiversideRocklinRosevilleSacramentoSalinasSan BernardinoSan DiegoSan FranciscoSan GabrielSan JacintoSan JoseSan LeandroSan Luis ObispoSan MarcosSan MateoSan PedroSan RafaelSanta AnaSanta BarbaraSanta ClaraSanta CruzSanta MariaSanta MonicaSanta RosaSherman OaksSimi ValleySpring ValleyStocktonSunnyvaleTemeculaThousand OaksTorranceTrabuco CanyonTracyTurlockTustinUplandVacavilleValenciaVallejoVan NuysVenturaVictorvilleVisaliaVistaWalnut CreekWest CovinaWest SacramentoWhittierWoodlandWoodland HillsYorba LindaYuba City
Compare Zip Codes
Comparison Subject

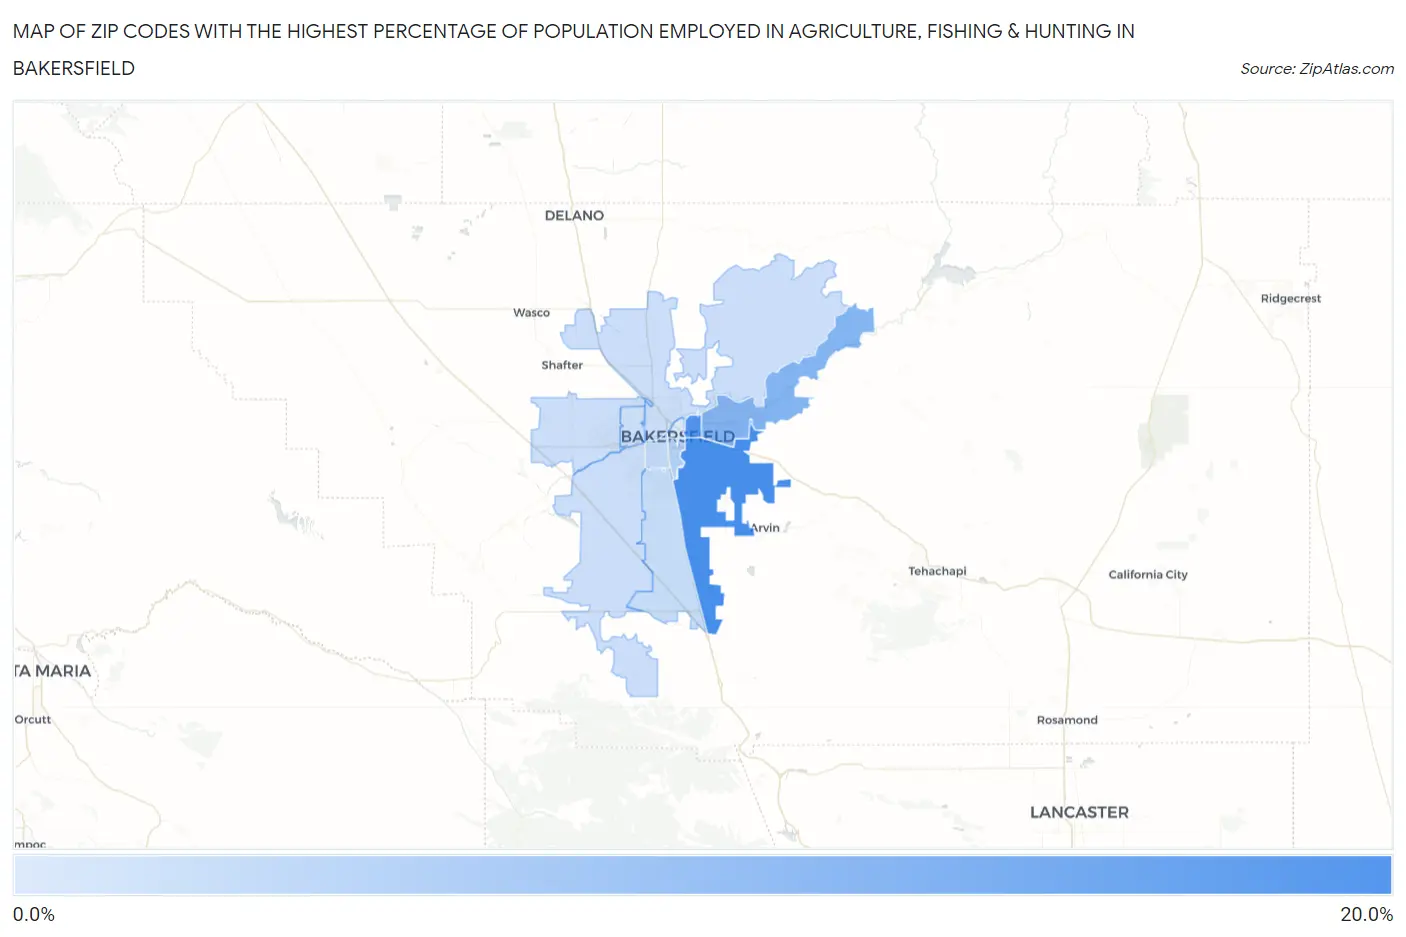
Map of Zip Codes with the Highest Percentage of Population Employed in Agriculture, Fishing & Hunting in Bakersfield

0.0%
20.0%
Zip Codes with the Highest Percentage of Population Employed in Agriculture, Fishing & Hunting in Bakersfield Map

Zip Codes with the Highest Percentage of Population Employed in Agriculture, Fishing & Hunting in Bakersfield, CA

Zip Code % Employed vs State vs National
1.9330719.6%2.0%(+17.6)#1451.2%(+18.4)#1,835
2.9330518.4%2.0%(+16.4)#1561.2%(+17.2)#2,002
3.9330611.8%2.0%(+9.79)#2321.2%(+10.6)#3,579
4.933045.8%2.0%(+3.86)#3581.2%(+4.65)#7,047
5.933094.1%2.0%(+2.10)#4301.2%(+2.89)#8,912
6.933134.0%2.0%(+1.99)#4351.2%(+2.78)#9,047
7.933113.5%2.0%(+1.48)#4591.2%(+2.27)#9,806
8.933143.4%2.0%(+1.39)#4631.2%(+2.18)#9,931
9.933083.2%2.0%(+1.23)#4691.2%(+2.02)#10,184
10.933122.7%2.0%(+0.747)#5021.2%(+1.53)#11,076
11.933011.3%2.0%(-0.729)#6691.2%(+0.057)#15,191

Common Questions

What are the Top 10 Zip Codes with the Highest Percentage of Population Employed in Agriculture, Fishing & Hunting in Bakersfield, CA?
Top 10 Zip Codes with the Highest Percentage of Population Employed in Agriculture, Fishing & Hunting in Bakersfield, CA are:
#1
19.6%
#2
18.4%
#3
11.8%
#4
5.8%
#5
4.1%
#6
4.0%
#7
3.5%
#8
3.4%
#9
3.2%
#10
2.7%
What zip code has the Highest Percentage of Population Employed in Agriculture, Fishing & Hunting in Bakersfield, CA?
93307 has the Highest Percentage of Population Employed in Agriculture, Fishing & Hunting in Bakersfield, CA with 19.6%.
What is the Percentage of Population Employed in Agriculture, Fishing & Hunting in Bakersfield, CA?
Percentage of Population Employed in Agriculture, Fishing & Hunting in Bakersfield is 5.7%.
What is the Percentage of Population Employed in Agriculture, Fishing & Hunting in California?
Percentage of Population Employed in Agriculture, Fishing & Hunting in California is 2.0%.
What is the Percentage of Population Employed in Agriculture, Fishing & Hunting in the United States?
Percentage of Population Employed in Agriculture, Fishing & Hunting in the United States is 1.2%.