Zip Codes with the Highest Percentage of Renter-Occupied Units in Bella Vista, AR
RELATED REPORTS & OPTIONS
Highest Renter-Occupied
Bella Vista
Compare Zip Codes
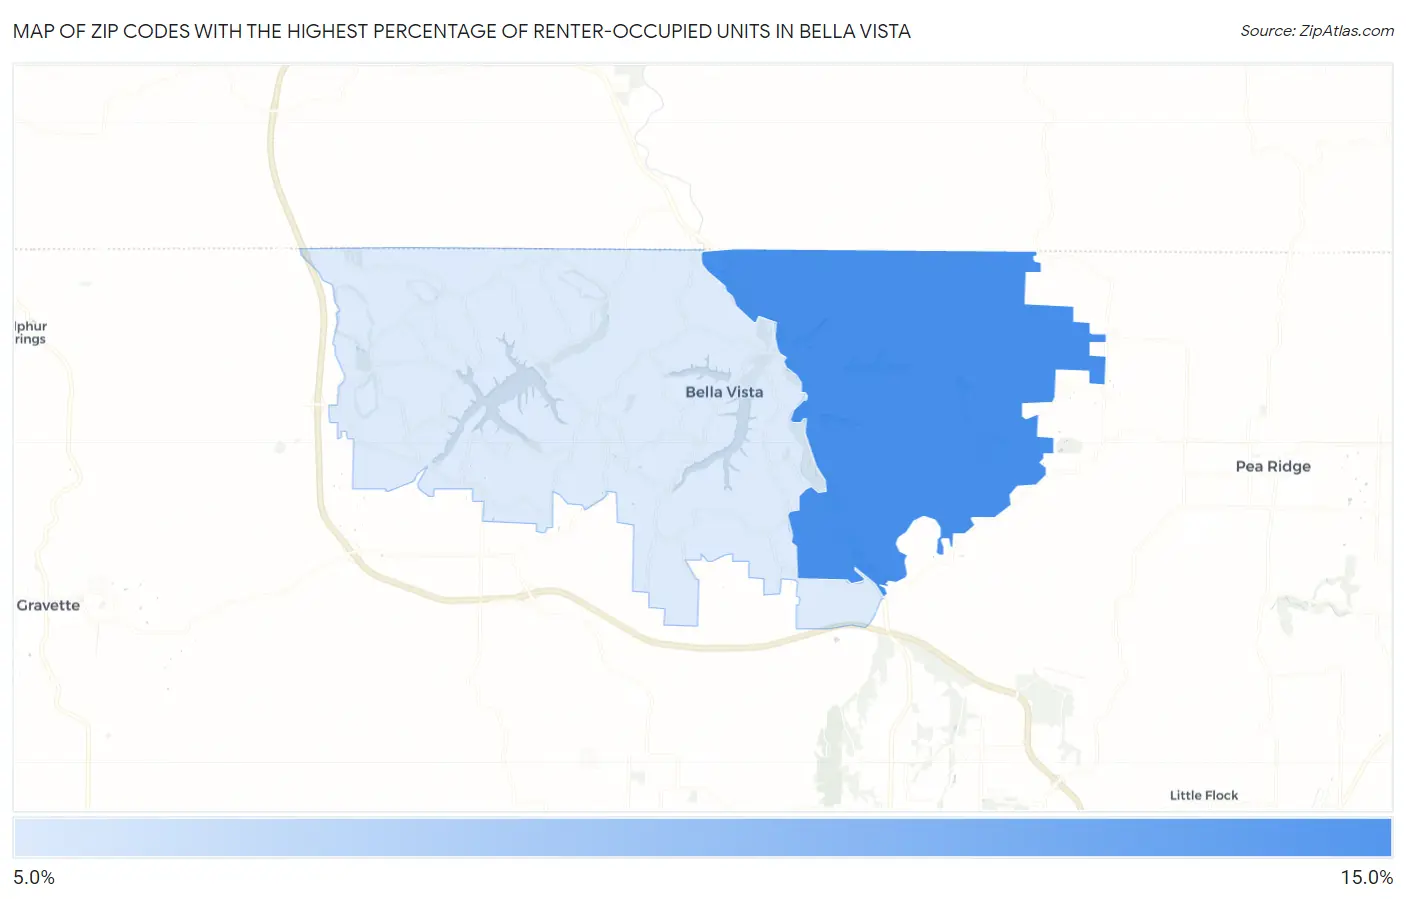
Map of Zip Codes with the Highest Percentage of Renter-Occupied Units in Bella Vista
0.0%
15.0%
Zip Codes with the Highest Percentage of Renter-Occupied Units in Bella Vista, AR
| Zip Code | % Renter-Occupied | vs State | vs National | |
| 1. | 72714 | 12.1% | 33.8%(-21.7)#454 | 35.2%(-23.1)#25,698 |
| 2. | 72715 | 11.6% | 33.8%(-22.2)#465 | 35.2%(-23.6)#26,126 |
1
Common Questions
What are the Top Zip Codes with the Highest Percentage of Renter-Occupied Units in Bella Vista, AR?
Top Zip Codes with the Highest Percentage of Renter-Occupied Units in Bella Vista, AR are:
What zip code has the Highest Percentage of Renter-Occupied Units in Bella Vista, AR?
72714 has the Highest Percentage of Renter-Occupied Units in Bella Vista, AR with 12.1%.
What is the Percentage of Renter-Occupied Units in Bella Vista, AR?
Percentage of Renter-Occupied Units in Bella Vista is 11.6%.
What is the Percentage of Renter-Occupied Units in Arkansas?
Percentage of Renter-Occupied Units in Arkansas is 33.8%.
What is the Percentage of Renter-Occupied Units in the United States?
Percentage of Renter-Occupied Units in the United States is 35.2%.