Houma Married-couple Households
COMPARE
Houma
Select to Compare
Married-couple Households
Houma Married-couple Households
44.6%
MARRIED-COUPLE HOUSEHOLDS
1.5/ 100
METRIC RATING
231st/ 347
METRIC RANK
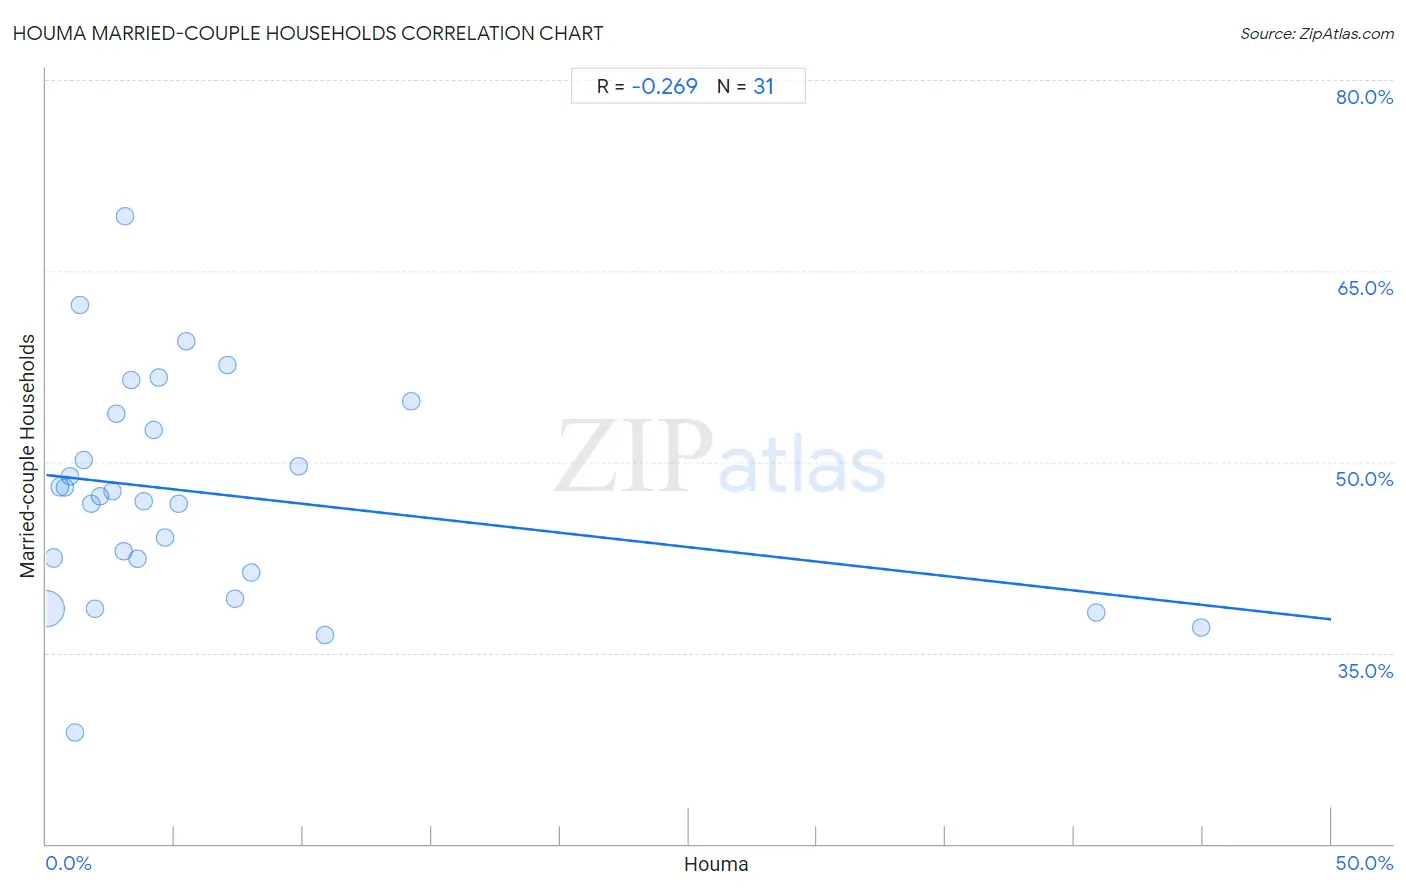
Houma Married-couple Households Correlation Chart
The statistical analysis conducted on geographies consisting of 36,791,862 people shows a weak negative correlation between the proportion of Houma and percentage of married-couple family households in the United States with a correlation coefficient (R) of -0.269 and weighted average of 44.6%. On average, for every 1% (one percent) increase in Houma within a typical geography, there is a decrease of 0.23% in percentage of married-couple family households.
It is essential to understand that the correlation between the percentage of Houma and percentage of married-couple family households does not imply a direct cause-and-effect relationship. It remains uncertain whether the presence of Houma influences an upward or downward trend in the level of percentage of married-couple family households within an area, or if Houma simply ended up residing in those areas with higher or lower levels of percentage of married-couple family households due to other factors.
Demographics Similar to Houma by Married-couple Households
In terms of married-couple households, the demographic groups most similar to Houma are Marshallese (44.6%, a difference of 0.0%), Soviet Union (44.6%, a difference of 0.010%), Immigrants from Uganda (44.6%, a difference of 0.040%), Immigrants from Latin America (44.7%, a difference of 0.050%), and Kenyan (44.7%, a difference of 0.10%).
| Demographics | Rating | Rank | Married-couple Households |
| Immigrants from Micronesia | 2.6 /100 | #224 | Tragic 44.9% |
| Dutch West Indians | 2.6 /100 | #225 | Tragic 44.9% |
| Alsatians | 2.3 /100 | #226 | Tragic 44.8% |
| Salvadorans | 1.9 /100 | #227 | Tragic 44.7% |
| Kenyans | 1.7 /100 | #228 | Tragic 44.7% |
| Immigrants from Latin America | 1.6 /100 | #229 | Tragic 44.7% |
| Soviet Union | 1.6 /100 | #230 | Tragic 44.6% |
| Houma | 1.5 /100 | #231 | Tragic 44.6% |
| Marshallese | 1.5 /100 | #232 | Tragic 44.6% |
| Immigrants from Uganda | 1.5 /100 | #233 | Tragic 44.6% |
| Immigrants from Panama | 1.3 /100 | #234 | Tragic 44.6% |
| Immigrants from Nicaragua | 1.2 /100 | #235 | Tragic 44.5% |
| Yaqui | 1.2 /100 | #236 | Tragic 44.5% |
| Comanche | 1.2 /100 | #237 | Tragic 44.5% |
| Immigrants from Uruguay | 1.1 /100 | #238 | Tragic 44.5% |
Houma Married-couple Households Correlation Summary
| Measurement | Houma Data | Married-couple Households Data |
| Minimum | 0.012% | 28.8% |
| Maximum | 44.9% | 69.3% |
| Range | 44.9% | 40.6% |
| Mean | 6.5% | 47.5% |
| Median | 3.3% | 47.3% |
| Interquartile 25% (IQ1) | 1.5% | 41.3% |
| Interquartile 75% (IQ3) | 7.0% | 53.8% |
| Interquartile Range (IQR) | 5.6% | 12.5% |
| Standard Deviation (Sample) | 10.3% | 8.7% |
| Standard Deviation (Population) | 10.1% | 8.5% |
Correlation Details
| Houma Percentile | Sample Size | Married-couple Households |
[ 0.0% - 0.5% ] 0.012% | 35,258,017 | 38.5% |
[ 0.0% - 0.5% ] 0.28% | 568,821 | 42.4% |
[ 0.5% - 1.0% ] 0.52% | 304,570 | 48.0% |
[ 0.5% - 1.0% ] 0.71% | 264,900 | 48.0% |
[ 0.5% - 1.0% ] 0.93% | 85,949 | 48.9% |
[ 1.0% - 1.5% ] 1.10% | 43,230 | 28.8% |
[ 1.0% - 1.5% ] 1.32% | 4,545 | 62.3% |
[ 1.0% - 1.5% ] 1.47% | 25,087 | 50.1% |
[ 1.5% - 2.0% ] 1.77% | 15,031 | 46.7% |
[ 1.5% - 2.0% ] 1.89% | 11,415 | 38.5% |
[ 2.0% - 2.5% ] 2.09% | 8,600 | 47.3% |
[ 2.5% - 3.0% ] 2.58% | 9,287 | 47.7% |
[ 2.5% - 3.0% ] 2.71% | 7,961 | 53.8% |
[ 2.5% - 3.0% ] 3.00% | 26,788 | 43.0% |
[ 3.0% - 3.5% ] 3.09% | 5,118 | 69.3% |
[ 3.0% - 3.5% ] 3.31% | 5,677 | 56.4% |
[ 3.5% - 4.0% ] 3.56% | 33,094 | 42.4% |
[ 3.5% - 4.0% ] 3.79% | 15,373 | 46.9% |
[ 4.0% - 4.5% ] 4.21% | 11,624 | 52.5% |
[ 4.0% - 4.5% ] 4.40% | 2,386 | 56.7% |
[ 4.5% - 5.0% ] 4.63% | 30,192 | 44.0% |
[ 5.0% - 5.5% ] 5.16% | 35,760 | 46.8% |
[ 5.0% - 5.5% ] 5.46% | 5,845 | 59.4% |
[ 7.0% - 7.5% ] 7.04% | 3,762 | 57.6% |
[ 7.0% - 7.5% ] 7.34% | 286 | 39.2% |
[ 7.5% - 8.0% ] 7.99% | 2,880 | 41.3% |
[ 9.5% - 10.0% ] 9.84% | 2,511 | 49.6% |
[ 10.5% - 11.0% ] 10.82% | 194 | 36.4% |
[ 14.0% - 14.5% ] 14.18% | 1,347 | 54.7% |
[ 40.5% - 41.0% ] 40.88% | 844 | 38.2% |
[ 44.5% - 45.0% ] 44.92% | 768 | 37.0% |