Syrian Married-couple Households
COMPARE
Syrian
Select to Compare
Married-couple Households
Syrian Married-couple Households
47.6%
MARRIED-COUPLE HOUSEHOLDS
93.9/ 100
METRIC RATING
111th/ 347
METRIC RANK
Syrian Married-couple Households Correlation Chart
The statistical analysis conducted on geographies consisting of 266,174,556 people shows no correlation between the proportion of Syrians and percentage of married-couple family households in the United States with a correlation coefficient (R) of 0.010 and weighted average of 47.6%. On average, for every 1% (one percent) increase in Syrians within a typical geography, there is an increase of 0.016% in percentage of married-couple family households.
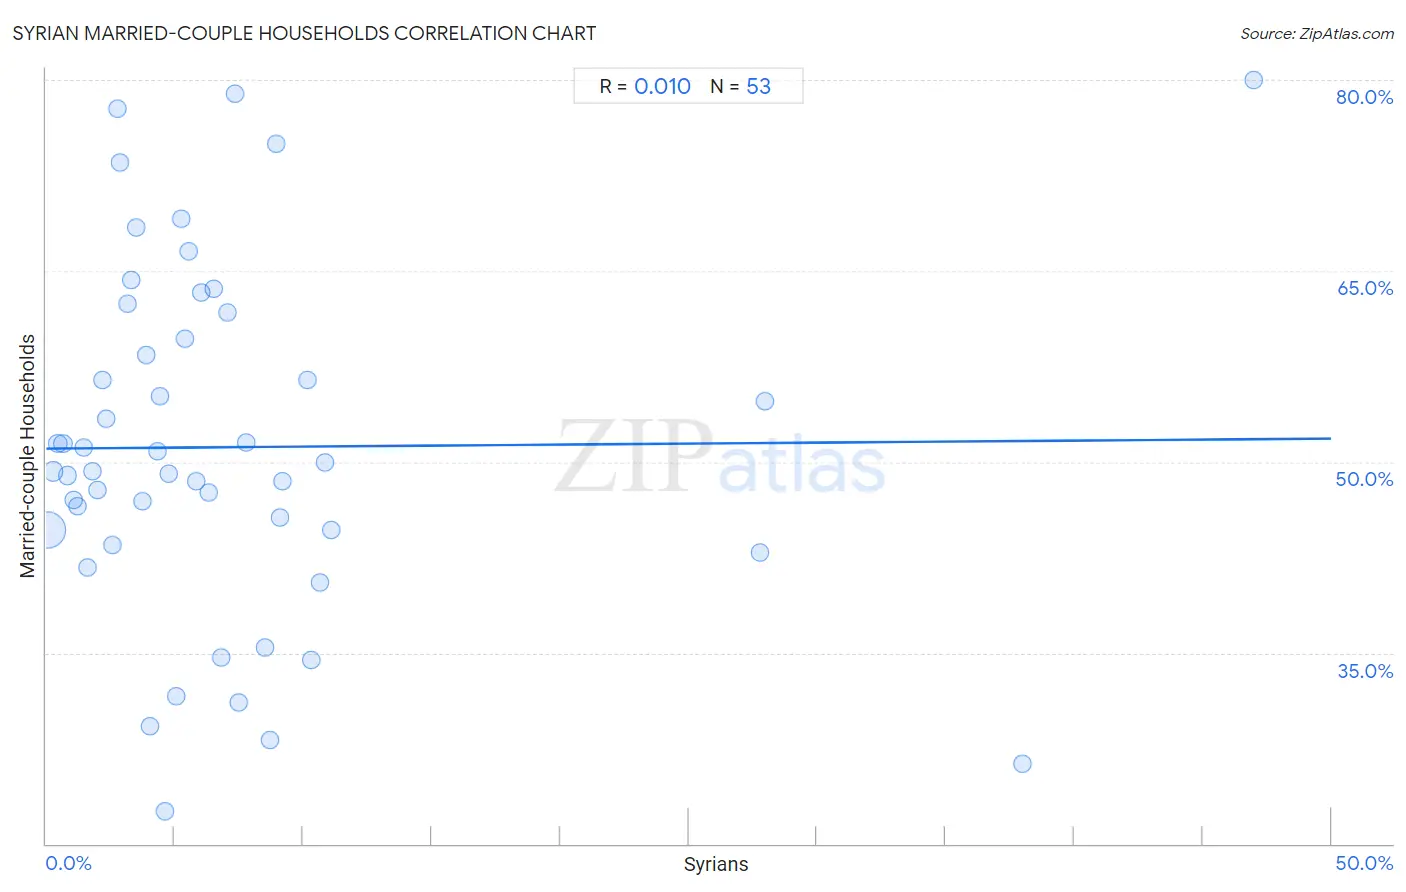
It is essential to understand that the correlation between the percentage of Syrians and percentage of married-couple family households does not imply a direct cause-and-effect relationship. It remains uncertain whether the presence of Syrians influences an upward or downward trend in the level of percentage of married-couple family households within an area, or if Syrians simply ended up residing in those areas with higher or lower levels of percentage of married-couple family households due to other factors.
Demographics Similar to Syrians by Married-couple Households
In terms of married-couple households, the demographic groups most similar to Syrians are Macedonian (47.6%, a difference of 0.0%), Peruvian (47.6%, a difference of 0.010%), Venezuelan (47.6%, a difference of 0.020%), Immigrants from Jordan (47.7%, a difference of 0.030%), and Immigrants from Europe (47.6%, a difference of 0.030%).
| Demographics | Rating | Rank | Married-couple Households |
| Immigrants from South Africa | 96.0 /100 | #104 | Exceptional 47.8% |
| Immigrants from Czechoslovakia | 95.5 /100 | #105 | Exceptional 47.8% |
| Portuguese | 95.5 /100 | #106 | Exceptional 47.8% |
| Estonians | 94.7 /100 | #107 | Exceptional 47.7% |
| Immigrants from Japan | 94.4 /100 | #108 | Exceptional 47.7% |
| Immigrants from Jordan | 94.1 /100 | #109 | Exceptional 47.7% |
| Macedonians | 93.9 /100 | #110 | Exceptional 47.6% |
| Syrians | 93.9 /100 | #111 | Exceptional 47.6% |
| Peruvians | 93.8 /100 | #112 | Exceptional 47.6% |
| Venezuelans | 93.8 /100 | #113 | Exceptional 47.6% |
| Immigrants from Europe | 93.7 /100 | #114 | Exceptional 47.6% |
| Slovaks | 92.9 /100 | #115 | Exceptional 47.6% |
| Argentineans | 92.5 /100 | #116 | Exceptional 47.5% |
| French Canadians | 92.4 /100 | #117 | Exceptional 47.5% |
| Immigrants from Germany | 92.4 /100 | #118 | Exceptional 47.5% |
Syrian Married-couple Households Correlation Summary
| Measurement | Syrian Data | Married-couple Households Data |
| Minimum | 0.066% | 22.6% |
| Maximum | 47.0% | 80.0% |
| Range | 46.9% | 57.4% |
| Mean | 7.3% | 51.2% |
| Median | 5.1% | 49.3% |
| Interquartile 25% (IQ1) | 2.5% | 44.1% |
| Interquartile 75% (IQ3) | 8.6% | 60.7% |
| Interquartile Range (IQR) | 6.1% | 16.7% |
| Standard Deviation (Sample) | 8.9% | 13.7% |
| Standard Deviation (Population) | 8.8% | 13.6% |
Correlation Details
| Syrian Percentile | Sample Size | Married-couple Households |
[ 0.0% - 0.5% ] 0.066% | 223,391,811 | 44.6% |
[ 0.0% - 0.5% ] 0.27% | 26,278,268 | 49.3% |
[ 0.0% - 0.5% ] 0.46% | 7,481,312 | 51.5% |
[ 0.5% - 1.0% ] 0.65% | 3,643,748 | 51.5% |
[ 0.5% - 1.0% ] 0.84% | 1,702,831 | 48.9% |
[ 1.0% - 1.5% ] 1.05% | 1,526,657 | 47.0% |
[ 1.0% - 1.5% ] 1.22% | 644,092 | 46.5% |
[ 1.0% - 1.5% ] 1.44% | 400,990 | 51.1% |
[ 1.5% - 2.0% ] 1.63% | 224,903 | 41.7% |
[ 1.5% - 2.0% ] 1.79% | 141,090 | 49.2% |
[ 2.0% - 2.5% ] 2.00% | 135,858 | 47.8% |
[ 2.0% - 2.5% ] 2.17% | 96,170 | 56.4% |
[ 2.0% - 2.5% ] 2.34% | 58,902 | 53.4% |
[ 2.5% - 3.0% ] 2.57% | 173,032 | 43.5% |
[ 2.5% - 3.0% ] 2.79% | 13,781 | 77.7% |
[ 2.5% - 3.0% ] 2.87% | 29,714 | 73.5% |
[ 3.0% - 3.5% ] 3.14% | 6,552 | 62.4% |
[ 3.0% - 3.5% ] 3.33% | 24,477 | 64.3% |
[ 3.0% - 3.5% ] 3.49% | 19,625 | 68.4% |
[ 3.5% - 4.0% ] 3.73% | 6,415 | 46.9% |
[ 3.5% - 4.0% ] 3.88% | 1,341 | 58.4% |
[ 4.0% - 4.5% ] 4.01% | 18,516 | 29.3% |
[ 4.0% - 4.5% ] 4.33% | 12,533 | 50.8% |
[ 4.0% - 4.5% ] 4.42% | 814 | 55.2% |
[ 4.5% - 5.0% ] 4.60% | 261 | 22.6% |
[ 4.5% - 5.0% ] 4.77% | 43,607 | 49.1% |
[ 5.0% - 5.5% ] 5.07% | 1,125 | 31.6% |
[ 5.0% - 5.5% ] 5.25% | 1,238 | 69.1% |
[ 5.0% - 5.5% ] 5.39% | 2,651 | 59.7% |
[ 5.5% - 6.0% ] 5.57% | 6,377 | 66.6% |
[ 5.5% - 6.0% ] 5.82% | 189 | 48.5% |
[ 6.0% - 6.5% ] 6.01% | 5,007 | 63.3% |
[ 6.0% - 6.5% ] 6.32% | 1,551 | 47.6% |
[ 6.5% - 7.0% ] 6.53% | 2,022 | 63.6% |
[ 6.5% - 7.0% ] 6.82% | 44 | 34.6% |
[ 7.0% - 7.5% ] 7.03% | 17,250 | 61.7% |
[ 7.0% - 7.5% ] 7.34% | 2,699 | 78.9% |
[ 7.5% - 8.0% ] 7.51% | 852 | 31.1% |
[ 7.5% - 8.0% ] 7.76% | 438 | 51.5% |
[ 8.0% - 8.5% ] 8.50% | 412 | 35.4% |
[ 8.5% - 9.0% ] 8.68% | 645 | 28.1% |
[ 8.5% - 9.0% ] 8.93% | 56 | 75.0% |
[ 9.0% - 9.5% ] 9.08% | 16,358 | 45.6% |
[ 9.0% - 9.5% ] 9.21% | 29,286 | 48.5% |
[ 10.0% - 10.5% ] 10.14% | 3,323 | 56.4% |
[ 10.0% - 10.5% ] 10.30% | 728 | 34.5% |
[ 10.5% - 11.0% ] 10.67% | 1,097 | 40.5% |
[ 10.5% - 11.0% ] 10.84% | 83 | 50.0% |
[ 11.0% - 11.5% ] 11.08% | 2,960 | 44.7% |
[ 27.5% - 28.0% ] 27.78% | 90 | 42.9% |
[ 27.5% - 28.0% ] 27.95% | 508 | 54.7% |
[ 38.0% - 38.5% ] 38.00% | 150 | 26.3% |
[ 47.0% - 47.5% ] 47.01% | 117 | 80.0% |