Ute Married-couple Households
COMPARE
Ute
Select to Compare
Married-couple Households
Ute Married-couple Households
44.4%
MARRIED-COUPLE HOUSEHOLDS
1.0/ 100
METRIC RATING
240th/ 347
METRIC RANK
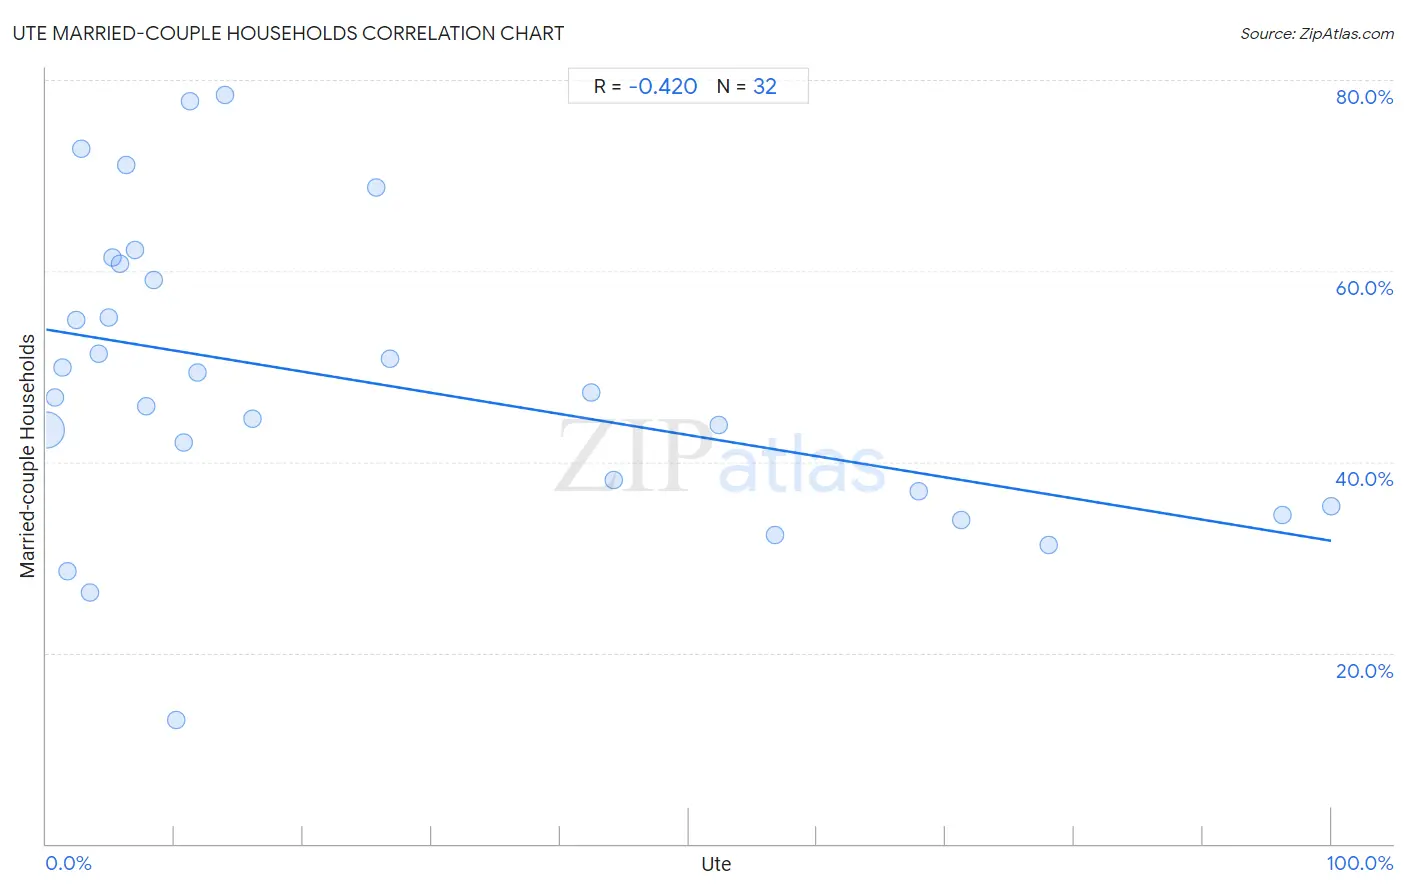
Ute Married-couple Households Correlation Chart
The statistical analysis conducted on geographies consisting of 55,658,636 people shows a moderate negative correlation between the proportion of Ute and percentage of married-couple family households in the United States with a correlation coefficient (R) of -0.420 and weighted average of 44.4%. On average, for every 1% (one percent) increase in Ute within a typical geography, there is a decrease of 0.22% in percentage of married-couple family households.
It is essential to understand that the correlation between the percentage of Ute and percentage of married-couple family households does not imply a direct cause-and-effect relationship. It remains uncertain whether the presence of Ute influences an upward or downward trend in the level of percentage of married-couple family households within an area, or if Ute simply ended up residing in those areas with higher or lower levels of percentage of married-couple family households due to other factors.
Demographics Similar to Ute by Married-couple Households
In terms of married-couple households, the demographic groups most similar to Ute are Immigrants from Bosnia and Herzegovina (44.4%, a difference of 0.0%), Immigrants from Albania (44.4%, a difference of 0.040%), Spanish American (44.5%, a difference of 0.080%), Immigrants from Uruguay (44.5%, a difference of 0.10%), and Immigrants from Saudi Arabia (44.4%, a difference of 0.11%).
| Demographics | Rating | Rank | Married-couple Households |
| Immigrants from Uganda | 1.5 /100 | #233 | Tragic 44.6% |
| Immigrants from Panama | 1.3 /100 | #234 | Tragic 44.6% |
| Immigrants from Nicaragua | 1.2 /100 | #235 | Tragic 44.5% |
| Yaqui | 1.2 /100 | #236 | Tragic 44.5% |
| Comanche | 1.2 /100 | #237 | Tragic 44.5% |
| Immigrants from Uruguay | 1.1 /100 | #238 | Tragic 44.5% |
| Spanish Americans | 1.1 /100 | #239 | Tragic 44.5% |
| Ute | 1.0 /100 | #240 | Tragic 44.4% |
| Immigrants from Bosnia and Herzegovina | 1.0 /100 | #241 | Tragic 44.4% |
| Immigrants from Albania | 1.0 /100 | #242 | Tragic 44.4% |
| Immigrants from Saudi Arabia | 0.9 /100 | #243 | Tragic 44.4% |
| Immigrants from Armenia | 0.7 /100 | #244 | Tragic 44.3% |
| Immigrants from El Salvador | 0.7 /100 | #245 | Tragic 44.3% |
| Immigrants from Cuba | 0.6 /100 | #246 | Tragic 44.2% |
| Immigrants from Morocco | 0.6 /100 | #247 | Tragic 44.2% |
Ute Married-couple Households Correlation Summary
| Measurement | Ute Data | Married-couple Households Data |
| Minimum | 0.028% | 12.9% |
| Maximum | 100.0% | 78.5% |
| Range | 100.0% | 65.6% |
| Mean | 24.9% | 48.4% |
| Median | 10.4% | 47.0% |
| Interquartile 25% (IQ1) | 4.5% | 36.1% |
| Interquartile 75% (IQ3) | 43.3% | 59.9% |
| Interquartile Range (IQR) | 38.8% | 23.8% |
| Standard Deviation (Sample) | 29.8% | 15.7% |
| Standard Deviation (Population) | 29.4% | 15.5% |
Correlation Details
| Ute Percentile | Sample Size | Married-couple Households |
[ 0.0% - 0.5% ] 0.028% | 55,238,532 | 43.3% |
[ 0.5% - 1.0% ] 0.68% | 249,344 | 46.7% |
[ 1.0% - 1.5% ] 1.22% | 56,635 | 49.9% |
[ 1.5% - 2.0% ] 1.67% | 10,159 | 28.6% |
[ 2.0% - 2.5% ] 2.33% | 50,998 | 54.8% |
[ 2.5% - 3.0% ] 2.75% | 8,458 | 72.9% |
[ 3.0% - 3.5% ] 3.36% | 387 | 26.3% |
[ 4.0% - 4.5% ] 4.09% | 2,004 | 51.3% |
[ 4.5% - 5.0% ] 4.86% | 8,830 | 55.2% |
[ 5.0% - 5.5% ] 5.13% | 1,151 | 61.4% |
[ 5.5% - 6.0% ] 5.71% | 14,894 | 60.7% |
[ 6.0% - 6.5% ] 6.22% | 498 | 71.1% |
[ 6.5% - 7.0% ] 6.87% | 771 | 62.2% |
[ 7.5% - 8.0% ] 7.81% | 1,754 | 45.8% |
[ 8.0% - 8.5% ] 8.33% | 1,285 | 59.1% |
[ 10.0% - 10.5% ] 10.13% | 158 | 12.9% |
[ 10.5% - 11.0% ] 10.75% | 577 | 42.1% |
[ 11.0% - 11.5% ] 11.16% | 484 | 77.8% |
[ 11.5% - 12.0% ] 11.76% | 5,495 | 49.3% |
[ 13.5% - 14.0% ] 13.93% | 244 | 78.5% |
[ 16.0% - 16.5% ] 16.07% | 616 | 44.5% |
[ 25.5% - 26.0% ] 25.71% | 140 | 68.8% |
[ 26.5% - 27.0% ] 26.77% | 310 | 50.8% |
[ 42.0% - 42.5% ] 42.40% | 283 | 47.3% |
[ 44.0% - 44.5% ] 44.12% | 136 | 38.1% |
[ 52.0% - 52.5% ] 52.36% | 191 | 43.9% |
[ 56.5% - 57.0% ] 56.67% | 60 | 32.4% |
[ 67.5% - 68.0% ] 67.87% | 831 | 36.9% |
[ 71.0% - 71.5% ] 71.25% | 1,186 | 33.9% |
[ 78.0% - 78.5% ] 78.06% | 1,691 | 31.2% |
[ 96.0% - 96.5% ] 96.19% | 472 | 34.4% |
[ 99.5% - 100.0% ] 100.00% | 62 | 35.3% |