Somali Married-couple Households

COMPARE

Somali
Race
Ancestry
AfghanAfricanAlaska NativeAlaskan AthabascanAlbanianAleutAlsatianAmericanApacheArabArapahoArgentineanArmenianAssyrian/Chaldean/SyriacAustralianAustrianBahamianBangladeshiBarbadianBasqueBelgianBelizeanBermudanBhutaneseBlackfeetBolivianBrazilianBritishBritish West IndianBulgarianBurmeseCajunCambodianCanadianCape VerdeanCarpatho RusynCelticCentral AmericanCentral American IndianCherokeeCheyenneChickasawChileanChineseChippewaChoctawColombianColvilleComancheCosta RicanCreeCreekCroatianCrowCubanCypriotCzechCzechoslovakianDanishDelawareDominicanDutchDutch West IndianEastern EuropeanEcuadorianEgyptianEnglishEstonianEthiopianEuropeanFijianFilipinoFinnishFrenchFrench American IndianFrench CanadianGermanGerman RussianGhanaianGreekGuamanian/ChamorroGuatemalanGuyaneseHaitianHmongHonduranHopiHoumaHungarianIcelanderIndian (Asian)IndonesianInupiatIranianIraqiIrishIroquoisIsraeliItalianJamaicanJapaneseJordanianKenyanKiowaKoreanLaotianLatvianLebaneseLiberianLithuanianLumbeeLuxembourgerMacedonianMalaysianMalteseMarshalleseMenomineeMexicanMexican American IndianMongolianMoroccanNative HawaiianNavajoNepaleseNew ZealanderNicaraguanNigerianNorthern EuropeanNorwegianOkinawanOsageOttawaPaiutePakistaniPalestinianPanamanianParaguayanPennsylvania GermanPeruvianPimaPolishPortuguesePotawatomiPuebloPuerto RicanPuget Sound SalishRomanianRussianSalvadoranSamoanScandinavianScotch-IrishScottishSeminoleSenegaleseSerbianShoshoneSierra LeoneanSiouxSlavicSlovakSloveneSomaliSouth AfricanSouth AmericanSouth American IndianSoviet UnionSpaniardSpanishSpanish AmericanSpanish American IndianSri LankanSubsaharan AfricanSudaneseSwedishSwissSyrianTaiwaneseThaiTlingit-HaidaTohono O'OdhamTonganTrinidadian and TobagonianTsimshianTurkishU.S. Virgin IslanderUgandanUkrainianUruguayanUteVenezuelanVietnameseWelshWest IndianYakamaYaquiYugoslavianYumanYup'ikZimbabwean
Immigration
NonimmigrantsImmigrantsAfghanistanAfricaAlbaniaArgentinaArmeniaAsiaAustraliaAustriaBahamasBangladeshBarbadosBelarusBelgiumBelizeBoliviaBosnia and HerzegovinaBrazilBulgariaBurma/MyanmarCabo VerdeCambodiaCameroonCanadaCaribbeanCentral AmericaChileChinaColombiaCongoCosta RicaCroatiaCubaCzechoslovakiaDenmarkDominicaDominican RepublicEastern AfricaEastern AsiaEastern EuropeEcuadorEgyptEl SalvadorEnglandEritreaEthiopiaEuropeFijiFranceGermanyGhanaGreeceGrenadaGuatemalaGuyanaHaitiHondurasHong KongHungaryIndiaIndonesiaIranIraqIrelandIsraelItalyJamaicaJapanJordanKazakhstanKenyaKoreaKuwaitLaosLatin AmericaLatviaLebanonLiberiaLithuaniaMalaysiaMexicoMicronesiaMiddle AfricaMoldovaMoroccoNepalNetherlandsNicaraguaNigeriaNorth AmericaNorth MacedoniaNorthern AfricaNorthern EuropeNorwayOceaniaPakistanPanamaPeruPhilippinesPolandPortugalRomaniaRussiaSaudi ArabiaScotlandSenegalSerbiaSierra LeoneSingaporeSomaliaSouth AfricaSouth AmericaSouth Central AsiaSouth Eastern AsiaSouthern EuropeSpainSri LankaSt. Vincent and the GrenadinesSudanSwedenSwitzerlandSyriaTaiwanThailandTrinidad and TobagoTurkeyUgandaUkraineUruguayUzbekistanVenezuelaVietnamWest IndiesWestern AfricaWestern AsiaWestern EuropeYemenZaireZimbabweAzores
Select to Compare
Race
Ancestry
AfghanAfricanAlaska NativeAlaskan AthabascanAlbanianAleutAlsatianAmericanApacheArabArapahoArgentineanArmenianAssyrian/Chaldean/SyriacAustralianAustrianBahamianBangladeshiBarbadianBasqueBelgianBelizeanBermudanBhutaneseBlackfeetBolivianBrazilianBritishBritish West IndianBulgarianBurmeseCajunCambodianCanadianCape VerdeanCarpatho RusynCelticCentral AmericanCentral American IndianCherokeeCheyenneChickasawChileanChineseChippewaChoctawColombianColvilleComancheCosta RicanCreeCreekCroatianCrowCubanCypriotCzechCzechoslovakianDanishDelawareDominicanDutchDutch West IndianEastern EuropeanEcuadorianEgyptianEnglishEstonianEthiopianEuropeanFijianFilipinoFinnishFrenchFrench American IndianFrench CanadianGermanGerman RussianGhanaianGreekGuamanian/ChamorroGuatemalanGuyaneseHaitianHmongHonduranHopiHoumaHungarianIcelanderIndian (Asian)IndonesianInupiatIranianIraqiIrishIroquoisIsraeliItalianJamaicanJapaneseJordanianKenyanKiowaKoreanLaotianLatvianLebaneseLiberianLithuanianLumbeeLuxembourgerMacedonianMalaysianMalteseMarshalleseMenomineeMexicanMexican American IndianMongolianMoroccanNative HawaiianNavajoNepaleseNew ZealanderNicaraguanNigerianNorthern EuropeanNorwegianOkinawanOsageOttawaPaiutePakistaniPalestinianPanamanianParaguayanPennsylvania GermanPeruvianPimaPolishPortuguesePotawatomiPuebloPuerto RicanPuget Sound SalishRomanianRussianSalvadoranSamoanScandinavianScotch-IrishScottishSeminoleSenegaleseSerbianShoshoneSierra LeoneanSiouxSlavicSlovakSloveneSouth AfricanSouth AmericanSouth American IndianSoviet UnionSpaniardSpanishSpanish AmericanSpanish American IndianSri LankanSubsaharan AfricanSudaneseSwedishSwissSyrianTaiwaneseThaiTlingit-HaidaTohono O'OdhamTonganTrinidadian and TobagonianTsimshianTurkishU.S. Virgin IslanderUgandanUkrainianUruguayanUteVenezuelanVietnameseWelshWest IndianYakamaYaquiYugoslavianYumanYup'ikZimbabwean
Immigration
NonimmigrantsImmigrantsAfghanistanAfricaAlbaniaArgentinaArmeniaAsiaAustraliaAustriaBahamasBangladeshBarbadosBelarusBelgiumBelizeBoliviaBosnia and HerzegovinaBrazilBulgariaBurma/MyanmarCabo VerdeCambodiaCameroonCanadaCaribbeanCentral AmericaChileChinaColombiaCongoCosta RicaCroatiaCubaCzechoslovakiaDenmarkDominicaDominican RepublicEastern AfricaEastern AsiaEastern EuropeEcuadorEgyptEl SalvadorEnglandEritreaEthiopiaEuropeFijiFranceGermanyGhanaGreeceGrenadaGuatemalaGuyanaHaitiHondurasHong KongHungaryIndiaIndonesiaIranIraqIrelandIsraelItalyJamaicaJapanJordanKazakhstanKenyaKoreaKuwaitLaosLatin AmericaLatviaLebanonLiberiaLithuaniaMalaysiaMexicoMicronesiaMiddle AfricaMoldovaMoroccoNepalNetherlandsNicaraguaNigeriaNorth AmericaNorth MacedoniaNorthern AfricaNorthern EuropeNorwayOceaniaPakistanPanamaPeruPhilippinesPolandPortugalRomaniaRussiaSaudi ArabiaScotlandSenegalSerbiaSierra LeoneSingaporeSomaliaSouth AfricaSouth AmericaSouth Central AsiaSouth Eastern AsiaSouthern EuropeSpainSri LankaSt. Vincent and the GrenadinesSudanSwedenSwitzerlandSyriaTaiwanThailandTrinidad and TobagoTurkeyUgandaUkraineUruguayUzbekistanVenezuelaVietnamWest IndiesWestern AfricaWestern AsiaWestern EuropeYemenZaireZimbabweAzores
Married-couple Households
Income
Poverty
Unemployment
Labor Participation
Family Structure
Vehicle Availability
Education Level
Disability

Somali Married-couple Households
Tragic

39.0%
MARRIED-COUPLE HOUSEHOLDS
0.0/ 100
METRIC RATING
332nd/ 347
METRIC RANK

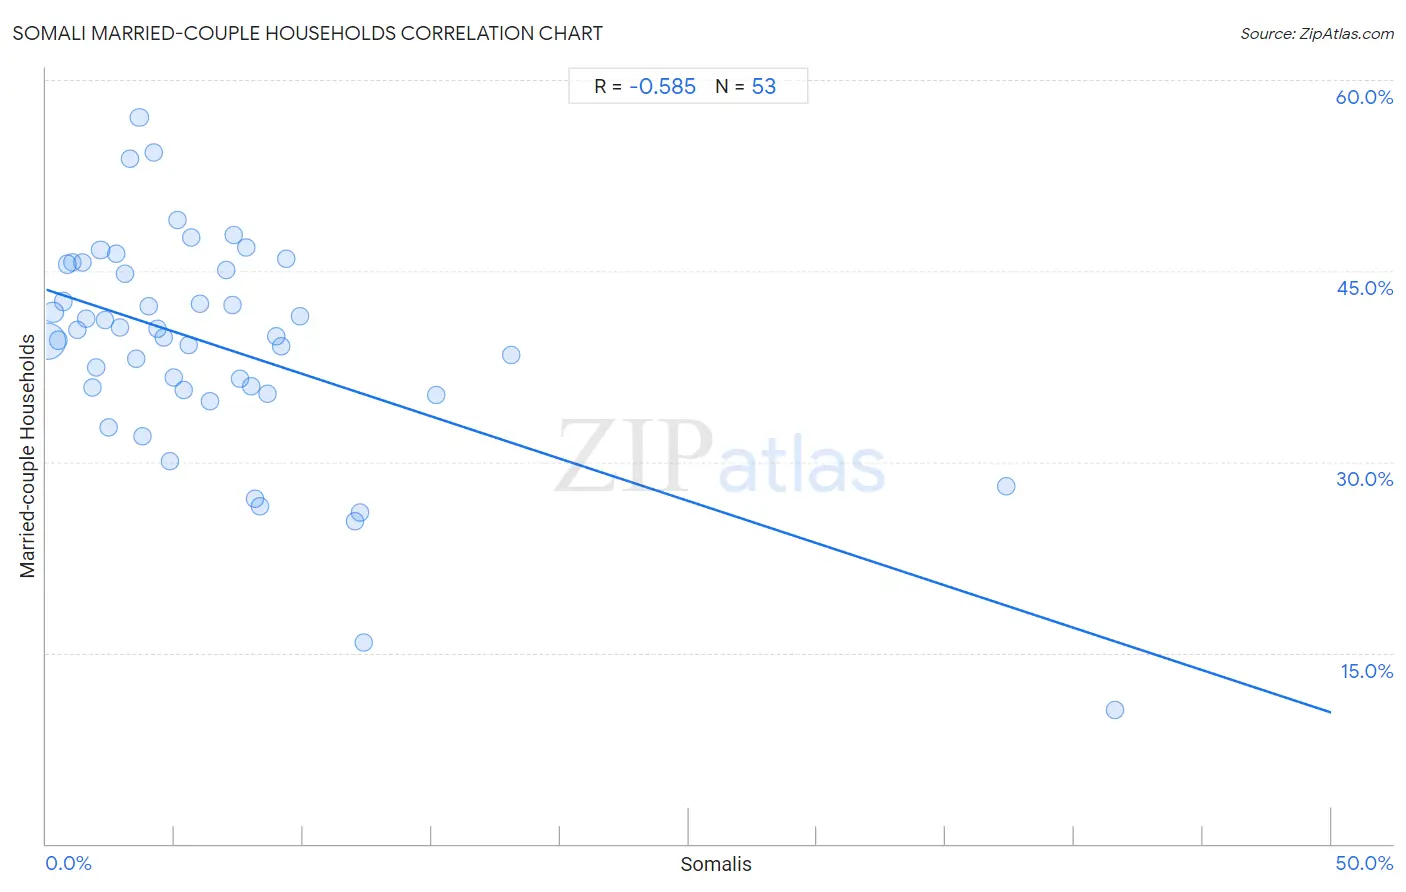
Somali Married-couple Households Correlation Chart

The statistical analysis conducted on geographies consisting of 99,290,778 people shows a substantial negative correlation between the proportion of Somalis and percentage of married-couple family households in the United States with a correlation coefficient (R) of -0.585 and weighted average of 39.0%. On average, for every 1% (one percent) increase in Somalis within a typical geography, there is a decrease of 0.66% in percentage of married-couple family households.
Somali Married-couple Households
It is essential to understand that the correlation between the percentage of Somalis and percentage of married-couple family households does not imply a direct cause-and-effect relationship. It remains uncertain whether the presence of Somalis influences an upward or downward trend in the level of percentage of married-couple family households within an area, or if Somalis simply ended up residing in those areas with higher or lower levels of percentage of married-couple family households due to other factors.

Demographics Similar to Somalis by Married-couple Households

In terms of married-couple households, the demographic groups most similar to Somalis are Immigrants from West Indies (39.0%, a difference of 0.030%), Immigrants from Congo (39.0%, a difference of 0.090%), Immigrants from Barbados (39.2%, a difference of 0.52%), Immigrants from St. Vincent and the Grenadines (38.7%, a difference of 0.81%), and Immigrants from Dominica (39.4%, a difference of 0.96%).
DemographicsRating | RankMarried-couple Households
Pueblo
0.0
/100
|
#325
Tragic
40.0%
U.S. Virgin Islanders
0.0
/100
|
#326
Tragic
39.8%
Lumbee
0.0
/100
|
#327
Tragic
39.6%
Barbadians
0.0
/100
|
#328
Tragic
39.4%
Immigrants from Dominica
0.0
/100
|
#329
Tragic
39.4%
Immigrants from Barbados
0.0
/100
|
#330
Tragic
39.2%
Immigrants from Congo
0.0
/100
|
#331
Tragic
39.0%
Somalis
0.0
/100
|
#332
Tragic
39.0%
Immigrants from West Indies
0.0
/100
|
#333
Tragic
39.0%
Immigrants from St. Vincent and the Grenadines
0.0
/100
|
#334
Tragic
38.7%
Senegalese
0.0
/100
|
#335
Tragic
38.6%
Blacks/African Americans
0.0
/100
|
#336
Tragic
38.5%
Immigrants from Somalia
0.0
/100
|
#337
Tragic
38.4%
Immigrants from Senegal
0.0
/100
|
#338
Tragic
38.4%
British West Indians
0.0
/100
|
#339
Tragic
38.3%

Somali Married-couple Households Correlation Summary

MeasurementSomali DataMarried-couple Households Data
Minimum0.041%10.5%
Maximum41.6%57.0%
Range41.5%46.6%
Mean6.7%39.1%
Median4.9%39.8%
Interquartile 25% (IQ1)2.4%35.5%
Interquartile 75% (IQ3)8.2%45.3%
Interquartile Range (IQR)5.8%9.8%
Standard Deviation (Sample)7.6%8.7%
Standard Deviation (Population)7.6%8.6%

Correlation Details

Somali PercentileSample SizeMarried-couple Households
[
0.0%
-
0.5%
]
0.041%
72,714,34739.5%
[
0.0%
-
0.5%
]
0.26%
10,918,54141.8%
[
0.0%
-
0.5%
]
0.47%
3,161,30939.6%
[
0.5%
-
1.0%
]
0.66%
3,143,09642.6%
[
0.5%
-
1.0%
]
0.82%
1,264,22245.5%
[
1.0%
-
1.5%
]
1.04%
1,007,76845.7%
[
1.0%
-
1.5%
]
1.20%
1,110,25040.3%
[
1.0%
-
1.5%
]
1.40%
449,70045.7%
[
1.5%
-
2.0%
]
1.57%
659,25541.2%
[
1.5%
-
2.0%
]
1.78%
187,01335.8%
[
1.5%
-
2.0%
]
1.95%
580,42137.5%
[
2.0%
-
2.5%
]
2.11%
250,86946.7%
[
2.0%
-
2.5%
]
2.28%
145,27341.1%
[
2.0%
-
2.5%
]
2.44%
970,27532.7%
[
2.5%
-
3.0%
]
2.72%
220,12946.4%
[
2.5%
-
3.0%
]
2.86%
236,66140.5%
[
3.0%
-
3.5%
]
3.06%
186,81244.8%
[
3.0%
-
3.5%
]
3.24%
143,51253.8%
[
3.5%
-
4.0%
]
3.51%
172,84038.1%
[
3.5%
-
4.0%
]
3.62%
104,91657.0%
[
3.5%
-
4.0%
]
3.74%
17,64132.0%
[
3.5%
-
4.0%
]
3.99%
205,65842.3%
[
4.0%
-
4.5%
]
4.17%
3,54854.3%
[
4.0%
-
4.5%
]
4.33%
54,02840.4%
[
4.5%
-
5.0%
]
4.58%
21,56939.7%
[
4.5%
-
5.0%
]
4.80%
510,55630.1%
[
4.5%
-
5.0%
]
4.95%
122,96536.6%
[
5.0%
-
5.5%
]
5.11%
17,53249.0%
[
5.0%
-
5.5%
]
5.36%
30,64135.7%
[
5.5%
-
6.0%
]
5.57%
88,76839.2%
[
5.5%
-
6.0%
]
5.65%
17747.6%
[
5.5%
-
6.0%
]
5.97%
23,43342.4%
[
6.0%
-
6.5%
]
6.37%
68,91034.8%
[
7.0%
-
7.5%
]
7.01%
67,99945.1%
[
7.0%
-
7.5%
]
7.23%
42,58142.3%
[
7.0%
-
7.5%
]
7.31%
26,76047.8%
[
7.5%
-
8.0%
]
7.53%
32,68136.6%
[
7.5%
-
8.0%
]
7.77%
30,97346.8%
[
7.5%
-
8.0%
]
7.98%
61,42335.9%
[
8.0%
-
8.5%
]
8.11%
13,95627.1%
[
8.0%
-
8.5%
]
8.30%
24,06726.6%
[
8.5%
-
9.0%
]
8.63%
22,82735.3%
[
8.5%
-
9.0%
]
8.95%
14,75939.8%
[
9.0%
-
9.5%
]
9.13%
23,11039.1%
[
9.0%
-
9.5%
]
9.36%
5,98446.0%
[
9.5%
-
10.0%
]
9.85%
24,41841.4%
[
12.0%
-
12.5%
]
12.03%
32,13625.3%
[
12.0%
-
12.5%
]
12.22%
30,62526.0%
[
12.0%
-
12.5%
]
12.34%
28,17215.8%
[
15.0%
-
15.5%
]
15.16%
3,69335.2%
[
18.0%
-
18.5%
]
18.08%
1,93038.4%
[
37.0%
-
37.5%
]
37.34%
1,15728.1%
[
41.5%
-
42.0%
]
41.59%
8,89210.5%