Houma College, 1 year or more
COMPARE
Houma
Select to Compare
College, 1 year or more
Houma College, 1 year or more
41.2%
COLLEGE, 1 YEAR OR MORE
0.0/ 100
METRIC RATING
346th/ 347
METRIC RANK
Houma College, 1 year or more Correlation Chart
The statistical analysis conducted on geographies consisting of 36,795,542 people shows a significant negative correlation between the proportion of Houma and percentage of population with at least college, 1 year or more education in the United States with a correlation coefficient (R) of -0.632 and weighted average of 41.2%. On average, for every 1% (one percent) increase in Houma within a typical geography, there is a decrease of 0.77% in percentage of population with at least college, 1 year or more education.
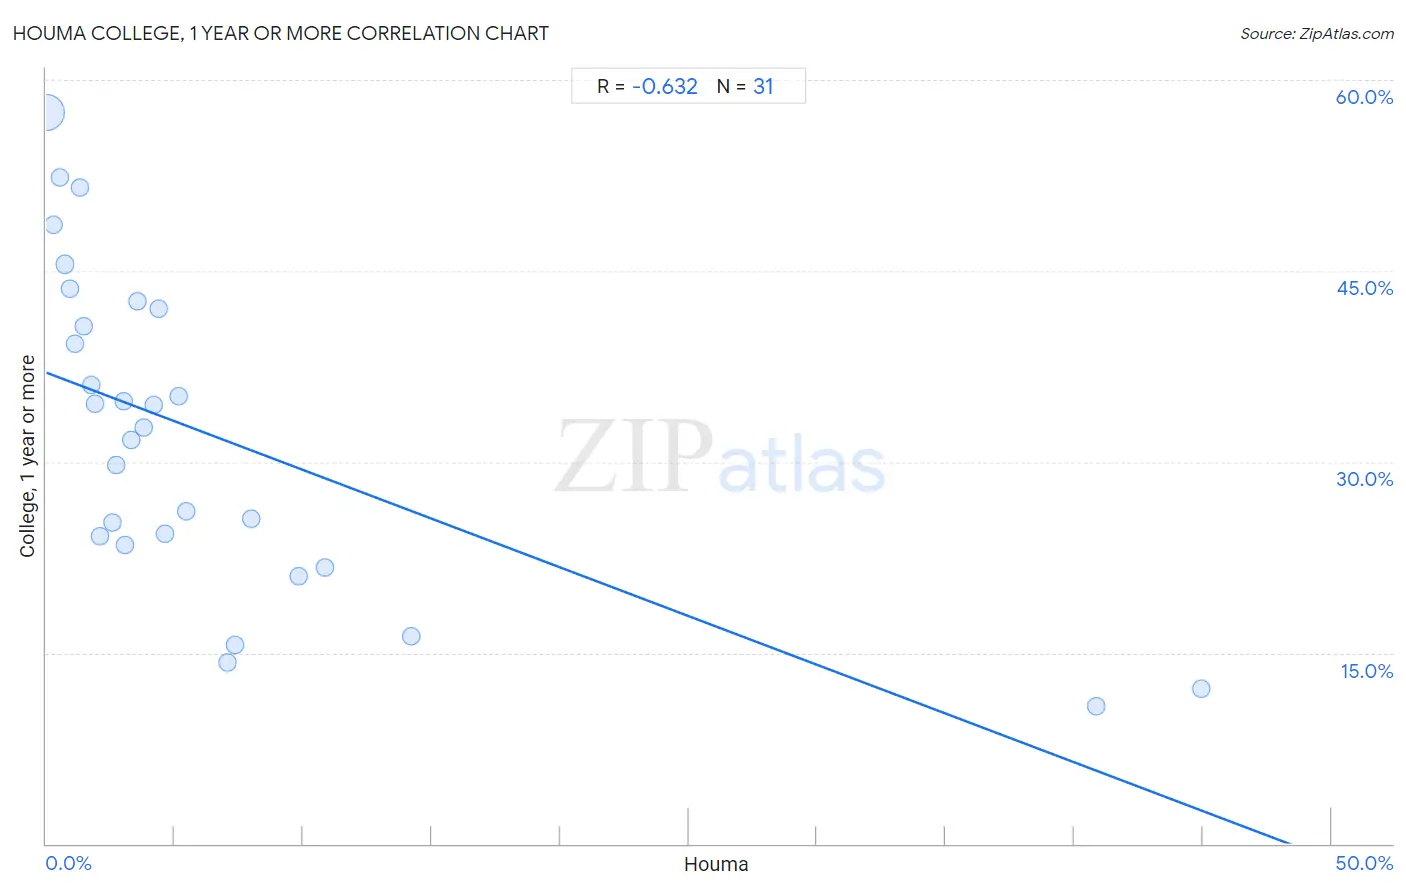
It is essential to understand that the correlation between the percentage of Houma and percentage of population with at least college, 1 year or more education does not imply a direct cause-and-effect relationship. It remains uncertain whether the presence of Houma influences an upward or downward trend in the level of percentage of population with at least college, 1 year or more education within an area, or if Houma simply ended up residing in those areas with higher or lower levels of percentage of population with at least college, 1 year or more education due to other factors.
Demographics Similar to Houma by College, 1 year or more
In terms of college, 1 year or more, the demographic groups most similar to Houma are Yup'ik (39.4%, a difference of 4.5%), Pima (45.6%, a difference of 10.7%), Yakama (46.2%, a difference of 12.2%), Tohono O'odham (47.1%, a difference of 14.4%), and Inupiat (47.2%, a difference of 14.6%).
| Demographics | Rating | Rank | College, 1 year or more |
| Immigrants from Dominican Republic | 0.0 /100 | #333 | Tragic 49.1% |
| Lumbee | 0.0 /100 | #334 | Tragic 48.9% |
| Yuman | 0.0 /100 | #335 | Tragic 48.7% |
| Spanish American Indians | 0.0 /100 | #336 | Tragic 48.5% |
| Pennsylvania Germans | 0.0 /100 | #337 | Tragic 48.5% |
| Immigrants from Central America | 0.0 /100 | #338 | Tragic 48.5% |
| Immigrants from the Azores | 0.0 /100 | #339 | Tragic 48.4% |
| Immigrants from Cabo Verde | 0.0 /100 | #340 | Tragic 48.1% |
| Immigrants from Mexico | 0.0 /100 | #341 | Tragic 47.5% |
| Inupiat | 0.0 /100 | #342 | Tragic 47.2% |
| Tohono O'odham | 0.0 /100 | #343 | Tragic 47.1% |
| Yakama | 0.0 /100 | #344 | Tragic 46.2% |
| Pima | 0.0 /100 | #345 | Tragic 45.6% |
| Houma | 0.0 /100 | #346 | Tragic 41.2% |
| Yup'ik | 0.0 /100 | #347 | Tragic 39.4% |
Houma College, 1 year or more Correlation Summary
| Measurement | Houma Data | College, 1 year or more Data |
| Minimum | 0.012% | 10.8% |
| Maximum | 44.9% | 57.5% |
| Range | 44.9% | 46.7% |
| Mean | 6.5% | 32.1% |
| Median | 3.3% | 32.7% |
| Interquartile 25% (IQ1) | 1.5% | 23.5% |
| Interquartile 75% (IQ3) | 7.0% | 42.0% |
| Interquartile Range (IQR) | 5.6% | 18.6% |
| Standard Deviation (Sample) | 10.3% | 12.4% |
| Standard Deviation (Population) | 10.1% | 12.2% |
Correlation Details
| Houma Percentile | Sample Size | College, 1 year or more |
[ 0.0% - 0.5% ] 0.012% | 35,258,017 | 57.5% |
[ 0.0% - 0.5% ] 0.28% | 572,501 | 48.6% |
[ 0.5% - 1.0% ] 0.52% | 304,570 | 52.4% |
[ 0.5% - 1.0% ] 0.71% | 264,900 | 45.5% |
[ 0.5% - 1.0% ] 0.93% | 85,949 | 43.6% |
[ 1.0% - 1.5% ] 1.10% | 43,230 | 39.3% |
[ 1.0% - 1.5% ] 1.32% | 4,545 | 51.6% |
[ 1.0% - 1.5% ] 1.47% | 25,087 | 40.6% |
[ 1.5% - 2.0% ] 1.77% | 15,031 | 36.1% |
[ 1.5% - 2.0% ] 1.89% | 11,415 | 34.6% |
[ 2.0% - 2.5% ] 2.09% | 8,600 | 24.1% |
[ 2.5% - 3.0% ] 2.58% | 9,287 | 25.3% |
[ 2.5% - 3.0% ] 2.71% | 7,961 | 29.7% |
[ 2.5% - 3.0% ] 3.00% | 26,788 | 34.7% |
[ 3.0% - 3.5% ] 3.09% | 5,118 | 23.5% |
[ 3.0% - 3.5% ] 3.31% | 5,677 | 31.8% |
[ 3.5% - 4.0% ] 3.56% | 33,094 | 42.7% |
[ 3.5% - 4.0% ] 3.79% | 15,373 | 32.7% |
[ 4.0% - 4.5% ] 4.21% | 11,624 | 34.5% |
[ 4.0% - 4.5% ] 4.40% | 2,386 | 42.0% |
[ 4.5% - 5.0% ] 4.63% | 30,192 | 24.3% |
[ 5.0% - 5.5% ] 5.16% | 35,760 | 35.1% |
[ 5.0% - 5.5% ] 5.46% | 5,845 | 26.1% |
[ 7.0% - 7.5% ] 7.04% | 3,762 | 14.2% |
[ 7.0% - 7.5% ] 7.34% | 286 | 15.6% |
[ 7.5% - 8.0% ] 7.99% | 2,880 | 25.5% |
[ 9.5% - 10.0% ] 9.84% | 2,511 | 21.0% |
[ 10.5% - 11.0% ] 10.82% | 194 | 21.7% |
[ 14.0% - 14.5% ] 14.18% | 1,347 | 16.3% |
[ 40.5% - 41.0% ] 40.88% | 844 | 10.8% |
[ 44.5% - 45.0% ] 44.92% | 768 | 12.2% |