Ute Disability

COMPARE

Ute
Race
Ancestry
AfghanAfricanAlaska NativeAlaskan AthabascanAlbanianAleutAlsatianAmericanApacheArabArapahoArgentineanArmenianAssyrian/Chaldean/SyriacAustralianAustrianBahamianBangladeshiBarbadianBasqueBelgianBelizeanBermudanBhutaneseBlackfeetBolivianBrazilianBritishBritish West IndianBulgarianBurmeseCajunCambodianCanadianCape VerdeanCarpatho RusynCelticCentral AmericanCentral American IndianCherokeeCheyenneChickasawChileanChineseChippewaChoctawColombianColvilleComancheCosta RicanCreeCreekCroatianCrowCubanCypriotCzechCzechoslovakianDanishDelawareDominicanDutchDutch West IndianEastern EuropeanEcuadorianEgyptianEnglishEstonianEthiopianEuropeanFijianFilipinoFinnishFrenchFrench American IndianFrench CanadianGermanGerman RussianGhanaianGreekGuamanian/ChamorroGuatemalanGuyaneseHaitianHmongHonduranHopiHoumaHungarianIcelanderIndian (Asian)IndonesianInupiatIranianIraqiIrishIroquoisIsraeliItalianJamaicanJapaneseJordanianKenyanKiowaKoreanLaotianLatvianLebaneseLiberianLithuanianLumbeeLuxembourgerMacedonianMalaysianMalteseMarshalleseMenomineeMexicanMexican American IndianMongolianMoroccanNative HawaiianNavajoNepaleseNew ZealanderNicaraguanNigerianNorthern EuropeanNorwegianOkinawanOsageOttawaPaiutePakistaniPalestinianPanamanianParaguayanPennsylvania GermanPeruvianPimaPolishPortuguesePotawatomiPuebloPuerto RicanPuget Sound SalishRomanianRussianSalvadoranSamoanScandinavianScotch-IrishScottishSeminoleSenegaleseSerbianShoshoneSierra LeoneanSiouxSlavicSlovakSloveneSomaliSouth AfricanSouth AmericanSouth American IndianSoviet UnionSpaniardSpanishSpanish AmericanSpanish American IndianSri LankanSubsaharan AfricanSudaneseSwedishSwissSyrianTaiwaneseThaiTlingit-HaidaTohono O'OdhamTonganTrinidadian and TobagonianTsimshianTurkishU.S. Virgin IslanderUgandanUkrainianUruguayanUteVenezuelanVietnameseWelshWest IndianYakamaYaquiYugoslavianYumanYup'ikZimbabwean
Immigration
NonimmigrantsImmigrantsAfghanistanAfricaAlbaniaArgentinaArmeniaAsiaAustraliaAustriaBahamasBangladeshBarbadosBelarusBelgiumBelizeBoliviaBosnia and HerzegovinaBrazilBulgariaBurma/MyanmarCabo VerdeCambodiaCameroonCanadaCaribbeanCentral AmericaChileChinaColombiaCongoCosta RicaCroatiaCubaCzechoslovakiaDenmarkDominicaDominican RepublicEastern AfricaEastern AsiaEastern EuropeEcuadorEgyptEl SalvadorEnglandEritreaEthiopiaEuropeFijiFranceGermanyGhanaGreeceGrenadaGuatemalaGuyanaHaitiHondurasHong KongHungaryIndiaIndonesiaIranIraqIrelandIsraelItalyJamaicaJapanJordanKazakhstanKenyaKoreaKuwaitLaosLatin AmericaLatviaLebanonLiberiaLithuaniaMalaysiaMexicoMicronesiaMiddle AfricaMoldovaMoroccoNepalNetherlandsNicaraguaNigeriaNorth AmericaNorth MacedoniaNorthern AfricaNorthern EuropeNorwayOceaniaPakistanPanamaPeruPhilippinesPolandPortugalRomaniaRussiaSaudi ArabiaScotlandSenegalSerbiaSierra LeoneSingaporeSomaliaSouth AfricaSouth AmericaSouth Central AsiaSouth Eastern AsiaSouthern EuropeSpainSri LankaSt. Vincent and the GrenadinesSudanSwedenSwitzerlandSyriaTaiwanThailandTrinidad and TobagoTurkeyUgandaUkraineUruguayUzbekistanVenezuelaVietnamWest IndiesWestern AfricaWestern AsiaWestern EuropeYemenZaireZimbabweAzores
Select to Compare
Race
Ancestry
AfghanAfricanAlaska NativeAlaskan AthabascanAlbanianAleutAlsatianAmericanApacheArabArapahoArgentineanArmenianAssyrian/Chaldean/SyriacAustralianAustrianBahamianBangladeshiBarbadianBasqueBelgianBelizeanBermudanBhutaneseBlackfeetBolivianBrazilianBritishBritish West IndianBulgarianBurmeseCajunCambodianCanadianCape VerdeanCarpatho RusynCelticCentral AmericanCentral American IndianCherokeeCheyenneChickasawChileanChineseChippewaChoctawColombianColvilleComancheCosta RicanCreeCreekCroatianCrowCubanCypriotCzechCzechoslovakianDanishDelawareDominicanDutchDutch West IndianEastern EuropeanEcuadorianEgyptianEnglishEstonianEthiopianEuropeanFijianFilipinoFinnishFrenchFrench American IndianFrench CanadianGermanGerman RussianGhanaianGreekGuamanian/ChamorroGuatemalanGuyaneseHaitianHmongHonduranHopiHoumaHungarianIcelanderIndian (Asian)IndonesianInupiatIranianIraqiIrishIroquoisIsraeliItalianJamaicanJapaneseJordanianKenyanKiowaKoreanLaotianLatvianLebaneseLiberianLithuanianLumbeeLuxembourgerMacedonianMalaysianMalteseMarshalleseMenomineeMexicanMexican American IndianMongolianMoroccanNative HawaiianNavajoNepaleseNew ZealanderNicaraguanNigerianNorthern EuropeanNorwegianOkinawanOsageOttawaPaiutePakistaniPalestinianPanamanianParaguayanPennsylvania GermanPeruvianPimaPolishPortuguesePotawatomiPuebloPuerto RicanPuget Sound SalishRomanianRussianSalvadoranSamoanScandinavianScotch-IrishScottishSeminoleSenegaleseSerbianShoshoneSierra LeoneanSiouxSlavicSlovakSloveneSomaliSouth AfricanSouth AmericanSouth American IndianSoviet UnionSpaniardSpanishSpanish AmericanSpanish American IndianSri LankanSubsaharan AfricanSudaneseSwedishSwissSyrianTaiwaneseThaiTlingit-HaidaTohono O'OdhamTonganTrinidadian and TobagonianTsimshianTurkishU.S. Virgin IslanderUgandanUkrainianUruguayanVenezuelanVietnameseWelshWest IndianYakamaYaquiYugoslavianYumanYup'ikZimbabwean
Immigration
NonimmigrantsImmigrantsAfghanistanAfricaAlbaniaArgentinaArmeniaAsiaAustraliaAustriaBahamasBangladeshBarbadosBelarusBelgiumBelizeBoliviaBosnia and HerzegovinaBrazilBulgariaBurma/MyanmarCabo VerdeCambodiaCameroonCanadaCaribbeanCentral AmericaChileChinaColombiaCongoCosta RicaCroatiaCubaCzechoslovakiaDenmarkDominicaDominican RepublicEastern AfricaEastern AsiaEastern EuropeEcuadorEgyptEl SalvadorEnglandEritreaEthiopiaEuropeFijiFranceGermanyGhanaGreeceGrenadaGuatemalaGuyanaHaitiHondurasHong KongHungaryIndiaIndonesiaIranIraqIrelandIsraelItalyJamaicaJapanJordanKazakhstanKenyaKoreaKuwaitLaosLatin AmericaLatviaLebanonLiberiaLithuaniaMalaysiaMexicoMicronesiaMiddle AfricaMoldovaMoroccoNepalNetherlandsNicaraguaNigeriaNorth AmericaNorth MacedoniaNorthern AfricaNorthern EuropeNorwayOceaniaPakistanPanamaPeruPhilippinesPolandPortugalRomaniaRussiaSaudi ArabiaScotlandSenegalSerbiaSierra LeoneSingaporeSomaliaSouth AfricaSouth AmericaSouth Central AsiaSouth Eastern AsiaSouthern EuropeSpainSri LankaSt. Vincent and the GrenadinesSudanSwedenSwitzerlandSyriaTaiwanThailandTrinidad and TobagoTurkeyUgandaUkraineUruguayUzbekistanVenezuelaVietnamWest IndiesWestern AfricaWestern AsiaWestern EuropeYemenZaireZimbabweAzores
Disability
Income
Poverty
Unemployment
Labor Participation
Family Structure
Vehicle Availability
Education Level
Disability

Ute Disability
Poor

11.9%
DISABILITY
19.5/ 100
METRIC RATING
191st/ 347
METRIC RANK

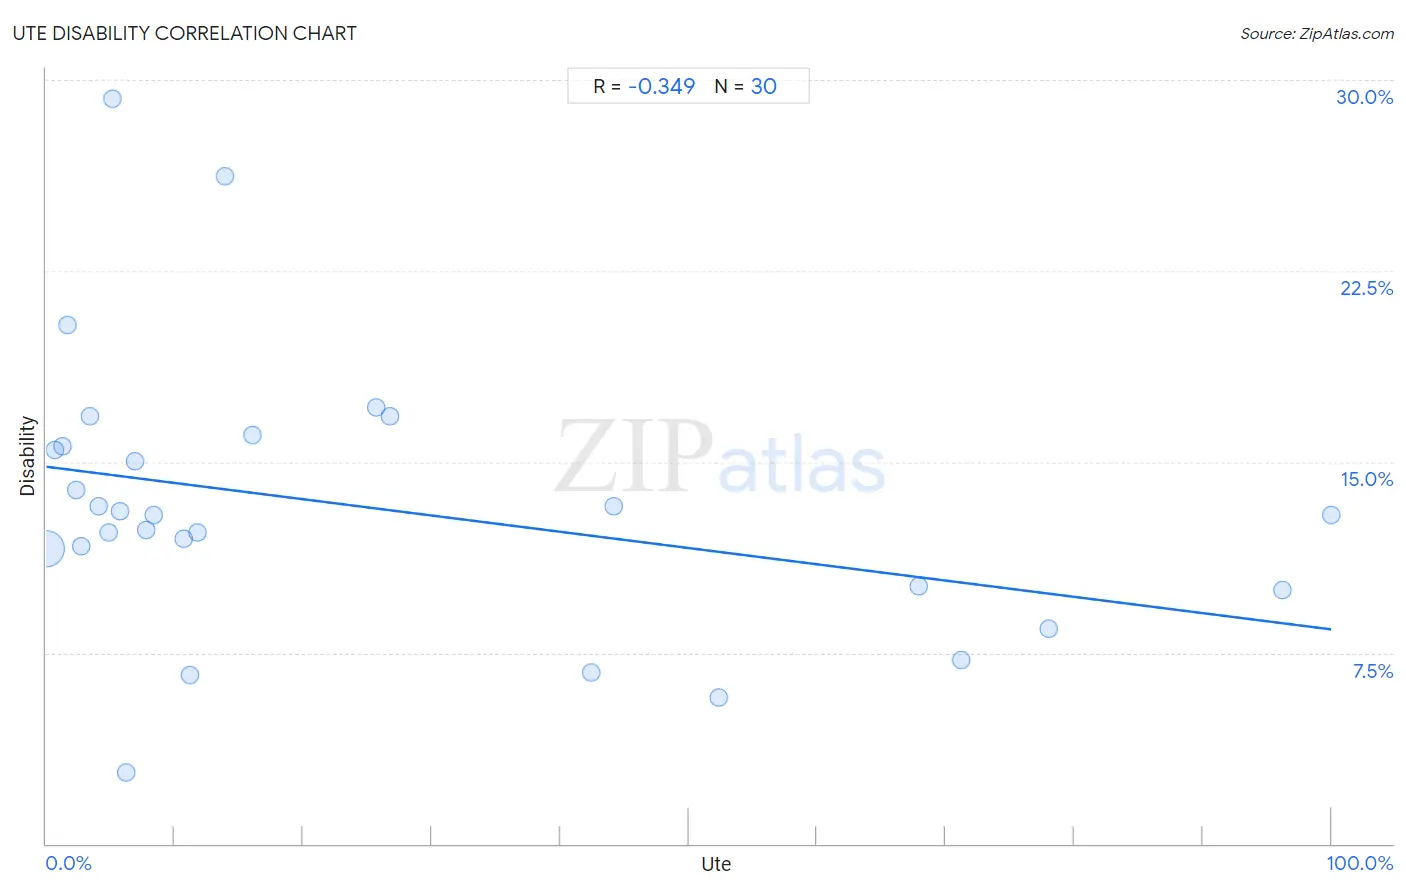
Ute Disability Correlation Chart

The statistical analysis conducted on geographies consisting of 55,668,381 people shows a mild negative correlation between the proportion of Ute and percentage of population with a disability in the United States with a correlation coefficient (R) of -0.349 and weighted average of 11.9%. On average, for every 1% (one percent) increase in Ute within a typical geography, there is a decrease of 0.064% in percentage of population with a disability.
Ute Disability
It is essential to understand that the correlation between the percentage of Ute and percentage of population with a disability does not imply a direct cause-and-effect relationship. It remains uncertain whether the presence of Ute influences an upward or downward trend in the level of percentage of population with a disability within an area, or if Ute simply ended up residing in those areas with higher or lower levels of percentage of population with a disability due to other factors.

Demographics Similar to Ute by Disability

In terms of disability, the demographic groups most similar to Ute are Lithuanian (11.9%, a difference of 0.050%), Immigrants from Bosnia and Herzegovina (11.9%, a difference of 0.10%), Immigrants from West Indies (11.9%, a difference of 0.11%), Immigrants from Zaire (11.9%, a difference of 0.16%), and Somali (11.9%, a difference of 0.16%).
DemographicsRating | RankDisability
Iraqis
30.0
/100
|
#184
Fair
11.8%
Immigrants from Burma/Myanmar
28.5
/100
|
#185
Fair
11.8%
Immigrants from Scotland
28.2
/100
|
#186
Fair
11.8%
Lebanese
27.9
/100
|
#187
Fair
11.8%
Immigrants from Mexico
23.8
/100
|
#188
Fair
11.9%
Immigrants from Zaire
21.8
/100
|
#189
Fair
11.9%
Immigrants from West Indies
21.1
/100
|
#190
Fair
11.9%
Ute
19.5
/100
|
#191
Poor
11.9%
Lithuanians
18.8
/100
|
#192
Poor
11.9%
Immigrants from Bosnia and Herzegovina
18.0
/100
|
#193
Poor
11.9%
Somalis
17.3
/100
|
#194
Poor
11.9%
Barbadians
15.8
/100
|
#195
Poor
11.9%
Serbians
15.4
/100
|
#196
Poor
11.9%
Immigrants from Belize
15.2
/100
|
#197
Poor
11.9%
Ukrainians
14.7
/100
|
#198
Poor
11.9%

Ute Disability Correlation Summary

MeasurementUte DataDisability Data
Minimum0.028%2.8%
Maximum100.0%29.3%
Range100.0%26.5%
Mean24.3%13.3%
Median9.5%12.9%
Interquartile 25% (IQ1)4.1%10.1%
Interquartile 75% (IQ3)42.4%15.6%
Interquartile Range (IQR)38.3%5.5%
Standard Deviation (Sample)30.1%5.5%
Standard Deviation (Population)29.6%5.4%

Correlation Details

Ute PercentileSample SizeDisability
[
0.0%
-
0.5%
]
0.028%
55,248,49511.6%
[
0.5%
-
1.0%
]
0.68%
249,34415.5%
[
1.0%
-
1.5%
]
1.22%
56,63515.6%
[
1.5%
-
2.0%
]
1.67%
10,15920.4%
[
2.0%
-
2.5%
]
2.33%
50,99813.9%
[
2.5%
-
3.0%
]
2.75%
8,45811.7%
[
3.0%
-
3.5%
]
3.36%
38716.8%
[
4.0%
-
4.5%
]
4.09%
2,00413.3%
[
4.5%
-
5.0%
]
4.86%
8,83012.2%
[
5.0%
-
5.5%
]
5.13%
1,15129.3%
[
5.5%
-
6.0%
]
5.71%
14,89413.0%
[
6.0%
-
6.5%
]
6.22%
4982.8%
[
6.5%
-
7.0%
]
6.87%
77115.0%
[
7.5%
-
8.0%
]
7.81%
1,75412.3%
[
8.0%
-
8.5%
]
8.33%
1,28512.9%
[
10.5%
-
11.0%
]
10.75%
57712.0%
[
11.0%
-
11.5%
]
11.16%
4846.6%
[
11.5%
-
12.0%
]
11.76%
5,49512.2%
[
13.5%
-
14.0%
]
13.93%
24426.2%
[
16.0%
-
16.5%
]
16.07%
61616.1%
[
25.5%
-
26.0%
]
25.71%
14017.1%
[
26.5%
-
27.0%
]
26.77%
31016.8%
[
42.0%
-
42.5%
]
42.40%
2836.7%
[
44.0%
-
44.5%
]
44.12%
13613.2%
[
52.0%
-
52.5%
]
52.36%
1915.8%
[
67.5%
-
68.0%
]
67.87%
83110.1%
[
71.0%
-
71.5%
]
71.25%
1,1867.2%
[
78.0%
-
78.5%
]
78.06%
1,6918.5%
[
96.0%
-
96.5%
]
96.19%
47210.0%
[
99.5%
-
100.0%
]
100.00%
6212.9%