Cities with the Most Immigrants from Eastern Asia in Wisconsin
RELATED REPORTS & OPTIONS
Eastern Asia
Wisconsin
Compare Cities
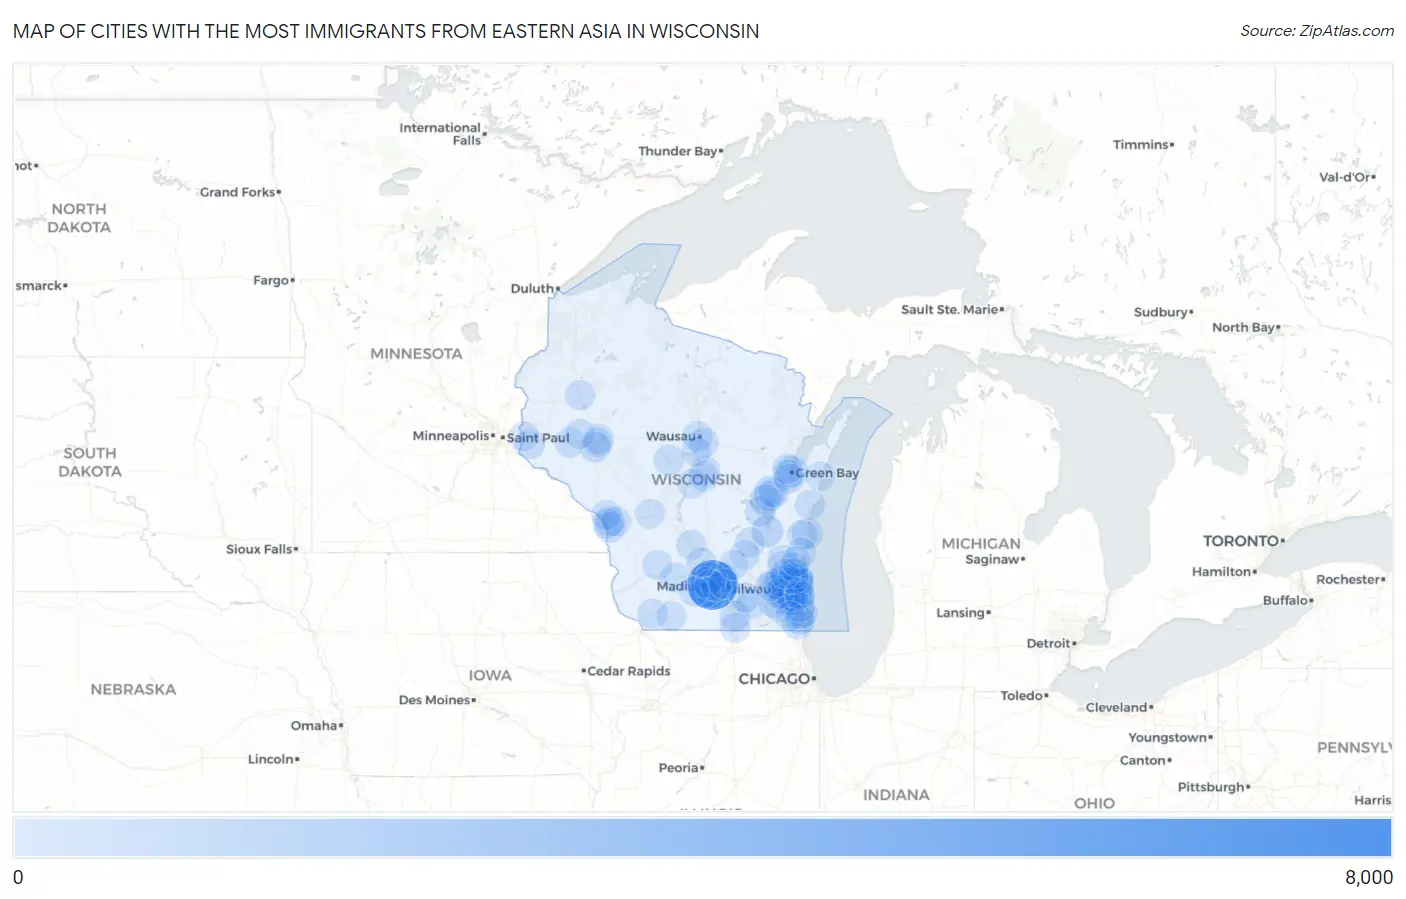
Map of Cities with the Most Immigrants from Eastern Asia in Wisconsin
0
8,000
Cities with the Most Immigrants from Eastern Asia in Wisconsin
| City | Eastern Asia | vs State | vs National | |
| 1. | Madison | 6,320 | 25,348(24.93%)#1 | 4,223,726(0.15%)#85 |
| 2. | Milwaukee | 1,811 | 25,348(7.14%)#2 | 4,223,726(0.04%)#324 |
| 3. | Brookfield | 1,181 | 25,348(4.66%)#3 | 4,223,726(0.03%)#478 |
| 4. | Fond Du Lac | 617 | 25,348(2.43%)#4 | 4,223,726(0.01%)#812 |
| 5. | Wauwatosa | 612 | 25,348(2.41%)#5 | 4,223,726(0.01%)#816 |
| 6. | Glendale | 461 | 25,348(1.82%)#6 | 4,223,726(0.01%)#1,000 |
| 7. | Green Bay | 397 | 25,348(1.57%)#7 | 4,223,726(0.01%)#1,122 |
| 8. | Shorewood | 361 | 25,348(1.42%)#8 | 4,223,726(0.01%)#1,216 |
| 9. | Appleton | 350 | 25,348(1.38%)#9 | 4,223,726(0.01%)#1,250 |
| 10. | Greenfield | 347 | 25,348(1.37%)#10 | 4,223,726(0.01%)#1,258 |
| 11. | Kenosha | 340 | 25,348(1.34%)#11 | 4,223,726(0.01%)#1,278 |
| 12. | Sheboygan | 337 | 25,348(1.33%)#12 | 4,223,726(0.01%)#1,287 |
| 13. | New Berlin | 321 | 25,348(1.27%)#13 | 4,223,726(0.01%)#1,336 |
| 14. | Sun Prairie | 292 | 25,348(1.15%)#14 | 4,223,726(0.01%)#1,420 |
| 15. | Oak Creek | 278 | 25,348(1.10%)#15 | 4,223,726(0.01%)#1,467 |
| 16. | Fitchburg | 264 | 25,348(1.04%)#16 | 4,223,726(0.01%)#1,520 |
| 17. | Mequon | 263 | 25,348(1.04%)#17 | 4,223,726(0.01%)#1,528 |
| 18. | Eau Claire | 247 | 25,348(0.97%)#18 | 4,223,726(0.01%)#1,584 |
| 19. | Middleton | 244 | 25,348(0.96%)#19 | 4,223,726(0.01%)#1,604 |
| 20. | Racine | 235 | 25,348(0.93%)#20 | 4,223,726(0.01%)#1,637 |
| 21. | West Allis | 233 | 25,348(0.92%)#21 | 4,223,726(0.01%)#1,651 |
| 22. | Janesville | 231 | 25,348(0.91%)#22 | 4,223,726(0.01%)#1,660 |
| 23. | Whitefish Bay | 219 | 25,348(0.86%)#23 | 4,223,726(0.01%)#1,723 |
| 24. | Menomonee Falls | 205 | 25,348(0.81%)#24 | 4,223,726(0.00%)#1,795 |
| 25. | Neenah | 176 | 25,348(0.69%)#25 | 4,223,726(0.00%)#1,980 |
| 26. | Marshfield | 168 | 25,348(0.66%)#26 | 4,223,726(0.00%)#2,041 |
| 27. | La Crosse | 164 | 25,348(0.65%)#27 | 4,223,726(0.00%)#2,071 |
| 28. | Waunakee | 162 | 25,348(0.64%)#28 | 4,223,726(0.00%)#2,094 |
| 29. | Elm Grove | 159 | 25,348(0.63%)#29 | 4,223,726(0.00%)#2,114 |
| 30. | Bayside | 159 | 25,348(0.63%)#30 | 4,223,726(0.00%)#2,116 |
| 31. | Sheboygan Falls | 156 | 25,348(0.62%)#31 | 4,223,726(0.00%)#2,148 |
| 32. | Mount Pleasant | 148 | 25,348(0.58%)#32 | 4,223,726(0.00%)#2,223 |
| 33. | Shorewood Hills | 144 | 25,348(0.57%)#33 | 4,223,726(0.00%)#2,259 |
| 34. | Stevens Point | 142 | 25,348(0.56%)#34 | 4,223,726(0.00%)#2,272 |
| 35. | Wausau | 129 | 25,348(0.51%)#35 | 4,223,726(0.00%)#2,398 |
| 36. | Jackson | 129 | 25,348(0.51%)#36 | 4,223,726(0.00%)#2,407 |
| 37. | Franklin | 125 | 25,348(0.49%)#37 | 4,223,726(0.00%)#2,444 |
| 38. | Beloit | 113 | 25,348(0.45%)#38 | 4,223,726(0.00%)#2,561 |
| 39. | Menasha | 111 | 25,348(0.44%)#39 | 4,223,726(0.00%)#2,601 |
| 40. | Oshkosh | 109 | 25,348(0.43%)#40 | 4,223,726(0.00%)#2,622 |
| 41. | Hales Corners | 105 | 25,348(0.41%)#41 | 4,223,726(0.00%)#2,681 |
| 42. | Verona | 102 | 25,348(0.40%)#42 | 4,223,726(0.00%)#2,731 |
| 43. | Platteville | 101 | 25,348(0.40%)#43 | 4,223,726(0.00%)#2,747 |
| 44. | Whitewater | 95 | 25,348(0.37%)#44 | 4,223,726(0.00%)#2,830 |
| 45. | Manitowoc | 92 | 25,348(0.36%)#45 | 4,223,726(0.00%)#2,884 |
| 46. | Menomonie | 91 | 25,348(0.36%)#46 | 4,223,726(0.00%)#2,899 |
| 47. | River Falls | 85 | 25,348(0.34%)#47 | 4,223,726(0.00%)#3,010 |
| 48. | Chippewa Falls | 85 | 25,348(0.34%)#48 | 4,223,726(0.00%)#3,012 |
| 49. | Pewaukee | 80 | 25,348(0.32%)#49 | 4,223,726(0.00%)#3,109 |
| 50. | Mukwonago | 79 | 25,348(0.31%)#50 | 4,223,726(0.00%)#3,132 |
| 51. | Kimberly | 79 | 25,348(0.31%)#51 | 4,223,726(0.00%)#3,134 |
| 52. | Waupun | 78 | 25,348(0.31%)#52 | 4,223,726(0.00%)#3,151 |
| 53. | Hartland | 74 | 25,348(0.29%)#53 | 4,223,726(0.00%)#3,230 |
| 54. | Muskego | 73 | 25,348(0.29%)#54 | 4,223,726(0.00%)#3,244 |
| 55. | Ashwaubenon | 73 | 25,348(0.29%)#55 | 4,223,726(0.00%)#3,246 |
| 56. | Rice Lake | 73 | 25,348(0.29%)#56 | 4,223,726(0.00%)#3,255 |
| 57. | Lake Delton | 72 | 25,348(0.28%)#57 | 4,223,726(0.00%)#3,293 |
| 58. | Plover | 71 | 25,348(0.28%)#58 | 4,223,726(0.00%)#3,308 |
| 59. | Greendale | 65 | 25,348(0.26%)#59 | 4,223,726(0.00%)#3,463 |
| 60. | Onalaska | 63 | 25,348(0.25%)#60 | 4,223,726(0.00%)#3,505 |
| 61. | Weston | 60 | 25,348(0.24%)#61 | 4,223,726(0.00%)#3,579 |
| 62. | Sussex | 60 | 25,348(0.24%)#62 | 4,223,726(0.00%)#3,584 |
| 63. | De Pere | 59 | 25,348(0.23%)#63 | 4,223,726(0.00%)#3,604 |
| 64. | Howard | 59 | 25,348(0.23%)#64 | 4,223,726(0.00%)#3,605 |
| 65. | Caledonia | 57 | 25,348(0.22%)#65 | 4,223,726(0.00%)#3,660 |
| 66. | Fort Atkinson | 57 | 25,348(0.22%)#66 | 4,223,726(0.00%)#3,666 |
| 67. | Richland Center | 55 | 25,348(0.22%)#67 | 4,223,726(0.00%)#3,748 |
| 68. | Tichigan | 53 | 25,348(0.21%)#68 | 4,223,726(0.00%)#3,815 |
| 69. | Beaver Dam | 49 | 25,348(0.19%)#69 | 4,223,726(0.00%)#3,948 |
| 70. | West Bend | 46 | 25,348(0.18%)#70 | 4,223,726(0.00%)#4,055 |
| 71. | Monona | 45 | 25,348(0.18%)#71 | 4,223,726(0.00%)#4,109 |
| 72. | Fox Point | 45 | 25,348(0.18%)#72 | 4,223,726(0.00%)#4,117 |
| 73. | Cedarburg | 43 | 25,348(0.17%)#73 | 4,223,726(0.00%)#4,172 |
| 74. | Cottage Grove | 42 | 25,348(0.17%)#74 | 4,223,726(0.00%)#4,210 |
| 75. | French Island | 42 | 25,348(0.17%)#75 | 4,223,726(0.00%)#4,217 |
| 76. | Thiensville | 41 | 25,348(0.16%)#76 | 4,223,726(0.00%)#4,269 |
| 77. | Waukesha | 37 | 25,348(0.15%)#77 | 4,223,726(0.00%)#4,428 |
| 78. | Holmen | 36 | 25,348(0.14%)#78 | 4,223,726(0.00%)#4,485 |
| 79. | Cudahy | 33 | 25,348(0.13%)#79 | 4,223,726(0.00%)#4,627 |
| 80. | Colfax | 32 | 25,348(0.13%)#80 | 4,223,726(0.00%)#4,732 |
| 81. | Brown Deer | 31 | 25,348(0.12%)#81 | 4,223,726(0.00%)#4,747 |
| 82. | Tomah | 31 | 25,348(0.12%)#82 | 4,223,726(0.00%)#4,756 |
| 83. | Belgium | 30 | 25,348(0.12%)#83 | 4,223,726(0.00%)#4,846 |
| 84. | Delafield | 29 | 25,348(0.11%)#84 | 4,223,726(0.00%)#4,891 |
| 85. | Lake Wazeecha | 28 | 25,348(0.11%)#85 | 4,223,726(0.00%)#4,987 |
| 86. | Somers | 27 | 25,348(0.11%)#86 | 4,223,726(0.00%)#5,028 |
| 87. | Darlington | 27 | 25,348(0.11%)#87 | 4,223,726(0.00%)#5,054 |
| 88. | Columbus | 26 | 25,348(0.10%)#88 | 4,223,726(0.00%)#5,099 |
| 89. | Spring Green | 26 | 25,348(0.10%)#89 | 4,223,726(0.00%)#5,124 |
| 90. | Germantown | 25 | 25,348(0.10%)#90 | 4,223,726(0.00%)#5,136 |
| 91. | Hudson | 25 | 25,348(0.10%)#91 | 4,223,726(0.00%)#5,141 |
| 92. | St Francis | 25 | 25,348(0.10%)#92 | 4,223,726(0.00%)#5,150 |
| 93. | Mount Horeb | 25 | 25,348(0.10%)#93 | 4,223,726(0.00%)#5,155 |
| 94. | Lake Hallie | 25 | 25,348(0.10%)#94 | 4,223,726(0.00%)#5,156 |
| 95. | Lake Wisconsin | 24 | 25,348(0.09%)#95 | 4,223,726(0.00%)#5,234 |
| 96. | Kewaunee | 24 | 25,348(0.09%)#96 | 4,223,726(0.00%)#5,246 |
| 97. | West Salem | 23 | 25,348(0.09%)#97 | 4,223,726(0.00%)#5,307 |
| 98. | Union Grove | 23 | 25,348(0.09%)#98 | 4,223,726(0.00%)#5,310 |
| 99. | Saukville | 22 | 25,348(0.09%)#99 | 4,223,726(0.00%)#5,395 |
| 100. | Mosinee | 21 | 25,348(0.08%)#100 | 4,223,726(0.00%)#5,464 |
Common Questions
What are the Top 10 Cities with the Most Immigrants from Eastern Asia in Wisconsin?
Top 10 Cities with the Most Immigrants from Eastern Asia in Wisconsin are:
#1
6,320
#2
1,811
#3
1,181
#4
617
#5
612
#6
461
#7
397
#8
361
#9
350
#10
347
What city has the Most Immigrants from Eastern Asia in Wisconsin?
Madison has the Most Immigrants from Eastern Asia in Wisconsin with 6,320.
What is the Total Immigrants from Eastern Asia in the State of Wisconsin?
Total Immigrants from Eastern Asia in Wisconsin is 25,348.
What is the Total Immigrants from Eastern Asia in the United States?
Total Immigrants from Eastern Asia in the United States is 4,223,726.