Cities with the Highest Percentage of Immigrants from Eastern Asia in Wisconsin
RELATED REPORTS & OPTIONS
Eastern Asia
Wisconsin
Compare Cities
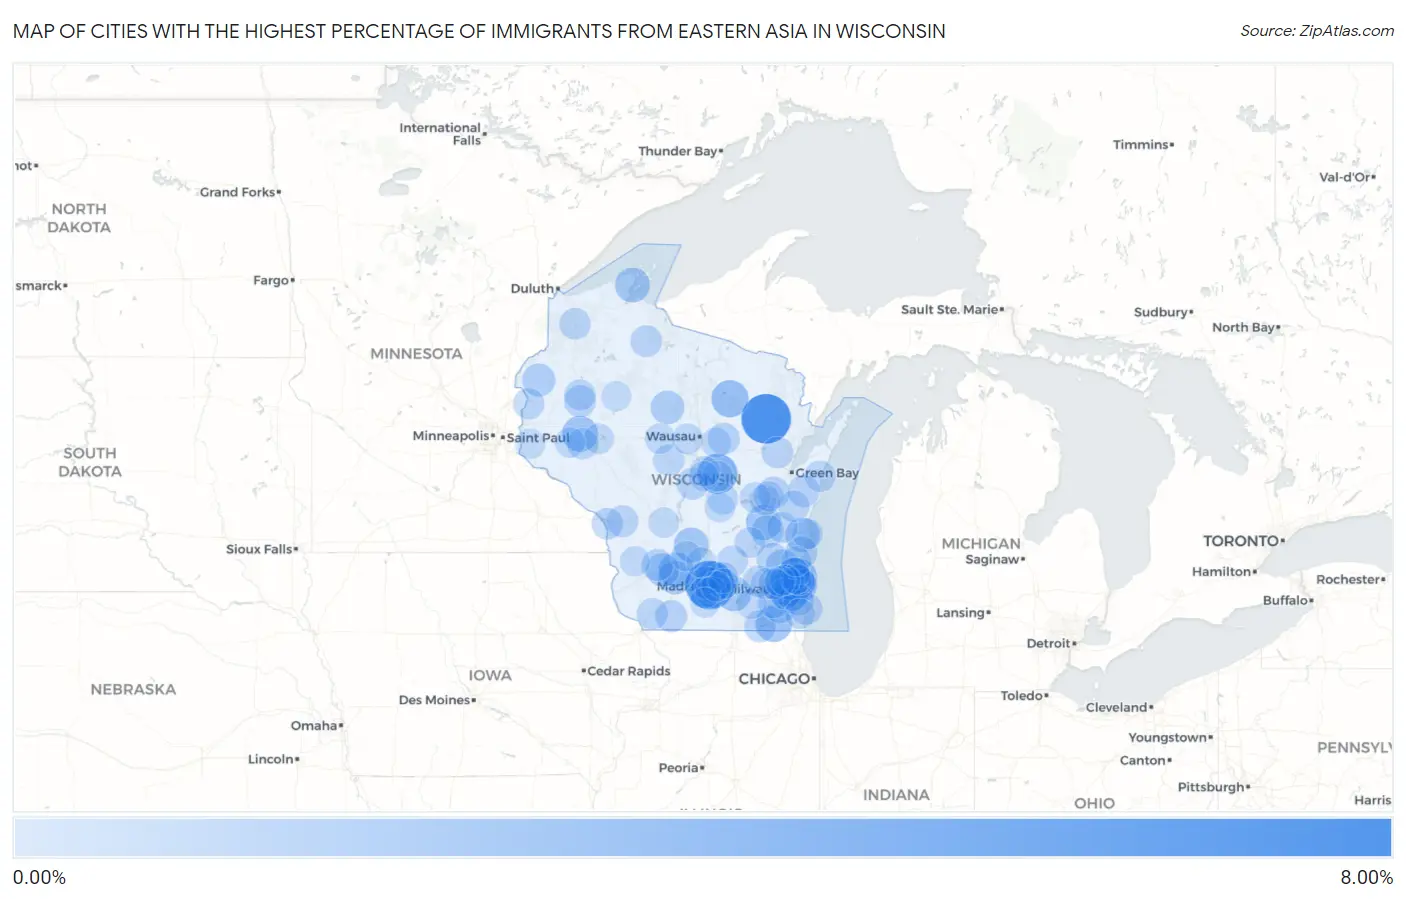
Map of Cities with the Highest Percentage of Immigrants from Eastern Asia in Wisconsin
0.00%
8.00%
Cities with the Highest Percentage of Immigrants from Eastern Asia in Wisconsin
| City | Eastern Asia | vs State | vs National | |
| 1. | Mountain | 7.25% | 0.43%(+6.82)#1 | 1.28%(+5.98)#276 |
| 2. | Shorewood Hills | 6.91% | 0.43%(+6.48)#2 | 1.28%(+5.63)#299 |
| 3. | Nelsonville | 3.89% | 0.43%(+3.46)#3 | 1.28%(+2.61)#687 |
| 4. | Bayside | 3.53% | 0.43%(+3.10)#4 | 1.28%(+2.25)#788 |
| 5. | Glendale | 3.49% | 0.43%(+3.05)#5 | 1.28%(+2.21)#801 |
| 6. | Post Lake | 2.87% | 0.43%(+2.44)#6 | 1.28%(+1.59)#1,020 |
| 7. | Brookfield | 2.86% | 0.43%(+2.43)#7 | 1.28%(+1.58)#1,026 |
| 8. | Shorewood | 2.63% | 0.43%(+2.20)#8 | 1.28%(+1.36)#1,118 |
| 9. | Lake Ivanhoe | 2.60% | 0.43%(+2.17)#9 | 1.28%(+1.33)#1,135 |
| 10. | Elm Grove | 2.47% | 0.43%(+2.04)#10 | 1.28%(+1.19)#1,200 |
| 11. | Colfax | 2.44% | 0.43%(+2.01)#11 | 1.28%(+1.16)#1,211 |
| 12. | Madison | 2.35% | 0.43%(+1.92)#12 | 1.28%(+1.08)#1,252 |
| 13. | Van Dyne | 2.22% | 0.43%(+1.79)#13 | 1.28%(+0.947)#1,333 |
| 14. | Rockdale | 2.15% | 0.43%(+1.72)#14 | 1.28%(+0.875)#1,382 |
| 15. | Bayfield | 2.11% | 0.43%(+1.68)#15 | 1.28%(+0.831)#1,415 |
| 16. | Plain | 2.08% | 0.43%(+1.65)#16 | 1.28%(+0.802)#1,442 |
| 17. | Lake Delton | 2.07% | 0.43%(+1.64)#17 | 1.28%(+0.796)#1,448 |
| 18. | Sheboygan Falls | 1.91% | 0.43%(+1.48)#18 | 1.28%(+0.635)#1,570 |
| 19. | Spring Green | 1.69% | 0.43%(+1.26)#19 | 1.28%(+0.415)#1,782 |
| 20. | Rib Lake | 1.66% | 0.43%(+1.23)#20 | 1.28%(+0.385)#1,822 |
| 21. | Jackson | 1.65% | 0.43%(+1.22)#21 | 1.28%(+0.375)#1,834 |
| 22. | Sextonville | 1.51% | 0.43%(+1.08)#22 | 1.28%(+0.236)#1,995 |
| 23. | Whitefish Bay | 1.48% | 0.43%(+1.05)#23 | 1.28%(+0.204)#2,043 |
| 24. | Frederic | 1.45% | 0.43%(+1.02)#24 | 1.28%(+0.178)#2,076 |
| 25. | Fond Du Lac | 1.39% | 0.43%(+0.955)#25 | 1.28%(+0.110)#2,194 |
| 26. | Hales Corners | 1.37% | 0.43%(+0.937)#26 | 1.28%(+0.092)#2,218 |
| 27. | Wauwatosa | 1.28% | 0.43%(+0.846)#27 | 1.28%(+0.001)#2,384 |
| 28. | Thiensville | 1.25% | 0.43%(+0.819)#28 | 1.28%(-0.025)#2,425 |
| 29. | Belgium | 1.17% | 0.43%(+0.735)#29 | 1.28%(-0.110)#2,582 |
| 30. | Wind Point | 1.13% | 0.43%(+0.695)#30 | 1.28%(-0.150)#2,651 |
| 31. | Middleton | 1.12% | 0.43%(+0.685)#31 | 1.28%(-0.160)#2,678 |
| 32. | Fontana On Geneva Lake | 1.10% | 0.43%(+0.669)#32 | 1.28%(-0.175)#2,693 |
| 33. | Darlington | 1.10% | 0.43%(+0.666)#33 | 1.28%(-0.179)#2,701 |
| 34. | Waunakee | 1.10% | 0.43%(+0.664)#34 | 1.28%(-0.181)#2,709 |
| 35. | Richland Center | 1.09% | 0.43%(+0.656)#35 | 1.28%(-0.188)#2,729 |
| 36. | Allenton | 1.08% | 0.43%(+0.647)#36 | 1.28%(-0.198)#2,759 |
| 37. | Kimberly | 1.08% | 0.43%(+0.647)#37 | 1.28%(-0.198)#2,760 |
| 38. | Cameron | 1.06% | 0.43%(+0.625)#38 | 1.28%(-0.220)#2,802 |
| 39. | Maribel | 1.06% | 0.43%(+0.624)#39 | 1.28%(-0.220)#2,804 |
| 40. | Birnamwood | 1.05% | 0.43%(+0.619)#40 | 1.28%(-0.226)#2,818 |
| 41. | Mequon | 1.05% | 0.43%(+0.617)#41 | 1.28%(-0.228)#2,827 |
| 42. | Tichigan | 1.05% | 0.43%(+0.616)#42 | 1.28%(-0.228)#2,829 |
| 43. | Lake Wazeecha | 1.04% | 0.43%(+0.613)#43 | 1.28%(-0.232)#2,835 |
| 44. | Bangor | 0.99% | 0.43%(+0.556)#44 | 1.28%(-0.289)#2,993 |
| 45. | Glidden | 0.99% | 0.43%(+0.554)#45 | 1.28%(-0.290)#3,004 |
| 46. | French Island | 0.98% | 0.43%(+0.554)#46 | 1.28%(-0.291)#3,009 |
| 47. | Pewaukee | 0.97% | 0.43%(+0.541)#47 | 1.28%(-0.303)#3,040 |
| 48. | Mukwonago | 0.95% | 0.43%(+0.520)#48 | 1.28%(-0.325)#3,115 |
| 49. | Butler | 0.94% | 0.43%(+0.513)#49 | 1.28%(-0.331)#3,131 |
| 50. | Krakow | 0.94% | 0.43%(+0.507)#50 | 1.28%(-0.338)#3,156 |
| 51. | Greenfield | 0.92% | 0.43%(+0.494)#51 | 1.28%(-0.351)#3,196 |
| 52. | Collins | 0.92% | 0.43%(+0.491)#52 | 1.28%(-0.354)#3,205 |
| 53. | Ixonia | 0.92% | 0.43%(+0.490)#53 | 1.28%(-0.355)#3,210 |
| 54. | Solon Springs | 0.91% | 0.43%(+0.481)#54 | 1.28%(-0.364)#3,230 |
| 55. | Marshfield | 0.89% | 0.43%(+0.463)#55 | 1.28%(-0.382)#3,272 |
| 56. | Fitchburg | 0.89% | 0.43%(+0.454)#56 | 1.28%(-0.391)#3,294 |
| 57. | Platteville | 0.87% | 0.43%(+0.444)#57 | 1.28%(-0.401)#3,328 |
| 58. | Oconomowoc Lake | 0.87% | 0.43%(+0.437)#58 | 1.28%(-0.407)#3,343 |
| 59. | Kewaunee | 0.85% | 0.43%(+0.420)#59 | 1.28%(-0.424)#3,404 |
| 60. | Wild Rose | 0.85% | 0.43%(+0.418)#60 | 1.28%(-0.426)#3,412 |
| 61. | Elk Mound | 0.82% | 0.43%(+0.393)#61 | 1.28%(-0.451)#3,487 |
| 62. | Fall River | 0.82% | 0.43%(+0.389)#62 | 1.28%(-0.456)#3,502 |
| 63. | Sun Prairie | 0.81% | 0.43%(+0.384)#63 | 1.28%(-0.461)#3,523 |
| 64. | Rice Lake | 0.81% | 0.43%(+0.381)#64 | 1.28%(-0.464)#3,536 |
| 65. | Dresser | 0.81% | 0.43%(+0.379)#65 | 1.28%(-0.466)#3,549 |
| 66. | New Berlin | 0.79% | 0.43%(+0.364)#66 | 1.28%(-0.481)#3,608 |
| 67. | Hartland | 0.77% | 0.43%(+0.340)#67 | 1.28%(-0.505)#3,698 |
| 68. | Oak Creek | 0.77% | 0.43%(+0.335)#68 | 1.28%(-0.510)#3,718 |
| 69. | Verona | 0.73% | 0.43%(+0.296)#69 | 1.28%(-0.549)#3,879 |
| 70. | Waupun | 0.70% | 0.43%(+0.271)#70 | 1.28%(-0.574)#3,967 |
| 71. | Sheboygan | 0.68% | 0.43%(+0.246)#71 | 1.28%(-0.599)#4,079 |
| 72. | St Cloud | 0.67% | 0.43%(+0.237)#72 | 1.28%(-0.608)#4,127 |
| 73. | Fox Point | 0.66% | 0.43%(+0.230)#73 | 1.28%(-0.615)#4,160 |
| 74. | Amherst Junction | 0.65% | 0.43%(+0.216)#74 | 1.28%(-0.628)#4,219 |
| 75. | Neenah | 0.64% | 0.43%(+0.214)#75 | 1.28%(-0.631)#4,229 |
| 76. | Marathon City | 0.64% | 0.43%(+0.213)#76 | 1.28%(-0.632)#4,231 |
| 77. | Winchester | 0.63% | 0.43%(+0.202)#77 | 1.28%(-0.643)#4,274 |
| 78. | Menasha | 0.61% | 0.43%(+0.181)#78 | 1.28%(-0.663)#4,367 |
| 79. | Whitewater | 0.60% | 0.43%(+0.173)#79 | 1.28%(-0.672)#4,408 |
| 80. | Hustler | 0.60% | 0.43%(+0.164)#80 | 1.28%(-0.680)#4,454 |
| 81. | Abbotsford | 0.59% | 0.43%(+0.164)#81 | 1.28%(-0.681)#4,459 |
| 82. | River Hills | 0.59% | 0.43%(+0.157)#82 | 1.28%(-0.687)#4,489 |
| 83. | Chippewa Falls | 0.58% | 0.43%(+0.150)#83 | 1.28%(-0.694)#4,521 |
| 84. | North Freedom | 0.58% | 0.43%(+0.146)#84 | 1.28%(-0.698)#4,540 |
| 85. | Stevens Point | 0.56% | 0.43%(+0.125)#85 | 1.28%(-0.720)#4,666 |
| 86. | Cottage Grove | 0.56% | 0.43%(+0.124)#86 | 1.28%(-0.721)#4,671 |
| 87. | Menomonie | 0.55% | 0.43%(+0.118)#87 | 1.28%(-0.726)#4,711 |
| 88. | Soldiers Grove | 0.55% | 0.43%(+0.118)#88 | 1.28%(-0.727)#4,717 |
| 89. | Hatley | 0.55% | 0.43%(+0.116)#89 | 1.28%(-0.729)#4,734 |
| 90. | Mount Pleasant | 0.54% | 0.43%(+0.105)#90 | 1.28%(-0.740)#4,807 |
| 91. | Menomonee Falls | 0.53% | 0.43%(+0.100)#91 | 1.28%(-0.745)#4,835 |
| 92. | River Falls | 0.53% | 0.43%(+0.095)#92 | 1.28%(-0.750)#4,863 |
| 93. | Plover | 0.52% | 0.43%(+0.093)#93 | 1.28%(-0.752)#4,876 |
| 94. | Monona | 0.52% | 0.43%(+0.093)#94 | 1.28%(-0.752)#4,879 |
| 95. | Sussex | 0.52% | 0.43%(+0.089)#95 | 1.28%(-0.756)#4,901 |
| 96. | Belleville | 0.52% | 0.43%(+0.085)#96 | 1.28%(-0.759)#4,916 |
| 97. | Saukville | 0.51% | 0.43%(+0.084)#97 | 1.28%(-0.761)#4,930 |
| 98. | Ladysmith | 0.50% | 0.43%(+0.070)#98 | 1.28%(-0.774)#5,016 |
| 99. | Wautoma | 0.50% | 0.43%(+0.068)#99 | 1.28%(-0.776)#5,033 |
| 100. | Lake Wisconsin | 0.49% | 0.43%(+0.060)#100 | 1.28%(-0.784)#5,082 |
Common Questions
What are the Top 10 Cities with the Highest Percentage of Immigrants from Eastern Asia in Wisconsin?
Top 10 Cities with the Highest Percentage of Immigrants from Eastern Asia in Wisconsin are:
#1
7.25%
#2
6.91%
#3
3.89%
#4
3.53%
#5
3.49%
#6
2.87%
#7
2.86%
#8
2.63%
#9
2.60%
#10
2.47%
What city has the Highest Percentage of Immigrants from Eastern Asia in Wisconsin?
Mountain has the Highest Percentage of Immigrants from Eastern Asia in Wisconsin with 7.25%.
What is the Percentage of Immigrants from Eastern Asia in the State of Wisconsin?
Percentage of Immigrants from Eastern Asia in Wisconsin is 0.43%.
What is the Percentage of Immigrants from Eastern Asia in the United States?
Percentage of Immigrants from Eastern Asia in the United States is 1.28%.