South African Male Disability
COMPARE
South African
Select to Compare
Male Disability
South African Male Disability
11.0%
DISABILITY | MALES
81.7/ 100
METRIC RATING
139th/ 347
METRIC RANK
South African Male Disability Correlation Chart
The statistical analysis conducted on geographies consisting of 182,590,861 people shows a moderate positive correlation between the proportion of South Africans and percentage of males with a disability in the United States with a correlation coefficient (R) of 0.410 and weighted average of 11.0%. On average, for every 1% (one percent) increase in South Africans within a typical geography, there is an increase of 0.21% in percentage of males with a disability.
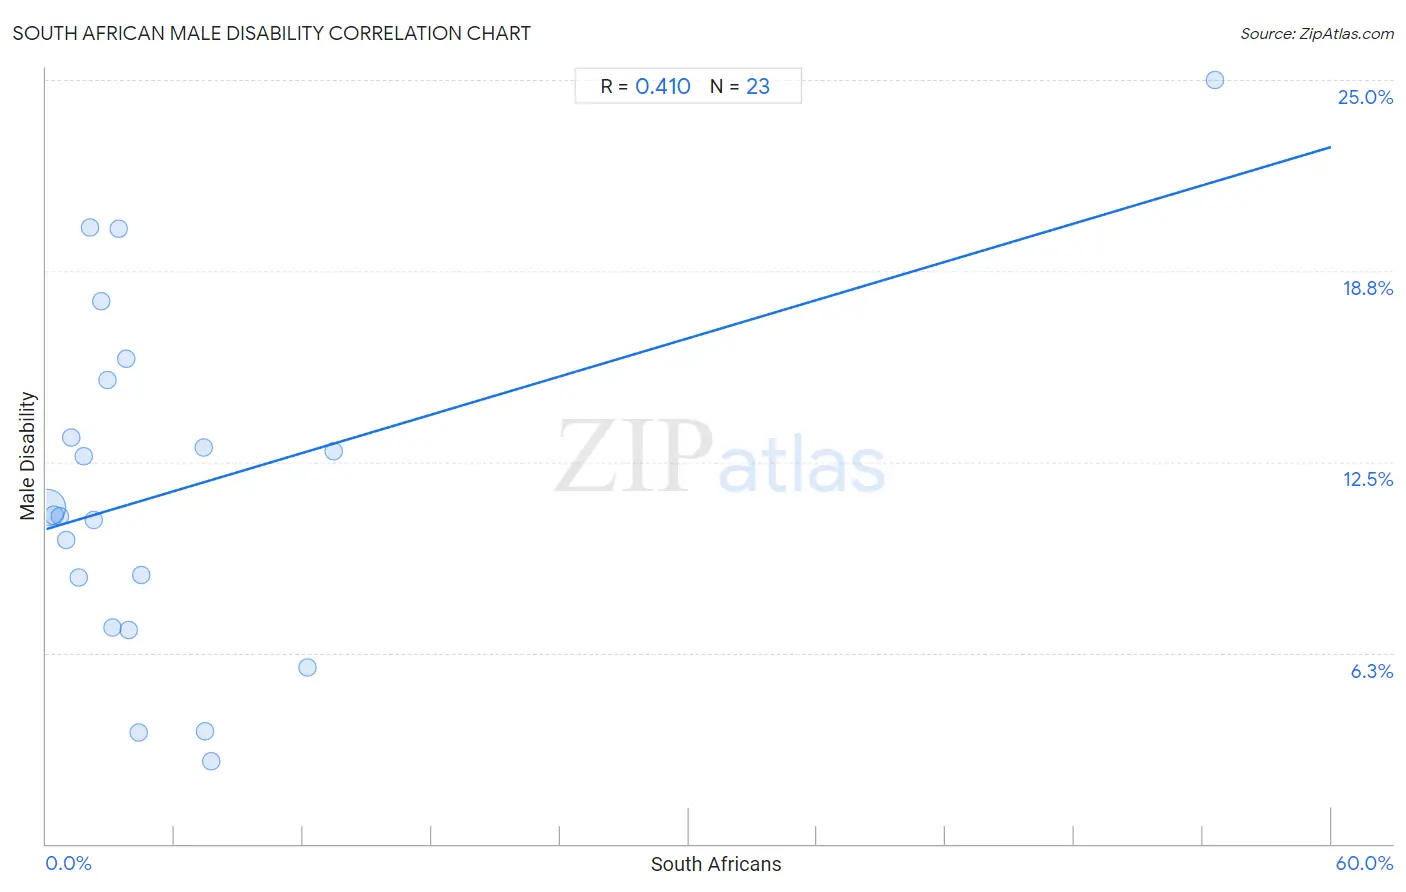
It is essential to understand that the correlation between the percentage of South Africans and percentage of males with a disability does not imply a direct cause-and-effect relationship. It remains uncertain whether the presence of South Africans influences an upward or downward trend in the level of percentage of males with a disability within an area, or if South Africans simply ended up residing in those areas with higher or lower levels of percentage of males with a disability due to other factors.
Demographics Similar to South Africans by Male Disability
In terms of male disability, the demographic groups most similar to South Africans are Nigerian (11.0%, a difference of 0.020%), Immigrants from Italy (11.0%, a difference of 0.020%), Arab (11.0%, a difference of 0.020%), Immigrants from Sudan (11.0%, a difference of 0.020%), and Immigrants from Europe (11.0%, a difference of 0.030%).
| Demographics | Rating | Rank | Male Disability |
| Immigrants from Fiji | 84.0 /100 | #132 | Excellent 11.0% |
| Ugandans | 83.9 /100 | #133 | Excellent 11.0% |
| Bhutanese | 83.4 /100 | #134 | Excellent 11.0% |
| Trinidadians and Tobagonians | 83.3 /100 | #135 | Excellent 11.0% |
| Immigrants from Costa Rica | 82.8 /100 | #136 | Excellent 11.0% |
| Immigrants from Europe | 82.0 /100 | #137 | Excellent 11.0% |
| Nigerians | 81.9 /100 | #138 | Excellent 11.0% |
| South Africans | 81.7 /100 | #139 | Excellent 11.0% |
| Immigrants from Italy | 81.5 /100 | #140 | Excellent 11.0% |
| Arabs | 81.5 /100 | #141 | Excellent 11.0% |
| Immigrants from Sudan | 81.5 /100 | #142 | Excellent 11.0% |
| Moroccans | 80.7 /100 | #143 | Excellent 11.0% |
| Kenyans | 78.1 /100 | #144 | Good 11.0% |
| Costa Ricans | 78.0 /100 | #145 | Good 11.0% |
| Koreans | 77.5 /100 | #146 | Good 11.0% |
South African Male Disability Correlation Summary
| Measurement | South African Data | Male Disability Data |
| Minimum | 0.053% | 2.7% |
| Maximum | 54.5% | 25.0% |
| Range | 54.5% | 22.3% |
| Mean | 6.2% | 11.6% |
| Median | 3.1% | 10.8% |
| Interquartile 25% (IQ1) | 1.5% | 7.1% |
| Interquartile 75% (IQ3) | 7.3% | 15.2% |
| Interquartile Range (IQR) | 5.8% | 8.1% |
| Standard Deviation (Sample) | 11.1% | 5.7% |
| Standard Deviation (Population) | 10.9% | 5.5% |
Correlation Details
| South African Percentile | Sample Size | Male Disability |
[ 0.0% - 0.5% ] 0.053% | 173,911,731 | 11.0% |
[ 0.0% - 0.5% ] 0.36% | 5,958,145 | 10.8% |
[ 0.5% - 1.0% ] 0.66% | 1,548,280 | 10.7% |
[ 0.5% - 1.0% ] 0.95% | 553,077 | 9.9% |
[ 1.0% - 1.5% ] 1.18% | 173,503 | 13.3% |
[ 1.0% - 1.5% ] 1.50% | 150,215 | 8.7% |
[ 1.5% - 2.0% ] 1.77% | 69,808 | 12.7% |
[ 2.0% - 2.5% ] 2.04% | 58,268 | 20.2% |
[ 2.0% - 2.5% ] 2.20% | 21,693 | 10.6% |
[ 2.5% - 3.0% ] 2.59% | 32,668 | 17.8% |
[ 2.5% - 3.0% ] 2.86% | 21,577 | 15.2% |
[ 3.0% - 3.5% ] 3.08% | 38,114 | 7.1% |
[ 3.0% - 3.5% ] 3.37% | 4,717 | 20.1% |
[ 3.5% - 4.0% ] 3.73% | 9,783 | 15.9% |
[ 3.5% - 4.0% ] 3.84% | 26,498 | 7.0% |
[ 4.0% - 4.5% ] 4.34% | 4,450 | 3.6% |
[ 4.0% - 4.5% ] 4.46% | 3,541 | 8.8% |
[ 7.0% - 7.5% ] 7.33% | 1,638 | 13.0% |
[ 7.0% - 7.5% ] 7.39% | 1,841 | 3.7% |
[ 7.5% - 8.0% ] 7.69% | 65 | 2.7% |
[ 12.0% - 12.5% ] 12.18% | 985 | 5.8% |
[ 13.0% - 13.5% ] 13.44% | 253 | 12.8% |
[ 54.5% - 55.0% ] 54.55% | 11 | 25.0% |