African Male Disability
COMPARE
African
Select to Compare
Male Disability
African Male Disability
12.6%
DISABILITY | MALES
0.0/ 100
METRIC RATING
276th/ 347
METRIC RANK
African Male Disability Correlation Chart
The statistical analysis conducted on geographies consisting of 469,942,383 people shows a poor positive correlation between the proportion of Africans and percentage of males with a disability in the United States with a correlation coefficient (R) of 0.149 and weighted average of 12.6%. On average, for every 1% (one percent) increase in Africans within a typical geography, there is an increase of 0.057% in percentage of males with a disability.
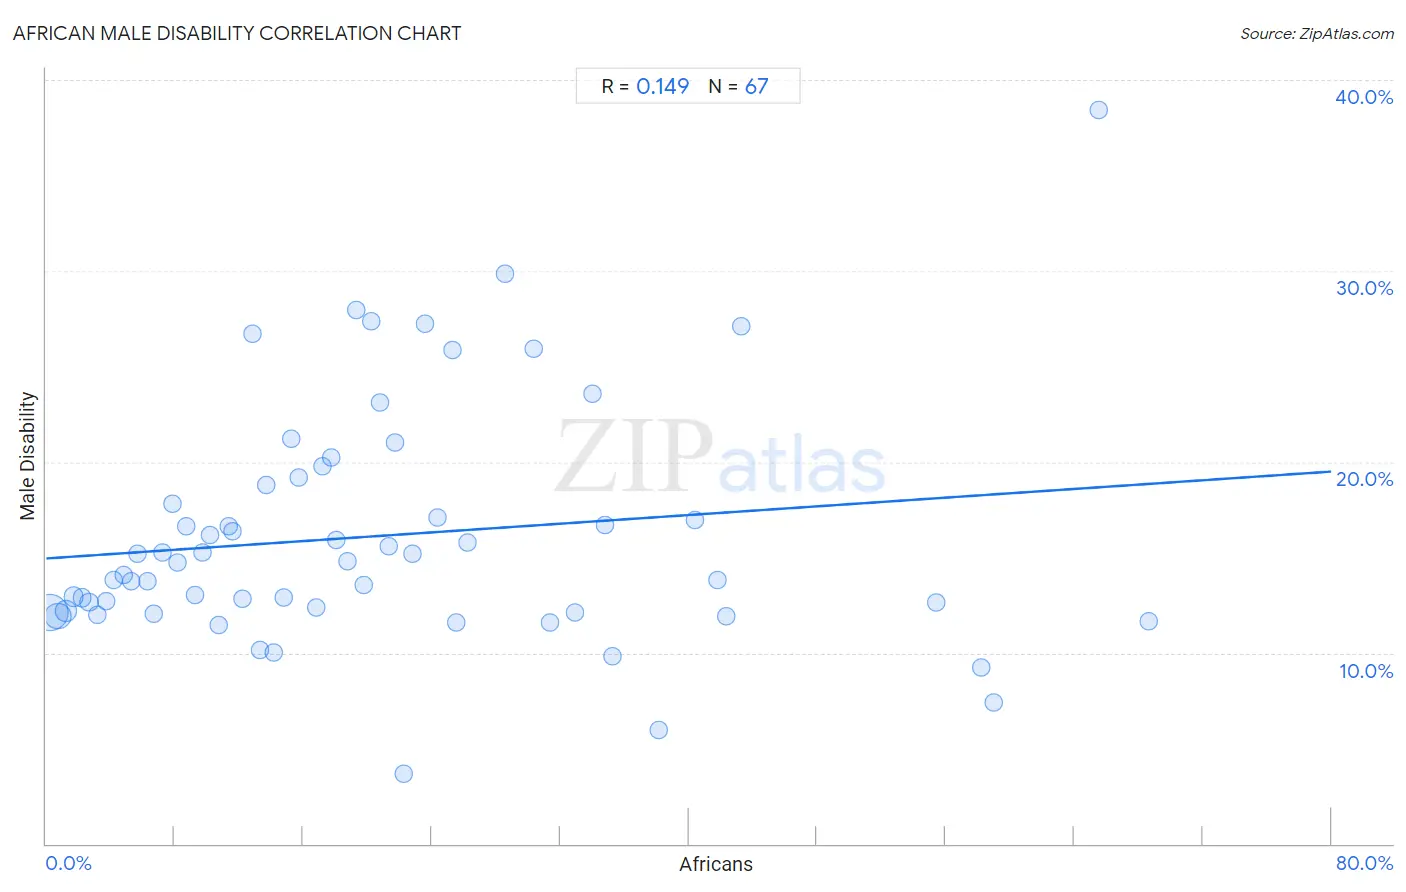
It is essential to understand that the correlation between the percentage of Africans and percentage of males with a disability does not imply a direct cause-and-effect relationship. It remains uncertain whether the presence of Africans influences an upward or downward trend in the level of percentage of males with a disability within an area, or if Africans simply ended up residing in those areas with higher or lower levels of percentage of males with a disability due to other factors.
Demographics Similar to Africans by Male Disability
In terms of male disability, the demographic groups most similar to Africans are Fijian (12.6%, a difference of 0.050%), Finnish (12.6%, a difference of 0.31%), Hopi (12.5%, a difference of 0.40%), Native Hawaiian (12.5%, a difference of 0.74%), and Hmong (12.5%, a difference of 0.80%).
| Demographics | Rating | Rank | Male Disability |
| Czechoslovakians | 0.1 /100 | #269 | Tragic 12.3% |
| Spaniards | 0.1 /100 | #270 | Tragic 12.3% |
| Scandinavians | 0.1 /100 | #271 | Tragic 12.3% |
| Hmong | 0.0 /100 | #272 | Tragic 12.5% |
| Native Hawaiians | 0.0 /100 | #273 | Tragic 12.5% |
| Hopi | 0.0 /100 | #274 | Tragic 12.5% |
| Fijians | 0.0 /100 | #275 | Tragic 12.6% |
| Africans | 0.0 /100 | #276 | Tragic 12.6% |
| Finns | 0.0 /100 | #277 | Tragic 12.6% |
| Central American Indians | 0.0 /100 | #278 | Tragic 12.7% |
| Slovaks | 0.0 /100 | #279 | Tragic 12.7% |
| Dutch | 0.0 /100 | #280 | Tragic 12.7% |
| Sioux | 0.0 /100 | #281 | Tragic 12.7% |
| Irish | 0.0 /100 | #282 | Tragic 12.7% |
| Germans | 0.0 /100 | #283 | Tragic 12.7% |
African Male Disability Correlation Summary
| Measurement | African Data | Male Disability Data |
| Minimum | 0.21% | 3.6% |
| Maximum | 68.6% | 38.5% |
| Range | 68.4% | 34.8% |
| Mean | 20.6% | 16.1% |
| Median | 17.2% | 14.7% |
| Interquartile 25% (IQ1) | 8.2% | 12.1% |
| Interquartile 75% (IQ3) | 28.6% | 18.8% |
| Interquartile Range (IQR) | 20.4% | 6.7% |
| Standard Deviation (Sample) | 16.3% | 6.2% |
| Standard Deviation (Population) | 16.2% | 6.2% |
Correlation Details
| African Percentile | Sample Size | Male Disability |
[ 0.0% - 0.5% ] 0.21% | 253,433,407 | 12.1% |
[ 0.5% - 1.0% ] 0.72% | 105,861,464 | 11.9% |
[ 1.0% - 1.5% ] 1.21% | 58,352,782 | 12.2% |
[ 1.5% - 2.0% ] 1.72% | 21,041,177 | 12.9% |
[ 2.0% - 2.5% ] 2.23% | 10,669,480 | 12.9% |
[ 2.5% - 3.0% ] 2.68% | 7,858,765 | 12.6% |
[ 3.0% - 3.5% ] 3.20% | 4,256,469 | 12.0% |
[ 3.5% - 4.0% ] 3.71% | 1,826,527 | 12.7% |
[ 4.0% - 4.5% ] 4.22% | 1,254,477 | 13.8% |
[ 4.5% - 5.0% ] 4.82% | 1,339,417 | 14.1% |
[ 5.0% - 5.5% ] 5.26% | 829,227 | 13.7% |
[ 5.5% - 6.0% ] 5.71% | 463,028 | 15.2% |
[ 6.0% - 6.5% ] 6.31% | 407,365 | 13.8% |
[ 6.5% - 7.0% ] 6.70% | 495,497 | 12.0% |
[ 7.0% - 7.5% ] 7.25% | 287,339 | 15.2% |
[ 7.5% - 8.0% ] 7.83% | 204,564 | 17.8% |
[ 8.0% - 8.5% ] 8.19% | 160,780 | 14.7% |
[ 8.5% - 9.0% ] 8.70% | 159,998 | 16.6% |
[ 9.0% - 9.5% ] 9.27% | 165,701 | 13.1% |
[ 9.5% - 10.0% ] 9.74% | 68,122 | 15.3% |
[ 10.0% - 10.5% ] 10.22% | 137,236 | 16.2% |
[ 10.5% - 11.0% ] 10.72% | 230,762 | 11.4% |
[ 11.0% - 11.5% ] 11.34% | 9,772 | 16.6% |
[ 11.5% - 12.0% ] 11.63% | 26,234 | 16.3% |
[ 12.0% - 12.5% ] 12.23% | 11,708 | 12.8% |
[ 12.5% - 13.0% ] 12.87% | 33,190 | 26.7% |
[ 13.0% - 13.5% ] 13.31% | 4,891 | 10.1% |
[ 13.5% - 14.0% ] 13.70% | 5,197 | 18.8% |
[ 14.0% - 14.5% ] 14.17% | 15,888 | 10.0% |
[ 14.5% - 15.0% ] 14.77% | 104,025 | 12.9% |
[ 15.0% - 15.5% ] 15.28% | 22,936 | 21.2% |
[ 15.5% - 16.0% ] 15.73% | 11,906 | 19.2% |
[ 16.5% - 17.0% ] 16.79% | 7,610 | 12.4% |
[ 17.0% - 17.5% ] 17.21% | 16,332 | 19.8% |
[ 17.5% - 18.0% ] 17.74% | 2,672 | 20.2% |
[ 18.0% - 18.5% ] 18.06% | 40,302 | 15.9% |
[ 18.5% - 19.0% ] 18.74% | 19,765 | 14.8% |
[ 19.0% - 19.5% ] 19.26% | 488 | 27.9% |
[ 19.5% - 20.0% ] 19.75% | 13,578 | 13.6% |
[ 20.0% - 20.5% ] 20.24% | 3,305 | 27.4% |
[ 20.5% - 21.0% ] 20.81% | 3,239 | 23.1% |
[ 21.0% - 21.5% ] 21.32% | 15,443 | 15.6% |
[ 21.5% - 22.0% ] 21.72% | 7,110 | 21.0% |
[ 22.0% - 22.5% ] 22.26% | 283 | 3.6% |
[ 22.5% - 23.0% ] 22.80% | 9,501 | 15.2% |
[ 23.5% - 24.0% ] 23.56% | 365 | 27.2% |
[ 24.0% - 24.5% ] 24.38% | 24,795 | 17.1% |
[ 25.0% - 25.5% ] 25.30% | 1,170 | 25.9% |
[ 25.5% - 26.0% ] 25.54% | 881 | 11.6% |
[ 26.0% - 26.5% ] 26.24% | 2,138 | 15.8% |
[ 28.5% - 29.0% ] 28.57% | 154 | 29.9% |
[ 30.0% - 30.5% ] 30.36% | 606 | 25.9% |
[ 31.0% - 31.5% ] 31.35% | 2,485 | 11.6% |
[ 32.5% - 33.0% ] 32.93% | 334 | 12.1% |
[ 34.0% - 34.5% ] 34.01% | 1,476 | 23.6% |
[ 34.5% - 35.0% ] 34.78% | 46 | 16.7% |
[ 35.0% - 35.5% ] 35.23% | 1,286 | 9.8% |
[ 38.0% - 38.5% ] 38.10% | 4,572 | 5.9% |
[ 40.0% - 40.5% ] 40.41% | 9,613 | 16.9% |
[ 41.5% - 42.0% ] 41.76% | 613 | 13.8% |
[ 42.0% - 42.5% ] 42.31% | 338 | 11.9% |
[ 43.0% - 43.5% ] 43.29% | 633 | 27.1% |
[ 55.0% - 55.5% ] 55.41% | 231 | 12.6% |
[ 58.0% - 58.5% ] 58.19% | 574 | 9.2% |
[ 59.0% - 59.5% ] 59.02% | 549 | 7.4% |
[ 65.5% - 66.0% ] 65.55% | 479 | 38.5% |
[ 68.5% - 69.0% ] 68.60% | 86 | 11.6% |