Cambodian GED/Equivalency

COMPARE

Cambodian
Race
Ancestry
AfghanAfricanAlaska NativeAlaskan AthabascanAlbanianAleutAlsatianAmericanApacheArabArapahoArgentineanArmenianAssyrian/Chaldean/SyriacAustralianAustrianBahamianBangladeshiBarbadianBasqueBelgianBelizeanBermudanBhutaneseBlackfeetBolivianBrazilianBritishBritish West IndianBulgarianBurmeseCajunCambodianCanadianCape VerdeanCarpatho RusynCelticCentral AmericanCentral American IndianCherokeeCheyenneChickasawChileanChineseChippewaChoctawColombianColvilleComancheCosta RicanCreeCreekCroatianCrowCubanCypriotCzechCzechoslovakianDanishDelawareDominicanDutchDutch West IndianEastern EuropeanEcuadorianEgyptianEnglishEstonianEthiopianEuropeanFijianFilipinoFinnishFrenchFrench American IndianFrench CanadianGermanGerman RussianGhanaianGreekGuamanian/ChamorroGuatemalanGuyaneseHaitianHmongHonduranHopiHoumaHungarianIcelanderIndian (Asian)IndonesianInupiatIranianIraqiIrishIroquoisIsraeliItalianJamaicanJapaneseJordanianKenyanKiowaKoreanLaotianLatvianLebaneseLiberianLithuanianLumbeeLuxembourgerMacedonianMalaysianMalteseMarshalleseMenomineeMexicanMexican American IndianMongolianMoroccanNative HawaiianNavajoNepaleseNew ZealanderNicaraguanNigerianNorthern EuropeanNorwegianOkinawanOsageOttawaPaiutePakistaniPalestinianPanamanianParaguayanPennsylvania GermanPeruvianPimaPolishPortuguesePotawatomiPuebloPuerto RicanPuget Sound SalishRomanianRussianSalvadoranSamoanScandinavianScotch-IrishScottishSeminoleSenegaleseSerbianShoshoneSierra LeoneanSiouxSlavicSlovakSloveneSomaliSouth AfricanSouth AmericanSouth American IndianSoviet UnionSpaniardSpanishSpanish AmericanSpanish American IndianSri LankanSubsaharan AfricanSudaneseSwedishSwissSyrianTaiwaneseThaiTlingit-HaidaTohono O'OdhamTonganTrinidadian and TobagonianTsimshianTurkishU.S. Virgin IslanderUgandanUkrainianUruguayanUteVenezuelanVietnameseWelshWest IndianYakamaYaquiYugoslavianYumanYup'ikZimbabwean
Immigration
NonimmigrantsImmigrantsAfghanistanAfricaAlbaniaArgentinaArmeniaAsiaAustraliaAustriaBahamasBangladeshBarbadosBelarusBelgiumBelizeBoliviaBosnia and HerzegovinaBrazilBulgariaBurma/MyanmarCabo VerdeCambodiaCameroonCanadaCaribbeanCentral AmericaChileChinaColombiaCongoCosta RicaCroatiaCubaCzechoslovakiaDenmarkDominicaDominican RepublicEastern AfricaEastern AsiaEastern EuropeEcuadorEgyptEl SalvadorEnglandEritreaEthiopiaEuropeFijiFranceGermanyGhanaGreeceGrenadaGuatemalaGuyanaHaitiHondurasHong KongHungaryIndiaIndonesiaIranIraqIrelandIsraelItalyJamaicaJapanJordanKazakhstanKenyaKoreaKuwaitLaosLatin AmericaLatviaLebanonLiberiaLithuaniaMalaysiaMexicoMicronesiaMiddle AfricaMoldovaMoroccoNepalNetherlandsNicaraguaNigeriaNorth AmericaNorth MacedoniaNorthern AfricaNorthern EuropeNorwayOceaniaPakistanPanamaPeruPhilippinesPolandPortugalRomaniaRussiaSaudi ArabiaScotlandSenegalSerbiaSierra LeoneSingaporeSomaliaSouth AfricaSouth AmericaSouth Central AsiaSouth Eastern AsiaSouthern EuropeSpainSri LankaSt. Vincent and the GrenadinesSudanSwedenSwitzerlandSyriaTaiwanThailandTrinidad and TobagoTurkeyUgandaUkraineUruguayUzbekistanVenezuelaVietnamWest IndiesWestern AfricaWestern AsiaWestern EuropeYemenZaireZimbabweAzores
Select to Compare
Race
Ancestry
AfghanAfricanAlaska NativeAlaskan AthabascanAlbanianAleutAlsatianAmericanApacheArabArapahoArgentineanArmenianAssyrian/Chaldean/SyriacAustralianAustrianBahamianBangladeshiBarbadianBasqueBelgianBelizeanBermudanBhutaneseBlackfeetBolivianBrazilianBritishBritish West IndianBulgarianBurmeseCajunCanadianCape VerdeanCarpatho RusynCelticCentral AmericanCentral American IndianCherokeeCheyenneChickasawChileanChineseChippewaChoctawColombianColvilleComancheCosta RicanCreeCreekCroatianCrowCubanCypriotCzechCzechoslovakianDanishDelawareDominicanDutchDutch West IndianEastern EuropeanEcuadorianEgyptianEnglishEstonianEthiopianEuropeanFijianFilipinoFinnishFrenchFrench American IndianFrench CanadianGermanGerman RussianGhanaianGreekGuamanian/ChamorroGuatemalanGuyaneseHaitianHmongHonduranHopiHoumaHungarianIcelanderIndian (Asian)IndonesianInupiatIranianIraqiIrishIroquoisIsraeliItalianJamaicanJapaneseJordanianKenyanKiowaKoreanLaotianLatvianLebaneseLiberianLithuanianLumbeeLuxembourgerMacedonianMalaysianMalteseMarshalleseMenomineeMexicanMexican American IndianMongolianMoroccanNative HawaiianNavajoNepaleseNew ZealanderNicaraguanNigerianNorthern EuropeanNorwegianOkinawanOsageOttawaPaiutePakistaniPalestinianPanamanianParaguayanPennsylvania GermanPeruvianPimaPolishPortuguesePotawatomiPuebloPuerto RicanPuget Sound SalishRomanianRussianSalvadoranSamoanScandinavianScotch-IrishScottishSeminoleSenegaleseSerbianShoshoneSierra LeoneanSiouxSlavicSlovakSloveneSomaliSouth AfricanSouth AmericanSouth American IndianSoviet UnionSpaniardSpanishSpanish AmericanSpanish American IndianSri LankanSubsaharan AfricanSudaneseSwedishSwissSyrianTaiwaneseThaiTlingit-HaidaTohono O'OdhamTonganTrinidadian and TobagonianTsimshianTurkishU.S. Virgin IslanderUgandanUkrainianUruguayanUteVenezuelanVietnameseWelshWest IndianYakamaYaquiYugoslavianYumanYup'ikZimbabwean
Immigration
NonimmigrantsImmigrantsAfghanistanAfricaAlbaniaArgentinaArmeniaAsiaAustraliaAustriaBahamasBangladeshBarbadosBelarusBelgiumBelizeBoliviaBosnia and HerzegovinaBrazilBulgariaBurma/MyanmarCabo VerdeCambodiaCameroonCanadaCaribbeanCentral AmericaChileChinaColombiaCongoCosta RicaCroatiaCubaCzechoslovakiaDenmarkDominicaDominican RepublicEastern AfricaEastern AsiaEastern EuropeEcuadorEgyptEl SalvadorEnglandEritreaEthiopiaEuropeFijiFranceGermanyGhanaGreeceGrenadaGuatemalaGuyanaHaitiHondurasHong KongHungaryIndiaIndonesiaIranIraqIrelandIsraelItalyJamaicaJapanJordanKazakhstanKenyaKoreaKuwaitLaosLatin AmericaLatviaLebanonLiberiaLithuaniaMalaysiaMexicoMicronesiaMiddle AfricaMoldovaMoroccoNepalNetherlandsNicaraguaNigeriaNorth AmericaNorth MacedoniaNorthern AfricaNorthern EuropeNorwayOceaniaPakistanPanamaPeruPhilippinesPolandPortugalRomaniaRussiaSaudi ArabiaScotlandSenegalSerbiaSierra LeoneSingaporeSomaliaSouth AfricaSouth AmericaSouth Central AsiaSouth Eastern AsiaSouthern EuropeSpainSri LankaSt. Vincent and the GrenadinesSudanSwedenSwitzerlandSyriaTaiwanThailandTrinidad and TobagoTurkeyUgandaUkraineUruguayUzbekistanVenezuelaVietnamWest IndiesWestern AfricaWestern AsiaWestern EuropeYemenZaireZimbabweAzores
GED/Equivalency
Income
Poverty
Unemployment
Labor Participation
Family Structure
Vehicle Availability
Education Level
Disability

Cambodian GED/Equivalency
Exceptional

88.2%
GED/EQUIVALENCY
99.6/ 100
METRIC RATING
42nd/ 347
METRIC RANK

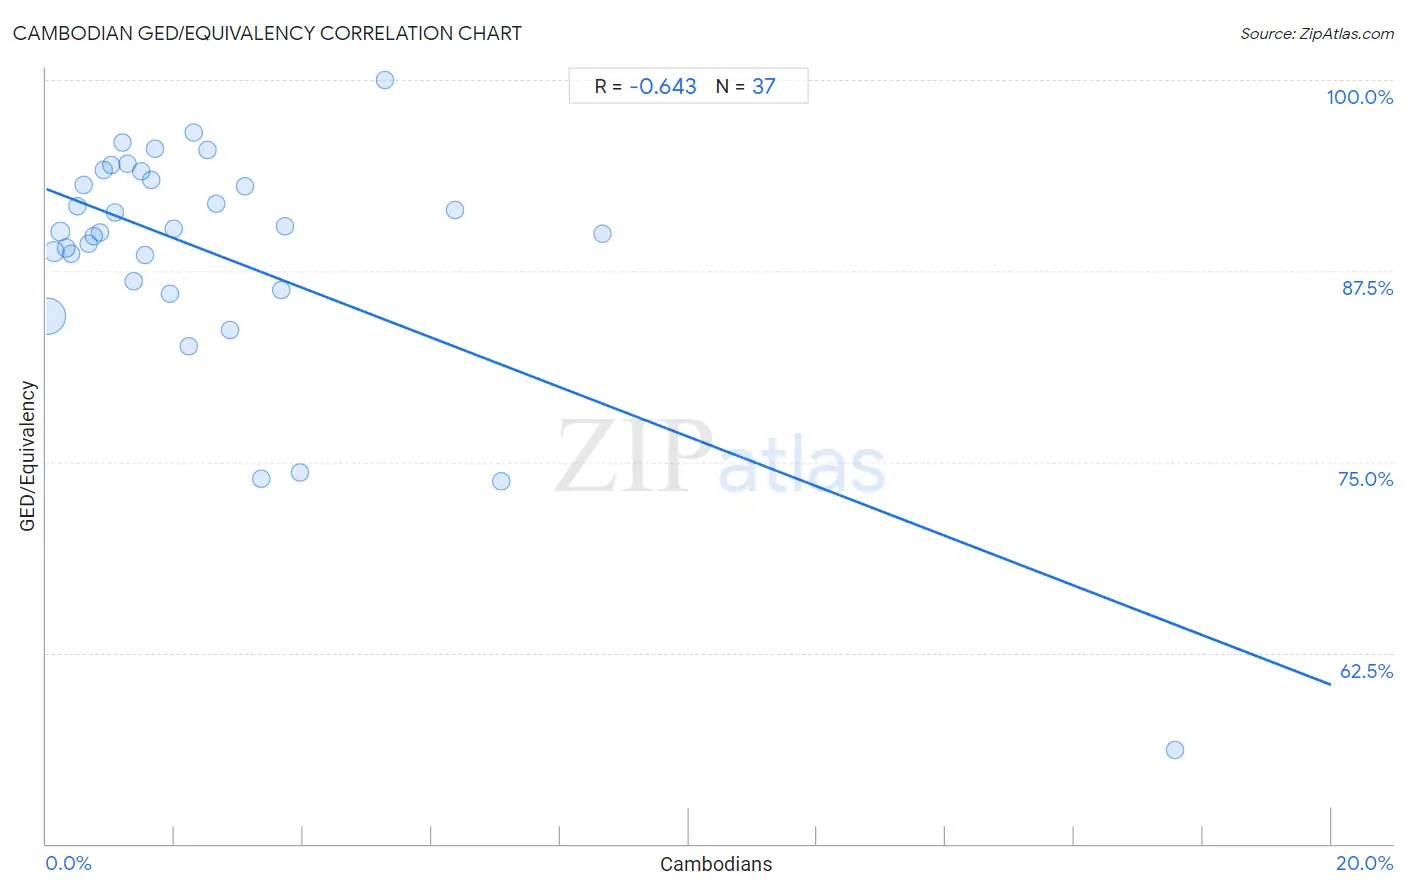
Cambodian GED/Equivalency Correlation Chart

The statistical analysis conducted on geographies consisting of 102,514,874 people shows a significant negative correlation between the proportion of Cambodians and percentage of population with at least ged/equivalency education in the United States with a correlation coefficient (R) of -0.643 and weighted average of 88.2%. On average, for every 1% (one percent) increase in Cambodians within a typical geography, there is a decrease of 1.6% in percentage of population with at least ged/equivalency education.
Cambodian GED/Equivalency
It is essential to understand that the correlation between the percentage of Cambodians and percentage of population with at least ged/equivalency education does not imply a direct cause-and-effect relationship. It remains uncertain whether the presence of Cambodians influences an upward or downward trend in the level of percentage of population with at least ged/equivalency education within an area, or if Cambodians simply ended up residing in those areas with higher or lower levels of percentage of population with at least ged/equivalency education due to other factors.

Demographics Similar to Cambodians by GED/Equivalency

In terms of ged/equivalency, the demographic groups most similar to Cambodians are Immigrants from Scotland (88.2%, a difference of 0.0%), Finnish (88.2%, a difference of 0.030%), Italian (88.2%, a difference of 0.040%), Macedonian (88.1%, a difference of 0.040%), and Immigrants from Israel (88.2%, a difference of 0.060%).
DemographicsRating | RankGED/Equivalency
Immigrants from South Central Asia
99.7
/100
|
#35
Exceptional
88.4%
Immigrants from Belgium
99.7
/100
|
#36
Exceptional
88.3%
Immigrants from Austria
99.7
/100
|
#37
Exceptional
88.3%
Burmese
99.7
/100
|
#38
Exceptional
88.3%
Immigrants from Israel
99.6
/100
|
#39
Exceptional
88.2%
Italians
99.6
/100
|
#40
Exceptional
88.2%
Finns
99.6
/100
|
#41
Exceptional
88.2%
Cambodians
99.6
/100
|
#42
Exceptional
88.2%
Immigrants from Scotland
99.6
/100
|
#43
Exceptional
88.2%
Macedonians
99.5
/100
|
#44
Exceptional
88.1%
Czechs
99.5
/100
|
#45
Exceptional
88.1%
Immigrants from Switzerland
99.5
/100
|
#46
Exceptional
88.1%
Immigrants from Latvia
99.5
/100
|
#47
Exceptional
88.1%
Greeks
99.5
/100
|
#48
Exceptional
88.1%
Australians
99.5
/100
|
#49
Exceptional
88.1%

Cambodian GED/Equivalency Correlation Summary

MeasurementCambodian DataGED/Equivalency Data
Minimum0.024%56.1%
Maximum17.6%100.0%
Range17.6%43.9%
Mean2.6%88.6%
Median1.6%90.1%
Interquartile 25% (IQ1)0.78%86.5%
Interquartile 75% (IQ3)3.2%93.8%
Interquartile Range (IQR)2.4%7.2%
Standard Deviation (Sample)3.2%8.1%
Standard Deviation (Population)3.2%8.0%

Correlation Details

Cambodian PercentileSample SizeGED/Equivalency
[
0.0%
-
0.5%
]
0.024%
87,243,96884.5%
[
0.0%
-
0.5%
]
0.12%
8,307,00488.8%
[
0.0%
-
0.5%
]
0.22%
2,497,76090.1%
[
0.0%
-
0.5%
]
0.30%
1,482,35089.0%
[
0.0%
-
0.5%
]
0.38%
712,05088.6%
[
0.0%
-
0.5%
]
0.48%
385,88691.8%
[
0.5%
-
1.0%
]
0.59%
413,72693.2%
[
0.5%
-
1.0%
]
0.65%
411,38589.3%
[
0.5%
-
1.0%
]
0.74%
356,63289.8%
[
0.5%
-
1.0%
]
0.83%
201,10690.0%
[
0.5%
-
1.0%
]
0.90%
94,34694.1%
[
1.0%
-
1.5%
]
1.01%
140,02594.4%
[
1.0%
-
1.5%
]
1.07%
53,88291.3%
[
1.0%
-
1.5%
]
1.18%
23,92995.9%
[
1.0%
-
1.5%
]
1.26%
43,84394.5%
[
1.0%
-
1.5%
]
1.36%
8,89986.8%
[
1.0%
-
1.5%
]
1.48%
1,69294.1%
[
1.5%
-
2.0%
]
1.54%
84588.6%
[
1.5%
-
2.0%
]
1.64%
6,77193.5%
[
1.5%
-
2.0%
]
1.68%
47595.5%
[
1.5%
-
2.0%
]
1.93%
1,70886.0%
[
1.5%
-
2.0%
]
1.99%
2,36790.3%
[
2.0%
-
2.5%
]
2.23%
38,40082.6%
[
2.0%
-
2.5%
]
2.30%
25,37496.6%
[
2.5%
-
3.0%
]
2.51%
41,05895.4%
[
2.5%
-
3.0%
]
2.65%
2,71691.9%
[
2.5%
-
3.0%
]
2.86%
3,57183.6%
[
3.0%
-
3.5%
]
3.10%
2,93393.1%
[
3.0%
-
3.5%
]
3.35%
1,67073.9%
[
3.5%
-
4.0%
]
3.65%
2,02886.3%
[
3.5%
-
4.0%
]
3.71%
67490.4%
[
3.5%
-
4.0%
]
3.95%
1,82274.3%
[
5.0%
-
5.5%
]
5.28%
587100.0%
[
6.0%
-
6.5%
]
6.37%
58191.5%
[
7.0%
-
7.5%
]
7.09%
1,41173.7%
[
8.5%
-
9.0%
]
8.66%
83189.9%
[
17.5%
-
18.0%
]
17.57%
56956.1%