Immigrants from Senegal GED/Equivalency

COMPARE

Immigrants from Senegal
Race
Ancestry
AfghanAfricanAlaska NativeAlaskan AthabascanAlbanianAleutAlsatianAmericanApacheArabArapahoArgentineanArmenianAssyrian/Chaldean/SyriacAustralianAustrianBahamianBangladeshiBarbadianBasqueBelgianBelizeanBermudanBhutaneseBlackfeetBolivianBrazilianBritishBritish West IndianBulgarianBurmeseCajunCambodianCanadianCape VerdeanCarpatho RusynCelticCentral AmericanCentral American IndianCherokeeCheyenneChickasawChileanChineseChippewaChoctawColombianColvilleComancheCosta RicanCreeCreekCroatianCrowCubanCypriotCzechCzechoslovakianDanishDelawareDominicanDutchDutch West IndianEastern EuropeanEcuadorianEgyptianEnglishEstonianEthiopianEuropeanFijianFilipinoFinnishFrenchFrench American IndianFrench CanadianGermanGerman RussianGhanaianGreekGuamanian/ChamorroGuatemalanGuyaneseHaitianHmongHonduranHopiHoumaHungarianIcelanderIndian (Asian)IndonesianInupiatIranianIraqiIrishIroquoisIsraeliItalianJamaicanJapaneseJordanianKenyanKiowaKoreanLaotianLatvianLebaneseLiberianLithuanianLumbeeLuxembourgerMacedonianMalaysianMalteseMarshalleseMenomineeMexicanMexican American IndianMongolianMoroccanNative HawaiianNavajoNepaleseNew ZealanderNicaraguanNigerianNorthern EuropeanNorwegianOkinawanOsageOttawaPaiutePakistaniPalestinianPanamanianParaguayanPennsylvania GermanPeruvianPimaPolishPortuguesePotawatomiPuebloPuerto RicanPuget Sound SalishRomanianRussianSalvadoranSamoanScandinavianScotch-IrishScottishSeminoleSenegaleseSerbianShoshoneSierra LeoneanSiouxSlavicSlovakSloveneSomaliSouth AfricanSouth AmericanSouth American IndianSoviet UnionSpaniardSpanishSpanish AmericanSpanish American IndianSri LankanSubsaharan AfricanSudaneseSwedishSwissSyrianTaiwaneseThaiTlingit-HaidaTohono O'OdhamTonganTrinidadian and TobagonianTsimshianTurkishU.S. Virgin IslanderUgandanUkrainianUruguayanUteVenezuelanVietnameseWelshWest IndianYakamaYaquiYugoslavianYumanYup'ikZimbabwean
Immigration
NonimmigrantsImmigrantsAfghanistanAfricaAlbaniaArgentinaArmeniaAsiaAustraliaAustriaBahamasBangladeshBarbadosBelarusBelgiumBelizeBoliviaBosnia and HerzegovinaBrazilBulgariaBurma/MyanmarCabo VerdeCambodiaCameroonCanadaCaribbeanCentral AmericaChileChinaColombiaCongoCosta RicaCroatiaCubaCzechoslovakiaDenmarkDominicaDominican RepublicEastern AfricaEastern AsiaEastern EuropeEcuadorEgyptEl SalvadorEnglandEritreaEthiopiaEuropeFijiFranceGermanyGhanaGreeceGrenadaGuatemalaGuyanaHaitiHondurasHong KongHungaryIndiaIndonesiaIranIraqIrelandIsraelItalyJamaicaJapanJordanKazakhstanKenyaKoreaKuwaitLaosLatin AmericaLatviaLebanonLiberiaLithuaniaMalaysiaMexicoMicronesiaMiddle AfricaMoldovaMoroccoNepalNetherlandsNicaraguaNigeriaNorth AmericaNorth MacedoniaNorthern AfricaNorthern EuropeNorwayOceaniaPakistanPanamaPeruPhilippinesPolandPortugalRomaniaRussiaSaudi ArabiaScotlandSenegalSerbiaSierra LeoneSingaporeSomaliaSouth AfricaSouth AmericaSouth Central AsiaSouth Eastern AsiaSouthern EuropeSpainSri LankaSt. Vincent and the GrenadinesSudanSwedenSwitzerlandSyriaTaiwanThailandTrinidad and TobagoTurkeyUgandaUkraineUruguayUzbekistanVenezuelaVietnamWest IndiesWestern AfricaWestern AsiaWestern EuropeYemenZaireZimbabweAzores
Select to Compare
Race
Ancestry
AfghanAfricanAlaska NativeAlaskan AthabascanAlbanianAleutAlsatianAmericanApacheArabArapahoArgentineanArmenianAssyrian/Chaldean/SyriacAustralianAustrianBahamianBangladeshiBarbadianBasqueBelgianBelizeanBermudanBhutaneseBlackfeetBolivianBrazilianBritishBritish West IndianBulgarianBurmeseCajunCambodianCanadianCape VerdeanCarpatho RusynCelticCentral AmericanCentral American IndianCherokeeCheyenneChickasawChileanChineseChippewaChoctawColombianColvilleComancheCosta RicanCreeCreekCroatianCrowCubanCypriotCzechCzechoslovakianDanishDelawareDominicanDutchDutch West IndianEastern EuropeanEcuadorianEgyptianEnglishEstonianEthiopianEuropeanFijianFilipinoFinnishFrenchFrench American IndianFrench CanadianGermanGerman RussianGhanaianGreekGuamanian/ChamorroGuatemalanGuyaneseHaitianHmongHonduranHopiHoumaHungarianIcelanderIndian (Asian)IndonesianInupiatIranianIraqiIrishIroquoisIsraeliItalianJamaicanJapaneseJordanianKenyanKiowaKoreanLaotianLatvianLebaneseLiberianLithuanianLumbeeLuxembourgerMacedonianMalaysianMalteseMarshalleseMenomineeMexicanMexican American IndianMongolianMoroccanNative HawaiianNavajoNepaleseNew ZealanderNicaraguanNigerianNorthern EuropeanNorwegianOkinawanOsageOttawaPaiutePakistaniPalestinianPanamanianParaguayanPennsylvania GermanPeruvianPimaPolishPortuguesePotawatomiPuebloPuerto RicanPuget Sound SalishRomanianRussianSalvadoranSamoanScandinavianScotch-IrishScottishSeminoleSenegaleseSerbianShoshoneSierra LeoneanSiouxSlavicSlovakSloveneSomaliSouth AfricanSouth AmericanSouth American IndianSoviet UnionSpaniardSpanishSpanish AmericanSpanish American IndianSri LankanSubsaharan AfricanSudaneseSwedishSwissSyrianTaiwaneseThaiTlingit-HaidaTohono O'OdhamTonganTrinidadian and TobagonianTsimshianTurkishU.S. Virgin IslanderUgandanUkrainianUruguayanUteVenezuelanVietnameseWelshWest IndianYakamaYaquiYugoslavianYumanYup'ikZimbabwean
Immigration
NonimmigrantsImmigrantsAfghanistanAfricaAlbaniaArgentinaArmeniaAsiaAustraliaAustriaBahamasBangladeshBarbadosBelarusBelgiumBelizeBoliviaBosnia and HerzegovinaBrazilBulgariaBurma/MyanmarCabo VerdeCambodiaCameroonCanadaCaribbeanCentral AmericaChileChinaColombiaCongoCosta RicaCroatiaCubaCzechoslovakiaDenmarkDominicaDominican RepublicEastern AfricaEastern AsiaEastern EuropeEcuadorEgyptEl SalvadorEnglandEritreaEthiopiaEuropeFijiFranceGermanyGhanaGreeceGrenadaGuatemalaGuyanaHaitiHondurasHong KongHungaryIndiaIndonesiaIranIraqIrelandIsraelItalyJamaicaJapanJordanKazakhstanKenyaKoreaKuwaitLaosLatin AmericaLatviaLebanonLiberiaLithuaniaMalaysiaMexicoMicronesiaMiddle AfricaMoldovaMoroccoNepalNetherlandsNicaraguaNigeriaNorth AmericaNorth MacedoniaNorthern AfricaNorthern EuropeNorwayOceaniaPakistanPanamaPeruPhilippinesPolandPortugalRomaniaRussiaSaudi ArabiaScotlandSerbiaSierra LeoneSingaporeSomaliaSouth AfricaSouth AmericaSouth Central AsiaSouth Eastern AsiaSouthern EuropeSpainSri LankaSt. Vincent and the GrenadinesSudanSwedenSwitzerlandSyriaTaiwanThailandTrinidad and TobagoTurkeyUgandaUkraineUruguayUzbekistanVenezuelaVietnamWest IndiesWestern AfricaWestern AsiaWestern EuropeYemenZaireZimbabweAzores
GED/Equivalency
Income
Poverty
Unemployment
Labor Participation
Family Structure
Vehicle Availability
Education Level
Disability

Immigrants from Senegal GED/Equivalency
Tragic

83.8%
GED/EQUIVALENCY
1.2/ 100
METRIC RATING
245th/ 347
METRIC RANK

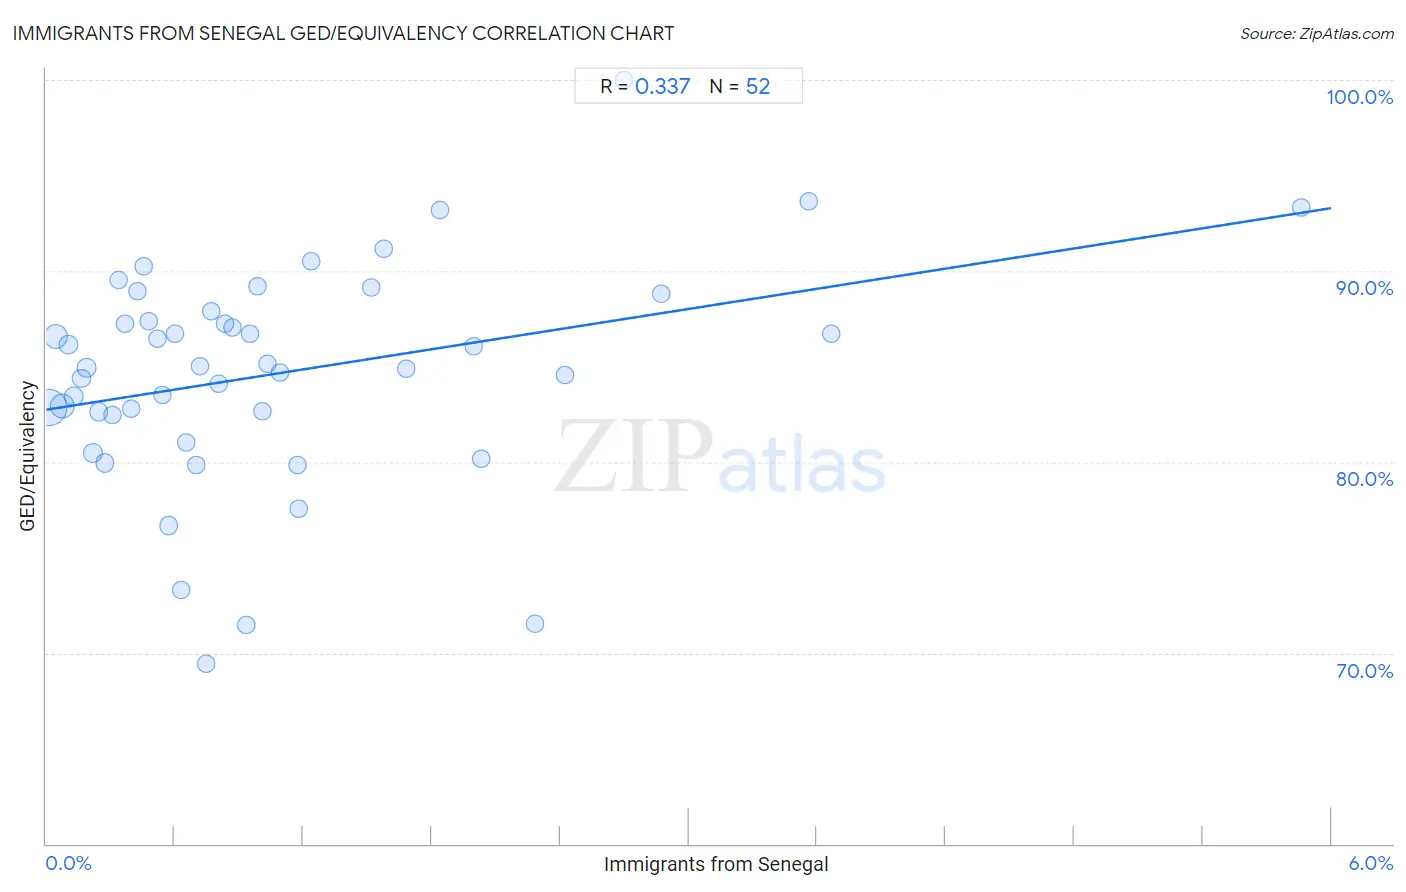
Immigrants from Senegal GED/Equivalency Correlation Chart

The statistical analysis conducted on geographies consisting of 90,130,297 people shows a mild positive correlation between the proportion of Immigrants from Senegal and percentage of population with at least ged/equivalency education in the United States with a correlation coefficient (R) of 0.337 and weighted average of 83.8%. On average, for every 1% (one percent) increase in Immigrants from Senegal within a typical geography, there is an increase of 1.8% in percentage of population with at least ged/equivalency education.
Immigrants from Senegal GED/Equivalency
It is essential to understand that the correlation between the percentage of Immigrants from Senegal and percentage of population with at least ged/equivalency education does not imply a direct cause-and-effect relationship. It remains uncertain whether the presence of Immigrants from Senegal influences an upward or downward trend in the level of percentage of population with at least ged/equivalency education within an area, or if Immigrants from Senegal simply ended up residing in those areas with higher or lower levels of percentage of population with at least ged/equivalency education due to other factors.

Demographics Similar to Immigrants from Senegal by GED/Equivalency

In terms of ged/equivalency, the demographic groups most similar to Immigrants from Senegal are Chickasaw (83.8%, a difference of 0.020%), Immigrants from Ghana (83.9%, a difference of 0.030%), Cherokee (83.9%, a difference of 0.040%), Immigrants from Western Africa (83.8%, a difference of 0.050%), and Blackfeet (83.8%, a difference of 0.070%).
DemographicsRating | RankGED/Equivalency
Immigrants from Peru
2.7
/100
|
#238
Tragic
84.2%
Immigrants from Bahamas
2.6
/100
|
#239
Tragic
84.2%
Immigrants from South Eastern Asia
2.5
/100
|
#240
Tragic
84.1%
Senegalese
1.9
/100
|
#241
Tragic
84.0%
Sri Lankans
1.9
/100
|
#242
Tragic
84.0%
Cherokee
1.3
/100
|
#243
Tragic
83.9%
Immigrants from Ghana
1.3
/100
|
#244
Tragic
83.9%
Immigrants from Senegal
1.2
/100
|
#245
Tragic
83.8%
Chickasaw
1.2
/100
|
#246
Tragic
83.8%
Immigrants from Western Africa
1.1
/100
|
#247
Tragic
83.8%
Blackfeet
1.1
/100
|
#248
Tragic
83.8%
Crow
1.1
/100
|
#249
Tragic
83.8%
Shoshone
1.0
/100
|
#250
Tragic
83.7%
Spanish Americans
0.8
/100
|
#251
Tragic
83.6%
Bahamians
0.8
/100
|
#252
Tragic
83.6%

Immigrants from Senegal GED/Equivalency Correlation Summary

MeasurementImmigrants from Senegal DataGED/Equivalency Data
Minimum0.0099%69.5%
Maximum5.9%100.0%
Range5.9%30.5%
Mean1.1%84.7%
Median0.76%85.0%
Interquartile 25% (IQ1)0.38%82.5%
Interquartile 75% (IQ3)1.4%87.6%
Interquartile Range (IQR)1.00%5.1%
Standard Deviation (Sample)1.1%5.8%
Standard Deviation (Population)1.1%5.7%

Correlation Details

Immigrants from Senegal PercentileSample SizeGED/Equivalency
[
0.0%
-
0.5%
]
0.0099%
44,150,96382.9%
[
0.0%
-
0.5%
]
0.045%
13,485,88986.6%
[
0.0%
-
0.5%
]
0.076%
15,782,15982.9%
[
0.0%
-
0.5%
]
0.10%
4,728,69686.1%
[
0.0%
-
0.5%
]
0.13%
2,642,53983.4%
[
0.0%
-
0.5%
]
0.16%
1,918,60384.4%
[
0.0%
-
0.5%
]
0.19%
1,441,70684.9%
[
0.0%
-
0.5%
]
0.22%
984,57880.5%
[
0.0%
-
0.5%
]
0.25%
367,83482.6%
[
0.0%
-
0.5%
]
0.27%
761,52179.9%
[
0.0%
-
0.5%
]
0.31%
255,89082.4%
[
0.0%
-
0.5%
]
0.34%
385,81489.5%
[
0.0%
-
0.5%
]
0.37%
290,41787.3%
[
0.0%
-
0.5%
]
0.40%
379,70182.8%
[
0.0%
-
0.5%
]
0.43%
189,98889.0%
[
0.0%
-
0.5%
]
0.45%
174,04190.2%
[
0.0%
-
0.5%
]
0.48%
146,08587.3%
[
0.5%
-
1.0%
]
0.52%
163,39986.4%
[
0.5%
-
1.0%
]
0.54%
262,27783.5%
[
0.5%
-
1.0%
]
0.57%
198,69576.7%
[
0.5%
-
1.0%
]
0.60%
124,77886.7%
[
0.5%
-
1.0%
]
0.63%
262,16373.3%
[
0.5%
-
1.0%
]
0.65%
119,30281.0%
[
0.5%
-
1.0%
]
0.70%
32,50479.8%
[
0.5%
-
1.0%
]
0.72%
154,23785.0%
[
0.5%
-
1.0%
]
0.75%
94,69269.5%
[
0.5%
-
1.0%
]
0.77%
36,44887.9%
[
0.5%
-
1.0%
]
0.80%
124,50484.1%
[
0.5%
-
1.0%
]
0.84%
10,52787.2%
[
0.5%
-
1.0%
]
0.87%
80,15987.1%
[
0.5%
-
1.0%
]
0.93%
5,88471.5%
[
0.5%
-
1.0%
]
0.95%
63,10486.7%
[
0.5%
-
1.0%
]
0.98%
18,09189.2%
[
1.0%
-
1.5%
]
1.01%
63,93882.7%
[
1.0%
-
1.5%
]
1.03%
16,07185.2%
[
1.0%
-
1.5%
]
1.09%
21,93784.7%
[
1.0%
-
1.5%
]
1.17%
53,01279.8%
[
1.0%
-
1.5%
]
1.18%
20,90377.5%
[
1.0%
-
1.5%
]
1.24%
38,23590.5%
[
1.5%
-
2.0%
]
1.52%
4,02489.1%
[
1.5%
-
2.0%
]
1.57%
19,06991.2%
[
1.5%
-
2.0%
]
1.68%
3,57584.9%
[
1.5%
-
2.0%
]
1.84%
8,25593.2%
[
1.5%
-
2.0%
]
2.00%
13,32386.1%
[
2.0%
-
2.5%
]
2.03%
3,49780.2%
[
2.0%
-
2.5%
]
2.28%
87671.5%
[
2.0%
-
2.5%
]
2.42%
10,99184.5%
[
2.5%
-
3.0%
]
2.69%
1,002100.0%
[
2.5%
-
3.0%
]
2.87%
4,49388.8%
[
3.5%
-
4.0%
]
3.56%
3,62293.6%
[
3.5%
-
4.0%
]
3.67%
1,93686.7%
[
5.5%
-
6.0%
]
5.86%
4,35093.3%