Cambodian 4 or more Vehicles in Household

COMPARE

Cambodian
Race
Ancestry
AfghanAfricanAlaska NativeAlaskan AthabascanAlbanianAleutAlsatianAmericanApacheArabArapahoArgentineanArmenianAssyrian/Chaldean/SyriacAustralianAustrianBahamianBangladeshiBarbadianBasqueBelgianBelizeanBermudanBhutaneseBlackfeetBolivianBrazilianBritishBritish West IndianBulgarianBurmeseCajunCambodianCanadianCape VerdeanCarpatho RusynCelticCentral AmericanCentral American IndianCherokeeCheyenneChickasawChileanChineseChippewaChoctawColombianColvilleComancheCosta RicanCreeCreekCroatianCrowCubanCypriotCzechCzechoslovakianDanishDelawareDominicanDutchDutch West IndianEastern EuropeanEcuadorianEgyptianEnglishEstonianEthiopianEuropeanFijianFilipinoFinnishFrenchFrench American IndianFrench CanadianGermanGerman RussianGhanaianGreekGuamanian/ChamorroGuatemalanGuyaneseHaitianHmongHonduranHopiHoumaHungarianIcelanderIndian (Asian)IndonesianInupiatIranianIraqiIrishIroquoisIsraeliItalianJamaicanJapaneseJordanianKenyanKiowaKoreanLaotianLatvianLebaneseLiberianLithuanianLumbeeLuxembourgerMacedonianMalaysianMalteseMarshalleseMenomineeMexicanMexican American IndianMongolianMoroccanNative HawaiianNavajoNepaleseNew ZealanderNicaraguanNigerianNorthern EuropeanNorwegianOkinawanOsageOttawaPaiutePakistaniPalestinianPanamanianParaguayanPennsylvania GermanPeruvianPimaPolishPortuguesePotawatomiPuebloPuerto RicanPuget Sound SalishRomanianRussianSalvadoranSamoanScandinavianScotch-IrishScottishSeminoleSenegaleseSerbianShoshoneSierra LeoneanSiouxSlavicSlovakSloveneSomaliSouth AfricanSouth AmericanSouth American IndianSoviet UnionSpaniardSpanishSpanish AmericanSpanish American IndianSri LankanSubsaharan AfricanSudaneseSwedishSwissSyrianTaiwaneseThaiTlingit-HaidaTohono O'OdhamTonganTrinidadian and TobagonianTsimshianTurkishU.S. Virgin IslanderUgandanUkrainianUruguayanUteVenezuelanVietnameseWelshWest IndianYakamaYaquiYugoslavianYumanYup'ikZimbabwean
Immigration
NonimmigrantsImmigrantsAfghanistanAfricaAlbaniaArgentinaArmeniaAsiaAustraliaAustriaBahamasBangladeshBarbadosBelarusBelgiumBelizeBoliviaBosnia and HerzegovinaBrazilBulgariaBurma/MyanmarCabo VerdeCambodiaCameroonCanadaCaribbeanCentral AmericaChileChinaColombiaCongoCosta RicaCroatiaCubaCzechoslovakiaDenmarkDominicaDominican RepublicEastern AfricaEastern AsiaEastern EuropeEcuadorEgyptEl SalvadorEnglandEritreaEthiopiaEuropeFijiFranceGermanyGhanaGreeceGrenadaGuatemalaGuyanaHaitiHondurasHong KongHungaryIndiaIndonesiaIranIraqIrelandIsraelItalyJamaicaJapanJordanKazakhstanKenyaKoreaKuwaitLaosLatin AmericaLatviaLebanonLiberiaLithuaniaMalaysiaMexicoMicronesiaMiddle AfricaMoldovaMoroccoNepalNetherlandsNicaraguaNigeriaNorth AmericaNorth MacedoniaNorthern AfricaNorthern EuropeNorwayOceaniaPakistanPanamaPeruPhilippinesPolandPortugalRomaniaRussiaSaudi ArabiaScotlandSenegalSerbiaSierra LeoneSingaporeSomaliaSouth AfricaSouth AmericaSouth Central AsiaSouth Eastern AsiaSouthern EuropeSpainSri LankaSt. Vincent and the GrenadinesSudanSwedenSwitzerlandSyriaTaiwanThailandTrinidad and TobagoTurkeyUgandaUkraineUruguayUzbekistanVenezuelaVietnamWest IndiesWestern AfricaWestern AsiaWestern EuropeYemenZaireZimbabweAzores
Select to Compare
Race
Ancestry
AfghanAfricanAlaska NativeAlaskan AthabascanAlbanianAleutAlsatianAmericanApacheArabArapahoArgentineanArmenianAssyrian/Chaldean/SyriacAustralianAustrianBahamianBangladeshiBarbadianBasqueBelgianBelizeanBermudanBhutaneseBlackfeetBolivianBrazilianBritishBritish West IndianBulgarianBurmeseCajunCanadianCape VerdeanCarpatho RusynCelticCentral AmericanCentral American IndianCherokeeCheyenneChickasawChileanChineseChippewaChoctawColombianColvilleComancheCosta RicanCreeCreekCroatianCrowCubanCypriotCzechCzechoslovakianDanishDelawareDominicanDutchDutch West IndianEastern EuropeanEcuadorianEgyptianEnglishEstonianEthiopianEuropeanFijianFilipinoFinnishFrenchFrench American IndianFrench CanadianGermanGerman RussianGhanaianGreekGuamanian/ChamorroGuatemalanGuyaneseHaitianHmongHonduranHopiHoumaHungarianIcelanderIndian (Asian)IndonesianInupiatIranianIraqiIrishIroquoisIsraeliItalianJamaicanJapaneseJordanianKenyanKiowaKoreanLaotianLatvianLebaneseLiberianLithuanianLumbeeLuxembourgerMacedonianMalaysianMalteseMarshalleseMenomineeMexicanMexican American IndianMongolianMoroccanNative HawaiianNavajoNepaleseNew ZealanderNicaraguanNigerianNorthern EuropeanNorwegianOkinawanOsageOttawaPaiutePakistaniPalestinianPanamanianParaguayanPennsylvania GermanPeruvianPimaPolishPortuguesePotawatomiPuebloPuerto RicanPuget Sound SalishRomanianRussianSalvadoranSamoanScandinavianScotch-IrishScottishSeminoleSenegaleseSerbianShoshoneSierra LeoneanSiouxSlavicSlovakSloveneSomaliSouth AfricanSouth AmericanSouth American IndianSoviet UnionSpaniardSpanishSpanish AmericanSpanish American IndianSri LankanSubsaharan AfricanSudaneseSwedishSwissSyrianTaiwaneseThaiTlingit-HaidaTohono O'OdhamTonganTrinidadian and TobagonianTsimshianTurkishU.S. Virgin IslanderUgandanUkrainianUruguayanUteVenezuelanVietnameseWelshWest IndianYakamaYaquiYugoslavianYumanYup'ikZimbabwean
Immigration
NonimmigrantsImmigrantsAfghanistanAfricaAlbaniaArgentinaArmeniaAsiaAustraliaAustriaBahamasBangladeshBarbadosBelarusBelgiumBelizeBoliviaBosnia and HerzegovinaBrazilBulgariaBurma/MyanmarCabo VerdeCambodiaCameroonCanadaCaribbeanCentral AmericaChileChinaColombiaCongoCosta RicaCroatiaCubaCzechoslovakiaDenmarkDominicaDominican RepublicEastern AfricaEastern AsiaEastern EuropeEcuadorEgyptEl SalvadorEnglandEritreaEthiopiaEuropeFijiFranceGermanyGhanaGreeceGrenadaGuatemalaGuyanaHaitiHondurasHong KongHungaryIndiaIndonesiaIranIraqIrelandIsraelItalyJamaicaJapanJordanKazakhstanKenyaKoreaKuwaitLaosLatin AmericaLatviaLebanonLiberiaLithuaniaMalaysiaMexicoMicronesiaMiddle AfricaMoldovaMoroccoNepalNetherlandsNicaraguaNigeriaNorth AmericaNorth MacedoniaNorthern AfricaNorthern EuropeNorwayOceaniaPakistanPanamaPeruPhilippinesPolandPortugalRomaniaRussiaSaudi ArabiaScotlandSenegalSerbiaSierra LeoneSingaporeSomaliaSouth AfricaSouth AmericaSouth Central AsiaSouth Eastern AsiaSouthern EuropeSpainSri LankaSt. Vincent and the GrenadinesSudanSwedenSwitzerlandSyriaTaiwanThailandTrinidad and TobagoTurkeyUgandaUkraineUruguayUzbekistanVenezuelaVietnamWest IndiesWestern AfricaWestern AsiaWestern EuropeYemenZaireZimbabweAzores
4 or more Vehicles in Household
Income
Poverty
Unemployment
Labor Participation
Family Structure
Vehicle Availability
Education Level
Disability

Cambodian 4 or more Vehicles in Household
Tragic

5.5%
4+ VEHICLES AVAILABLE
0.5/ 100
METRIC RATING
275th/ 347
METRIC RANK

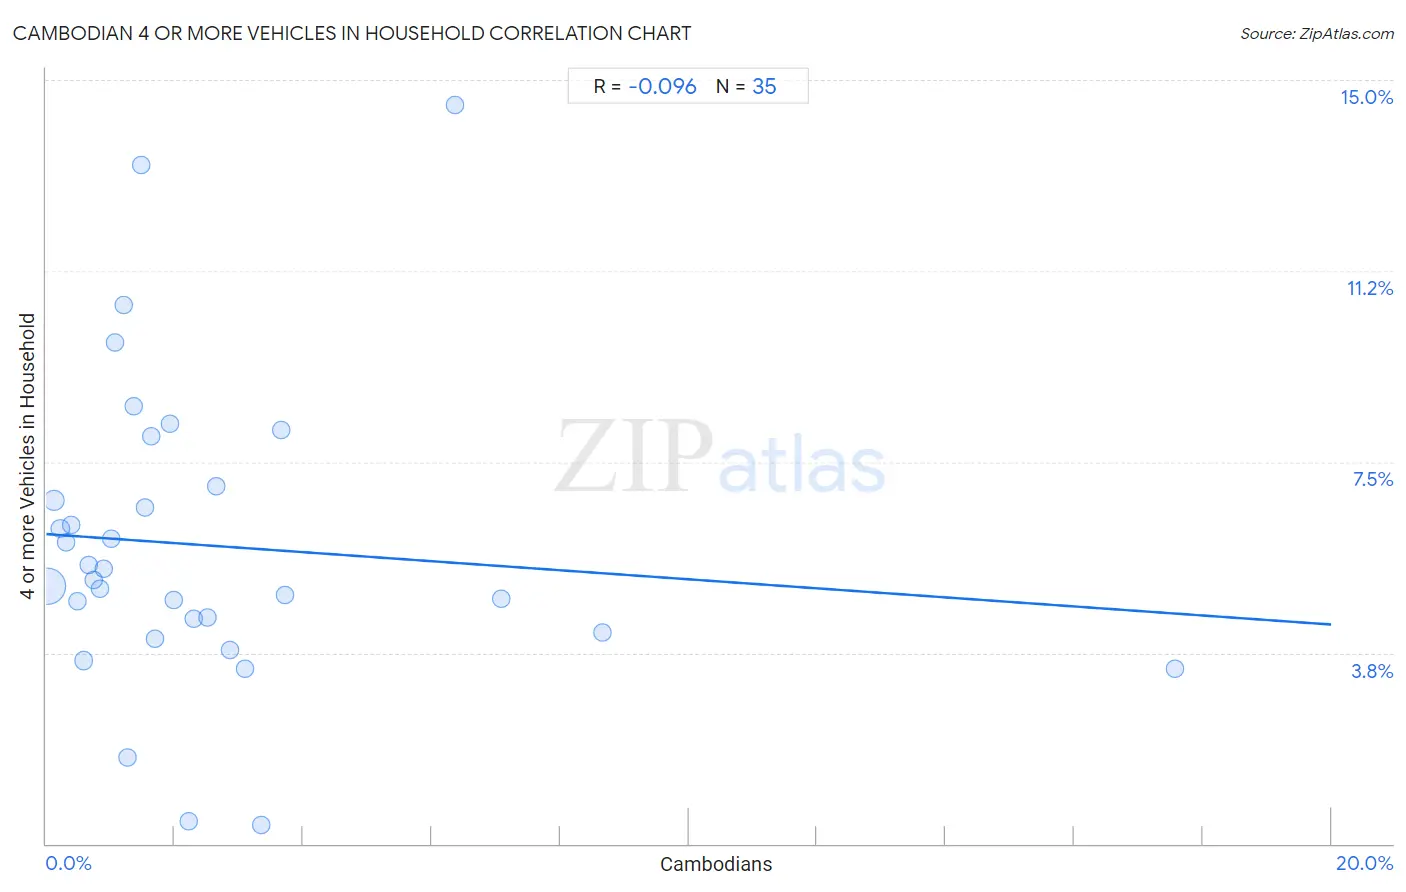
Cambodian 4 or more Vehicles in Household Correlation Chart

The statistical analysis conducted on geographies consisting of 102,385,573 people shows a slight negative correlation between the proportion of Cambodians and percentage of households with 4 or more vehicles available in the United States with a correlation coefficient (R) of -0.096 and weighted average of 5.5%. On average, for every 1% (one percent) increase in Cambodians within a typical geography, there is a decrease of 0.089% in percentage of households with 4 or more vehicles available.
Cambodian 4 or more Vehicles in Household
It is essential to understand that the correlation between the percentage of Cambodians and percentage of households with 4 or more vehicles available does not imply a direct cause-and-effect relationship. It remains uncertain whether the presence of Cambodians influences an upward or downward trend in the level of percentage of households with 4 or more vehicles available within an area, or if Cambodians simply ended up residing in those areas with higher or lower levels of percentage of households with 4 or more vehicles available due to other factors.

Demographics Similar to Cambodians by 4 or more Vehicles in Household

In terms of 4 or more vehicles in household, the demographic groups most similar to Cambodians are Immigrants from Latvia (5.5%, a difference of 0.010%), Black/African American (5.5%, a difference of 0.12%), Immigrants from Bulgaria (5.5%, a difference of 0.13%), Macedonian (5.5%, a difference of 0.24%), and Immigrants from Kazakhstan (5.5%, a difference of 0.27%).
DemographicsRating | Rank4 or more Vehicles in Household
Colombians
0.7
/100
|
#268
Tragic
5.5%
Carpatho Rusyns
0.7
/100
|
#269
Tragic
5.5%
Okinawans
0.6
/100
|
#270
Tragic
5.5%
Immigrants from Sudan
0.6
/100
|
#271
Tragic
5.5%
Immigrants from Kazakhstan
0.6
/100
|
#272
Tragic
5.5%
Macedonians
0.6
/100
|
#273
Tragic
5.5%
Blacks/African Americans
0.6
/100
|
#274
Tragic
5.5%
Cambodians
0.5
/100
|
#275
Tragic
5.5%
Immigrants from Latvia
0.5
/100
|
#276
Tragic
5.5%
Immigrants from Bulgaria
0.5
/100
|
#277
Tragic
5.5%
Immigrants from Eastern Europe
0.4
/100
|
#278
Tragic
5.4%
Immigrants from Uruguay
0.3
/100
|
#279
Tragic
5.4%
Alsatians
0.3
/100
|
#280
Tragic
5.4%
Immigrants from Western Africa
0.3
/100
|
#281
Tragic
5.4%
Immigrants from Spain
0.3
/100
|
#282
Tragic
5.4%

Cambodian 4 or more Vehicles in Household Correlation Summary

MeasurementCambodian Data4 or more Vehicles in Household Data
Minimum0.024%0.37%
Maximum17.6%14.5%
Range17.6%14.1%
Mean2.5%5.9%
Median1.5%5.2%
Interquartile 25% (IQ1)0.74%4.2%
Interquartile 75% (IQ3)2.9%7.0%
Interquartile Range (IQR)2.1%2.9%
Standard Deviation (Sample)3.3%3.0%
Standard Deviation (Population)3.2%3.0%

Correlation Details

Cambodian PercentileSample Size4 or more Vehicles in Household
[
0.0%
-
0.5%
]
0.024%
87,185,4845.1%
[
0.0%
-
0.5%
]
0.12%
8,296,8886.7%
[
0.0%
-
0.5%
]
0.22%
2,488,2766.2%
[
0.0%
-
0.5%
]
0.30%
1,482,3505.9%
[
0.0%
-
0.5%
]
0.38%
707,0656.3%
[
0.0%
-
0.5%
]
0.48%
385,8864.8%
[
0.5%
-
1.0%
]
0.59%
407,5373.6%
[
0.5%
-
1.0%
]
0.65%
411,3855.5%
[
0.5%
-
1.0%
]
0.74%
356,6325.2%
[
0.5%
-
1.0%
]
0.83%
180,5535.0%
[
0.5%
-
1.0%
]
0.90%
94,1305.4%
[
1.0%
-
1.5%
]
1.01%
140,0256.0%
[
1.0%
-
1.5%
]
1.07%
53,8829.8%
[
1.0%
-
1.5%
]
1.21%
7,53110.6%
[
1.0%
-
1.5%
]
1.26%
43,3761.7%
[
1.0%
-
1.5%
]
1.36%
8,8998.6%
[
1.0%
-
1.5%
]
1.48%
1,69213.3%
[
1.5%
-
2.0%
]
1.54%
8456.6%
[
1.5%
-
2.0%
]
1.64%
6,7718.0%
[
1.5%
-
2.0%
]
1.68%
4754.0%
[
1.5%
-
2.0%
]
1.93%
1,7088.3%
[
1.5%
-
2.0%
]
1.99%
2,3674.8%
[
2.0%
-
2.5%
]
2.23%
38,4000.44%
[
2.0%
-
2.5%
]
2.30%
25,3744.4%
[
2.5%
-
3.0%
]
2.51%
41,0584.4%
[
2.5%
-
3.0%
]
2.65%
2,7167.0%
[
2.5%
-
3.0%
]
2.86%
3,5713.8%
[
3.0%
-
3.5%
]
3.10%
2,9333.4%
[
3.0%
-
3.5%
]
3.35%
1,6700.37%
[
3.5%
-
4.0%
]
3.65%
2,0288.1%
[
3.5%
-
4.0%
]
3.71%
6744.9%
[
6.0%
-
6.5%
]
6.37%
58114.5%
[
7.0%
-
7.5%
]
7.09%
1,4114.8%
[
8.5%
-
9.0%
]
8.66%
8314.2%
[
17.5%
-
18.0%
]
17.57%
5693.4%