Cities with the Highest Percentage of Population Employed in Educational Services in Utah
RELATED REPORTS & OPTIONS
Educational Services
Utah
Compare Cities
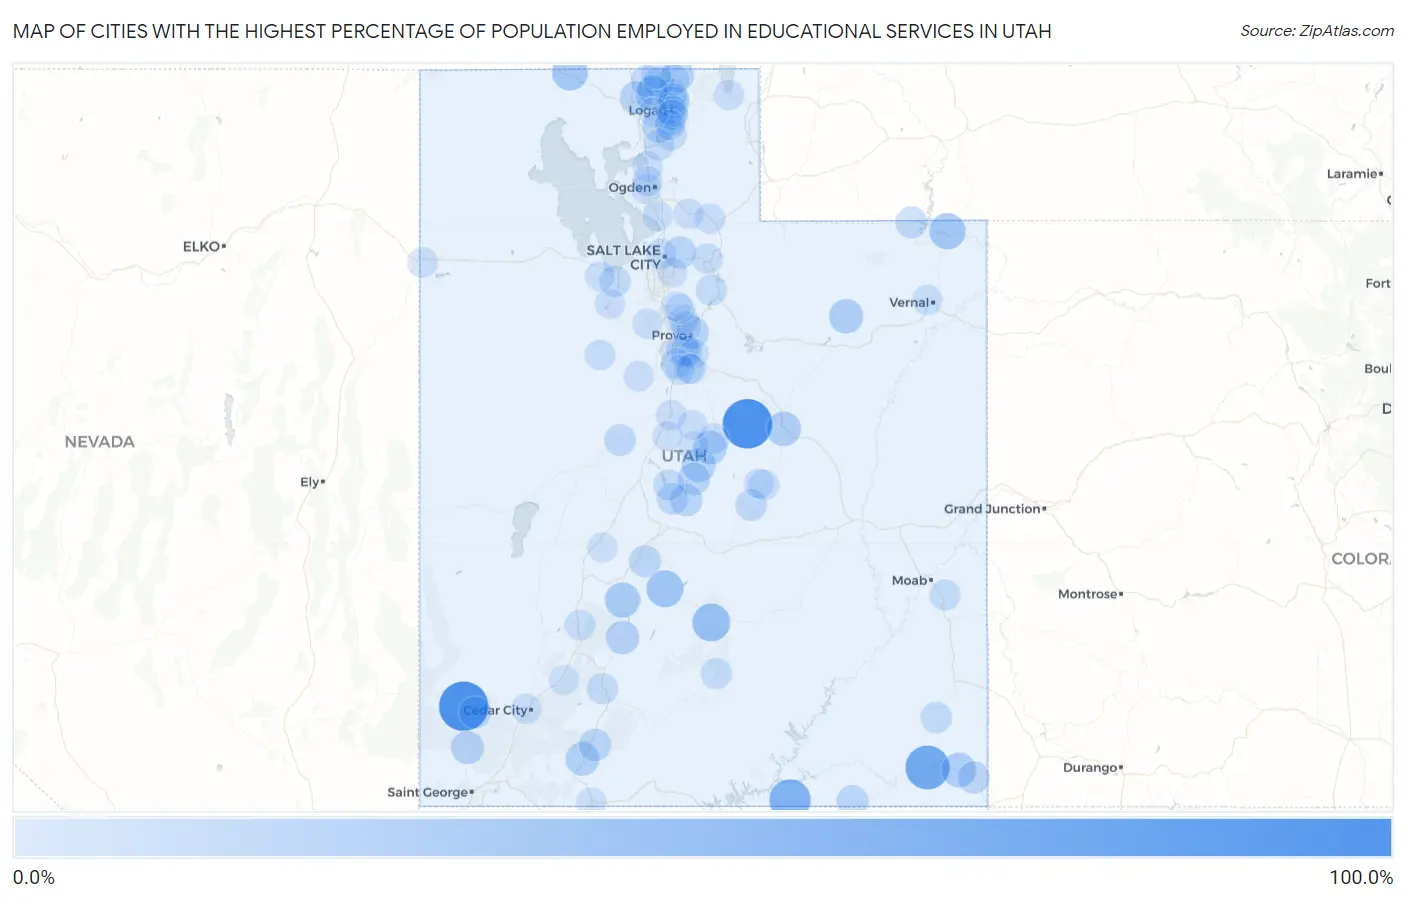
Map of Cities with the Highest Percentage of Population Employed in Educational Services in Utah
0.0%
100.0%
Cities with the Highest Percentage of Population Employed in Educational Services in Utah
| City | % Employed | vs State | vs National | |
| 1. | Clear Creek | 100.0% | 10.8%(+89.2)#1 | 9.3%(+90.7)#28 |
| 2. | Beryl Junction | 100.0% | 10.8%(+89.2)#2 | 9.3%(+90.7)#29 |
| 3. | Bluff | 74.1% | 10.8%(+63.3)#3 | 9.3%(+64.8)#59 |
| 4. | Navajo Mountain | 62.3% | 10.8%(+51.6)#4 | 9.3%(+53.0)#102 |
| 5. | Teasdale | 45.9% | 10.8%(+35.2)#5 | 9.3%(+36.6)#272 |
| 6. | Koosharem | 41.9% | 10.8%(+31.1)#6 | 9.3%(+32.6)#355 |
| 7. | Dutch John | 38.5% | 10.8%(+27.7)#7 | 9.3%(+29.1)#434 |
| 8. | Snowville | 37.3% | 10.8%(+26.5)#8 | 9.3%(+28.0)#470 |
| 9. | Marysvale | 34.2% | 10.8%(+23.4)#9 | 9.3%(+24.8)#611 |
| 10. | Montezuma Creek | 31.3% | 10.8%(+20.6)#10 | 9.3%(+22.0)#739 |
| 11. | West Wood | 31.1% | 10.8%(+20.3)#11 | 9.3%(+21.7)#761 |
| 12. | Altamont | 30.6% | 10.8%(+19.8)#12 | 9.3%(+21.3)#791 |
| 13. | Cache | 30.4% | 10.8%(+19.7)#13 | 9.3%(+21.1)#800 |
| 14. | Ephraim | 28.8% | 10.8%(+18.0)#14 | 9.3%(+19.5)#900 |
| 15. | Glendale | 28.3% | 10.8%(+17.5)#15 | 9.3%(+19.0)#946 |
| 16. | Spring City | 28.2% | 10.8%(+17.5)#16 | 9.3%(+18.9)#952 |
| 17. | Circleville | 26.4% | 10.8%(+15.7)#17 | 9.3%(+17.1)#1,102 |
| 18. | Central | 25.1% | 10.8%(+14.3)#18 | 9.3%(+15.8)#1,235 |
| 19. | Cove | 24.7% | 10.8%(+13.9)#19 | 9.3%(+15.4)#1,284 |
| 20. | Wellsville | 23.7% | 10.8%(+13.0)#20 | 9.3%(+14.4)#1,414 |
| 21. | Riverside | 23.5% | 10.8%(+12.7)#21 | 9.3%(+14.2)#1,451 |
| 22. | Provo | 23.0% | 10.8%(+12.2)#22 | 9.3%(+13.7)#1,532 |
| 23. | Lake Shore | 22.7% | 10.8%(+12.0)#23 | 9.3%(+13.4)#1,565 |
| 24. | Emigration Canyon | 22.6% | 10.8%(+11.9)#24 | 9.3%(+13.3)#1,581 |
| 25. | Alton | 22.5% | 10.8%(+11.8)#25 | 9.3%(+13.2)#1,604 |
| 26. | Manti | 22.4% | 10.8%(+11.7)#26 | 9.3%(+13.1)#1,630 |
| 27. | Mayfield | 22.3% | 10.8%(+11.5)#27 | 9.3%(+13.0)#1,640 |
| 28. | Aneth | 21.2% | 10.8%(+10.4)#28 | 9.3%(+11.9)#1,833 |
| 29. | Newcastle | 20.7% | 10.8%(+9.93)#29 | 9.3%(+11.4)#1,961 |
| 30. | Oljato Monument Valley | 20.5% | 10.8%(+9.71)#30 | 9.3%(+11.2)#2,009 |
| 31. | Annabella | 20.3% | 10.8%(+9.55)#31 | 9.3%(+11.0)#2,048 |
| 32. | Manila | 19.9% | 10.8%(+9.10)#32 | 9.3%(+10.5)#2,161 |
| 33. | Leamington | 19.0% | 10.8%(+8.29)#33 | 9.3%(+9.73)#2,371 |
| 34. | Centerfield | 18.8% | 10.8%(+8.05)#34 | 9.3%(+9.50)#2,451 |
| 35. | Ferron | 18.6% | 10.8%(+7.84)#35 | 9.3%(+9.28)#2,529 |
| 36. | Palmyra | 18.4% | 10.8%(+7.64)#36 | 9.3%(+9.08)#2,603 |
| 37. | Blanding | 17.7% | 10.8%(+6.97)#37 | 9.3%(+8.42)#2,851 |
| 38. | East Basin | 17.4% | 10.8%(+6.68)#38 | 9.3%(+8.12)#2,969 |
| 39. | Panguitch | 17.4% | 10.8%(+6.64)#39 | 9.3%(+8.08)#2,978 |
| 40. | Erda | 17.3% | 10.8%(+6.54)#40 | 9.3%(+7.98)#3,037 |
| 41. | North Logan | 17.3% | 10.8%(+6.51)#41 | 9.3%(+7.95)#3,050 |
| 42. | Clarkston | 17.3% | 10.8%(+6.49)#42 | 9.3%(+7.94)#3,058 |
| 43. | Boulder | 16.8% | 10.8%(+6.06)#43 | 9.3%(+7.50)#3,262 |
| 44. | Nibley | 16.7% | 10.8%(+5.93)#44 | 9.3%(+7.37)#3,312 |
| 45. | Hobble Creek | 16.7% | 10.8%(+5.91)#45 | 9.3%(+7.35)#3,342 |
| 46. | Smithfield | 16.6% | 10.8%(+5.86)#46 | 9.3%(+7.30)#3,395 |
| 47. | West Mountain | 16.4% | 10.8%(+5.65)#47 | 9.3%(+7.09)#3,489 |
| 48. | Interlaken | 16.4% | 10.8%(+5.61)#48 | 9.3%(+7.05)#3,509 |
| 49. | Spanish Valley | 16.3% | 10.8%(+5.49)#49 | 9.3%(+6.94)#3,570 |
| 50. | Fayette | 16.3% | 10.8%(+5.49)#50 | 9.3%(+6.93)#3,573 |
| 51. | Richmond | 16.1% | 10.8%(+5.34)#51 | 9.3%(+6.79)#3,661 |
| 52. | Trenton | 16.0% | 10.8%(+5.24)#52 | 9.3%(+6.68)#3,713 |
| 53. | Paradise | 15.7% | 10.8%(+4.95)#53 | 9.3%(+6.39)#3,875 |
| 54. | Logan | 15.7% | 10.8%(+4.92)#54 | 9.3%(+6.36)#3,892 |
| 55. | Castle Dale | 15.6% | 10.8%(+4.79)#55 | 9.3%(+6.23)#3,972 |
| 56. | Mount Pleasant | 15.5% | 10.8%(+4.76)#56 | 9.3%(+6.20)#3,990 |
| 57. | River Heights | 15.5% | 10.8%(+4.76)#57 | 9.3%(+6.20)#3,992 |
| 58. | Hyde Park | 15.5% | 10.8%(+4.73)#58 | 9.3%(+6.18)#4,002 |
| 59. | Mantua | 15.4% | 10.8%(+4.64)#59 | 9.3%(+6.08)#4,060 |
| 60. | Providence | 15.2% | 10.8%(+4.44)#60 | 9.3%(+5.88)#4,185 |
| 61. | Silver Summit | 14.7% | 10.8%(+3.99)#61 | 9.3%(+5.43)#4,477 |
| 62. | Beaver | 14.6% | 10.8%(+3.86)#62 | 9.3%(+5.30)#4,576 |
| 63. | Vernon | 14.5% | 10.8%(+3.70)#63 | 9.3%(+5.14)#4,708 |
| 64. | Wendover | 14.1% | 10.8%(+3.30)#64 | 9.3%(+4.74)#5,050 |
| 65. | Salt Lake City | 14.0% | 10.8%(+3.25)#65 | 9.3%(+4.70)#5,102 |
| 66. | South Willard | 14.0% | 10.8%(+3.25)#66 | 9.3%(+4.69)#5,109 |
| 67. | Lindon | 14.0% | 10.8%(+3.24)#67 | 9.3%(+4.69)#5,116 |
| 68. | Maeser | 13.9% | 10.8%(+3.14)#68 | 9.3%(+4.58)#5,196 |
| 69. | White | 13.8% | 10.8%(+3.05)#69 | 9.3%(+4.49)#5,274 |
| 70. | Henefer | 13.8% | 10.8%(+3.00)#70 | 9.3%(+4.44)#5,314 |
| 71. | Nephi | 13.7% | 10.8%(+2.94)#71 | 9.3%(+4.38)#5,358 |
| 72. | Spanish Fork | 13.6% | 10.8%(+2.80)#72 | 9.3%(+4.25)#5,480 |
| 73. | Eureka | 13.5% | 10.8%(+2.71)#73 | 9.3%(+4.15)#5,552 |
| 74. | Laketown | 13.5% | 10.8%(+2.70)#74 | 9.3%(+4.15)#5,556 |
| 75. | West Haven | 13.3% | 10.8%(+2.59)#75 | 9.3%(+4.03)#5,649 |
| 76. | Orem | 13.1% | 10.8%(+2.37)#76 | 9.3%(+3.82)#5,883 |
| 77. | Kaysville | 13.1% | 10.8%(+2.31)#77 | 9.3%(+3.75)#5,938 |
| 78. | Marriott Slaterville | 13.0% | 10.8%(+2.28)#78 | 9.3%(+3.72)#5,983 |
| 79. | Cedar City | 13.0% | 10.8%(+2.25)#79 | 9.3%(+3.69)#6,010 |
| 80. | Eagle Mountain | 13.0% | 10.8%(+2.22)#80 | 9.3%(+3.66)#6,038 |
| 81. | Morgan | 12.9% | 10.8%(+2.18)#81 | 9.3%(+3.63)#6,081 |
| 82. | Stockton | 12.9% | 10.8%(+2.17)#82 | 9.3%(+3.62)#6,095 |
| 83. | Newton | 12.8% | 10.8%(+2.07)#83 | 9.3%(+3.52)#6,204 |
| 84. | Hyrum | 12.8% | 10.8%(+2.00)#84 | 9.3%(+3.45)#6,263 |
| 85. | Elk Ridge | 12.7% | 10.8%(+1.97)#85 | 9.3%(+3.42)#6,291 |
| 86. | Orangeville | 12.6% | 10.8%(+1.80)#86 | 9.3%(+3.25)#6,464 |
| 87. | Spring Lake | 12.6% | 10.8%(+1.79)#87 | 9.3%(+3.24)#6,477 |
| 88. | Wales | 12.5% | 10.8%(+1.74)#88 | 9.3%(+3.18)#6,542 |
| 89. | Kanab | 12.5% | 10.8%(+1.69)#89 | 9.3%(+3.14)#6,620 |
| 90. | Woodland Hills | 12.4% | 10.8%(+1.66)#90 | 9.3%(+3.10)#6,663 |
| 91. | Kanosh | 12.4% | 10.8%(+1.61)#91 | 9.3%(+3.05)#6,706 |
| 92. | Highland | 12.3% | 10.8%(+1.59)#92 | 9.3%(+3.03)#6,728 |
| 93. | Mendon | 12.3% | 10.8%(+1.53)#93 | 9.3%(+2.97)#6,806 |
| 94. | Levan | 12.3% | 10.8%(+1.50)#94 | 9.3%(+2.94)#6,843 |
| 95. | Cornish | 12.2% | 10.8%(+1.42)#95 | 9.3%(+2.86)#6,946 |
| 96. | Paragonah | 12.1% | 10.8%(+1.39)#96 | 9.3%(+2.83)#6,982 |
| 97. | Holladay | 12.1% | 10.8%(+1.34)#97 | 9.3%(+2.79)#7,042 |
| 98. | Cedar Hills | 12.1% | 10.8%(+1.33)#98 | 9.3%(+2.77)#7,067 |
| 99. | Grantsville | 12.0% | 10.8%(+1.26)#99 | 9.3%(+2.70)#7,155 |
| 100. | Fountain Green | 11.9% | 10.8%(+1.19)#100 | 9.3%(+2.63)#7,249 |
Common Questions
What are the Top 10 Cities with the Highest Percentage of Population Employed in Educational Services in Utah?
Top 10 Cities with the Highest Percentage of Population Employed in Educational Services in Utah are:
#1
100.0%
#2
100.0%
#3
74.1%
#4
62.3%
#5
45.9%
#6
41.9%
#7
38.5%
#8
37.3%
#9
34.2%
#10
31.3%
What city has the Highest Percentage of Population Employed in Educational Services in Utah?
Clear Creek has the Highest Percentage of Population Employed in Educational Services in Utah with 100.0%.
What is the Percentage of Population Employed in Educational Services in the State of Utah?
Percentage of Population Employed in Educational Services in Utah is 10.8%.
What is the Percentage of Population Employed in Educational Services in the United States?
Percentage of Population Employed in Educational Services in the United States is 9.3%.