Cities with the Highest Percentage of Immigrants from Ghana in New York
RELATED REPORTS & OPTIONS
Ghana
New York
Compare Cities
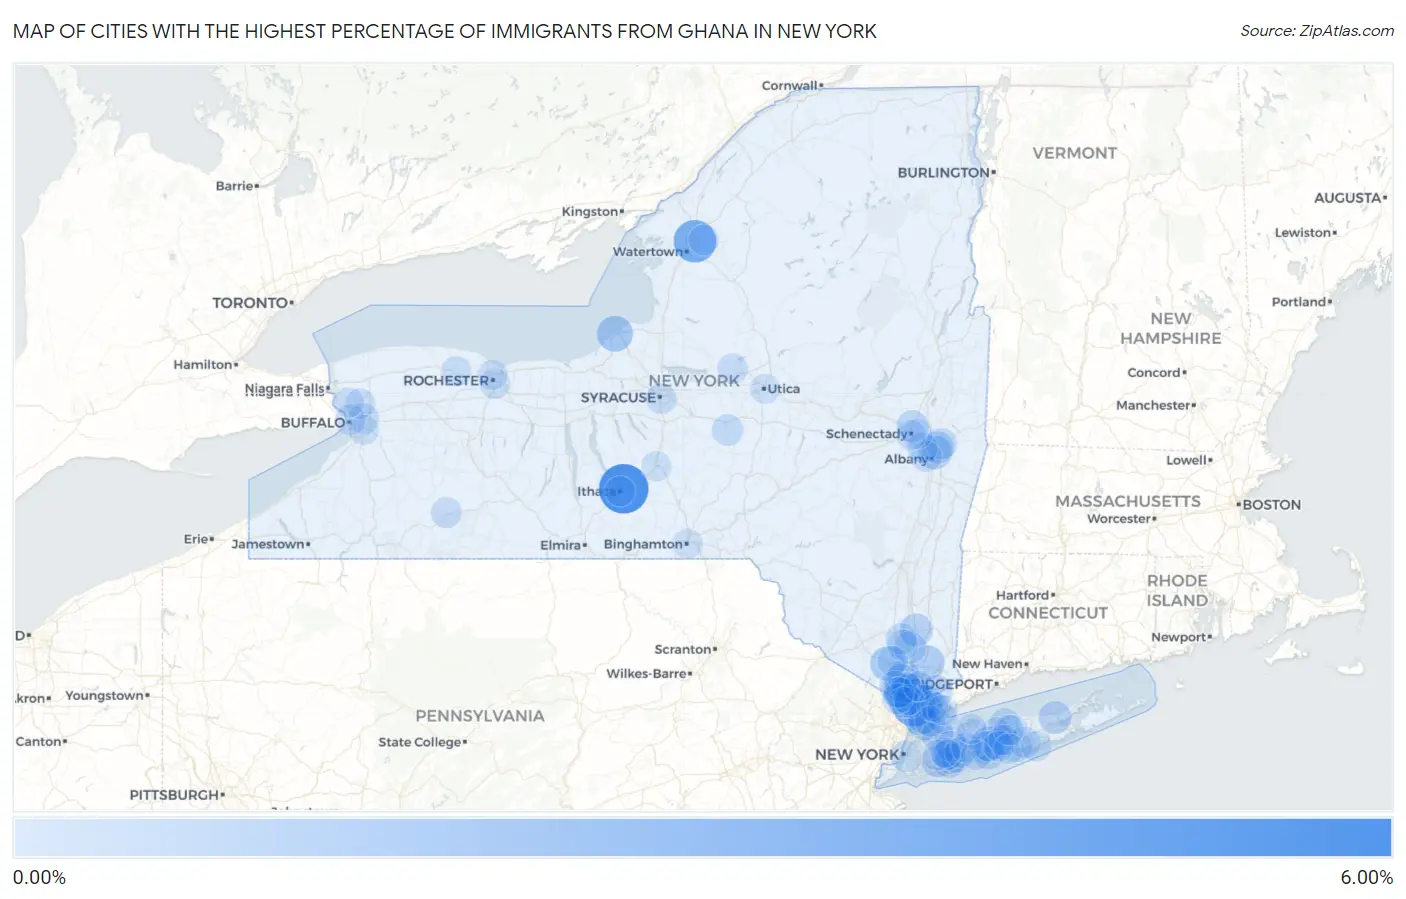
Map of Cities with the Highest Percentage of Immigrants from Ghana in New York
0.00%
6.00%
Cities with the Highest Percentage of Immigrants from Ghana in New York
| City | Ghana | vs State | vs National | |
| 1. | Forest Home | 5.69% | 0.20%(+5.50)#-1 | 0.061%(+5.63)#0 |
| 2. | Piermont | 3.79% | 0.20%(+3.59)#0 | 0.061%(+3.73)#1 |
| 3. | Calcium | 3.59% | 0.20%(+3.39)#1 | 0.061%(+3.53)#2 |
| 4. | Grahamsville | 3.51% | 0.20%(+3.32)#2 | 0.061%(+3.45)#3 |
| 5. | Valley Cottage | 2.02% | 0.20%(+1.82)#3 | 0.061%(+1.96)#4 |
| 6. | Suny Oswego | 1.65% | 0.20%(+1.45)#4 | 0.061%(+1.59)#5 |
| 7. | Elmsford | 1.48% | 0.20%(+1.29)#5 | 0.061%(+1.42)#6 |
| 8. | Hillcrest | 1.39% | 0.20%(+1.20)#6 | 0.061%(+1.33)#7 |
| 9. | Hartwick Seminary | 1.37% | 0.20%(+1.18)#7 | 0.061%(+1.31)#8 |
| 10. | Harriman | 1.29% | 0.20%(+1.09)#8 | 0.061%(+1.23)#9 |
| 11. | Brentwood | 1.25% | 0.20%(+1.05)#9 | 0.061%(+1.19)#10 |
| 12. | Jefferson Valley Yorktown | 1.12% | 0.20%(+0.927)#10 | 0.061%(+1.06)#11 |
| 13. | Nanuet | 1.00% | 0.20%(+0.805)#11 | 0.061%(+0.940)#12 |
| 14. | Menands | 0.98% | 0.20%(+0.780)#12 | 0.061%(+0.914)#13 |
| 15. | Mount Ivy | 0.92% | 0.20%(+0.723)#13 | 0.061%(+0.858)#14 |
| 16. | Fishkill | 0.87% | 0.20%(+0.677)#14 | 0.061%(+0.812)#15 |
| 17. | Mount Vernon | 0.83% | 0.20%(+0.636)#15 | 0.061%(+0.770)#16 |
| 18. | Yonkers | 0.80% | 0.20%(+0.603)#32 | 0.061%(+0.738)#465 |
| 19. | Riverhead | 0.72% | 0.20%(+0.527)#33 | 0.061%(+0.662)#466 |
| 20. | Stony Point | 0.65% | 0.20%(+0.459)#34 | 0.061%(+0.593)#467 |
| 21. | Armonk | 0.64% | 0.20%(+0.444)#35 | 0.061%(+0.579)#468 |
| 22. | Tuckahoe | 0.60% | 0.20%(+0.405)#36 | 0.061%(+0.539)#469 |
| 23. | Cold Spring | 0.60% | 0.20%(+0.401)#37 | 0.061%(+0.536)#470 |
| 24. | Watervliet | 0.57% | 0.20%(+0.376)#38 | 0.061%(+0.510)#471 |
| 25. | Old Westbury | 0.57% | 0.20%(+0.372)#39 | 0.061%(+0.506)#472 |
| 26. | Manorhaven | 0.56% | 0.20%(+0.368)#40 | 0.061%(+0.502)#473 |
| 27. | East Glenville | 0.55% | 0.20%(+0.354)#41 | 0.061%(+0.488)#474 |
| 28. | Valley Stream | 0.55% | 0.20%(+0.353)#42 | 0.061%(+0.488)#475 |
| 29. | Baywood | 0.49% | 0.20%(+0.292)#43 | 0.061%(+0.426)#476 |
| 30. | Patchogue | 0.41% | 0.20%(+0.218)#44 | 0.061%(+0.352)#477 |
| 31. | Brightwaters | 0.38% | 0.20%(+0.182)#45 | 0.061%(+0.316)#478 |
| 32. | Troy | 0.38% | 0.20%(+0.181)#46 | 0.061%(+0.316)#479 |
| 33. | New Windsor | 0.38% | 0.20%(+0.180)#47 | 0.061%(+0.315)#480 |
| 34. | North Bellport | 0.36% | 0.20%(+0.166)#48 | 0.061%(+0.300)#481 |
| 35. | Hamilton | 0.36% | 0.20%(+0.165)#49 | 0.061%(+0.300)#482 |
| 36. | New York | 0.36% | 0.20%(+0.160)#50 | 0.061%(+0.294)#483 |
| 37. | Stony Brook University | 0.34% | 0.20%(+0.147)#51 | 0.061%(+0.282)#484 |
| 38. | Islandia | 0.34% | 0.20%(+0.141)#52 | 0.061%(+0.275)#485 |
| 39. | Baldwin | 0.27% | 0.20%(+0.074)#53 | 0.061%(+0.208)#486 |
| 40. | Wesley Hills | 0.24% | 0.20%(+0.050)#54 | 0.061%(+0.184)#487 |
| 41. | Cornwall On Hudson | 0.23% | 0.20%(+0.035)#55 | 0.061%(+0.169)#488 |
| 42. | Albany | 0.22% | 0.20%(+0.028)#56 | 0.061%(+0.163)#489 |
| 43. | Uniondale | 0.20% | 0.20%(+0.007)#57 | 0.061%(+0.141)#490 |
| 44. | Rye | 0.19% | 0.20%(-0.001)#58 | 0.061%(+0.134)#491 |
| 45. | Syracuse | 0.19% | 0.20%(-0.006)#59 | 0.061%(+0.129)#492 |
| 46. | Cheektowaga | 0.18% | 0.20%(-0.020)#60 | 0.061%(+0.114)#493 |
| 47. | Orangeburg | 0.17% | 0.20%(-0.027)#61 | 0.061%(+0.108)#494 |
| 48. | Roosevelt | 0.17% | 0.20%(-0.029)#62 | 0.061%(+0.105)#495 |
| 49. | North Bellmore | 0.17% | 0.20%(-0.029)#63 | 0.061%(+0.105)#496 |
| 50. | New City | 0.16% | 0.20%(-0.033)#64 | 0.061%(+0.102)#497 |
| 51. | Angelica | 0.16% | 0.20%(-0.035)#65 | 0.061%(+0.099)#498 |
| 52. | New Rochelle | 0.16% | 0.20%(-0.037)#66 | 0.061%(+0.097)#499 |
| 53. | Huntington Station | 0.16% | 0.20%(-0.039)#67 | 0.061%(+0.095)#500 |
| 54. | Colonie | 0.15% | 0.20%(-0.041)#68 | 0.061%(+0.094)#501 |
| 55. | Pearl River | 0.15% | 0.20%(-0.049)#69 | 0.061%(+0.085)#502 |
| 56. | Chestnut Ridge | 0.15% | 0.20%(-0.050)#70 | 0.061%(+0.084)#503 |
| 57. | Rome | 0.13% | 0.20%(-0.061)#71 | 0.061%(+0.073)#504 |
| 58. | Woodbury | 0.12% | 0.20%(-0.072)#72 | 0.061%(+0.062)#505 |
| 59. | White Plains | 0.12% | 0.20%(-0.076)#73 | 0.061%(+0.059)#506 |
| 60. | Village Of The Branch | 0.11% | 0.20%(-0.081)#74 | 0.061%(+0.054)#507 |
| 61. | Westbury | 0.11% | 0.20%(-0.081)#75 | 0.061%(+0.053)#508 |
| 62. | Central Islip | 0.11% | 0.20%(-0.083)#76 | 0.061%(+0.051)#509 |
| 63. | Brighton | 0.11% | 0.20%(-0.087)#77 | 0.061%(+0.048)#510 |
| 64. | Elmont | 0.10% | 0.20%(-0.092)#78 | 0.061%(+0.042)#511 |
| 65. | Fort Drum | 0.098% | 0.20%(-0.097)#79 | 0.061%(+0.037)#512 |
| 66. | Blauvelt | 0.097% | 0.20%(-0.098)#80 | 0.061%(+0.036)#513 |
| 67. | Buffalo | 0.095% | 0.20%(-0.100)#81 | 0.061%(+0.034)#514 |
| 68. | Ithaca | 0.092% | 0.20%(-0.103)#82 | 0.061%(+0.032)#515 |
| 69. | Spring Valley | 0.091% | 0.20%(-0.104)#83 | 0.061%(+0.030)#516 |
| 70. | Ossining | 0.085% | 0.20%(-0.110)#84 | 0.061%(+0.024)#517 |
| 71. | University At Buffalo | 0.081% | 0.20%(-0.115)#85 | 0.061%(+0.020)#518 |
| 72. | Hempstead | 0.079% | 0.20%(-0.117)#86 | 0.061%(+0.018)#519 |
| 73. | North Bay Shore | 0.071% | 0.20%(-0.125)#87 | 0.061%(+0.010)#520 |
| 74. | Brockport | 0.070% | 0.20%(-0.126)#88 | 0.061%(+0.009)#521 |
| 75. | Levittown | 0.065% | 0.20%(-0.130)#89 | 0.061%(+0.004)#522 |
| 76. | Selden | 0.060% | 0.20%(-0.136)#90 | 0.061%(-0.001)#523 |
| 77. | Old Bethpage | 0.052% | 0.20%(-0.143)#91 | 0.061%(-0.009)#524 |
| 78. | Cortland | 0.040% | 0.20%(-0.156)#92 | 0.061%(-0.021)#525 |
| 79. | West Babylon | 0.040% | 0.20%(-0.156)#93 | 0.061%(-0.021)#526 |
| 80. | Rochester | 0.038% | 0.20%(-0.157)#94 | 0.061%(-0.023)#527 |
| 81. | Tonawanda | 0.037% | 0.20%(-0.159)#95 | 0.061%(-0.024)#528 |
| 82. | Garden City | 0.035% | 0.20%(-0.160)#96 | 0.061%(-0.026)#529 |
| 83. | Ronkonkoma | 0.032% | 0.20%(-0.163)#97 | 0.061%(-0.029)#530 |
| 84. | North Great River | 0.027% | 0.20%(-0.168)#98 | 0.061%(-0.034)#531 |
| 85. | Niskayuna | 0.024% | 0.20%(-0.171)#99 | 0.061%(-0.037)#532 |
| 86. | Binghamton | 0.023% | 0.20%(-0.172)#100 | 0.061%(-0.038)#533 |
| 87. | Harrison | 0.021% | 0.20%(-0.174)#101 | 0.061%(-0.040)#534 |
| 88. | Huntington | 0.020% | 0.20%(-0.175)#102 | 0.061%(-0.041)#535 |
| 89. | West Seneca | 0.015% | 0.20%(-0.180)#103 | 0.061%(-0.046)#536 |
| 90. | Schenectady | 0.012% | 0.20%(-0.184)#104 | 0.061%(-0.049)#537 |
| 91. | Centereach | 0.0094% | 0.20%(-0.186)#105 | 0.061%(-0.052)#538 |
| 92. | Port Chester | 0.0064% | 0.20%(-0.189)#106 | 0.061%(-0.055)#539 |
| 93. | Sayville | 0.0062% | 0.20%(-0.189)#107 | 0.061%(-0.055)#540 |
| 94. | Mastic Beach | 0.0062% | 0.20%(-0.189)#108 | 0.061%(-0.055)#541 |
| 95. | Utica | 0.0046% | 0.20%(-0.191)#109 | 0.061%(-0.056)#542 |
Common Questions
What are the Top 10 Cities with the Highest Percentage of Immigrants from Ghana in New York?
Top 10 Cities with the Highest Percentage of Immigrants from Ghana in New York are:
#1
5.69%
#2
3.79%
#3
3.59%
#4
2.02%
#5
1.65%
#6
1.48%
#7
1.39%
#8
1.29%
#9
1.25%
#10
1.12%
What city has the Highest Percentage of Immigrants from Ghana in New York?
Forest Home has the Highest Percentage of Immigrants from Ghana in New York with 5.69%.
What is the Percentage of Immigrants from Ghana in the State of New York?
Percentage of Immigrants from Ghana in New York is 0.20%.
What is the Percentage of Immigrants from Ghana in the United States?
Percentage of Immigrants from Ghana in the United States is 0.061%.