Cities with the Highest Percentage of Immigrants from France in New York
RELATED REPORTS & OPTIONS
France
New York
Compare Cities
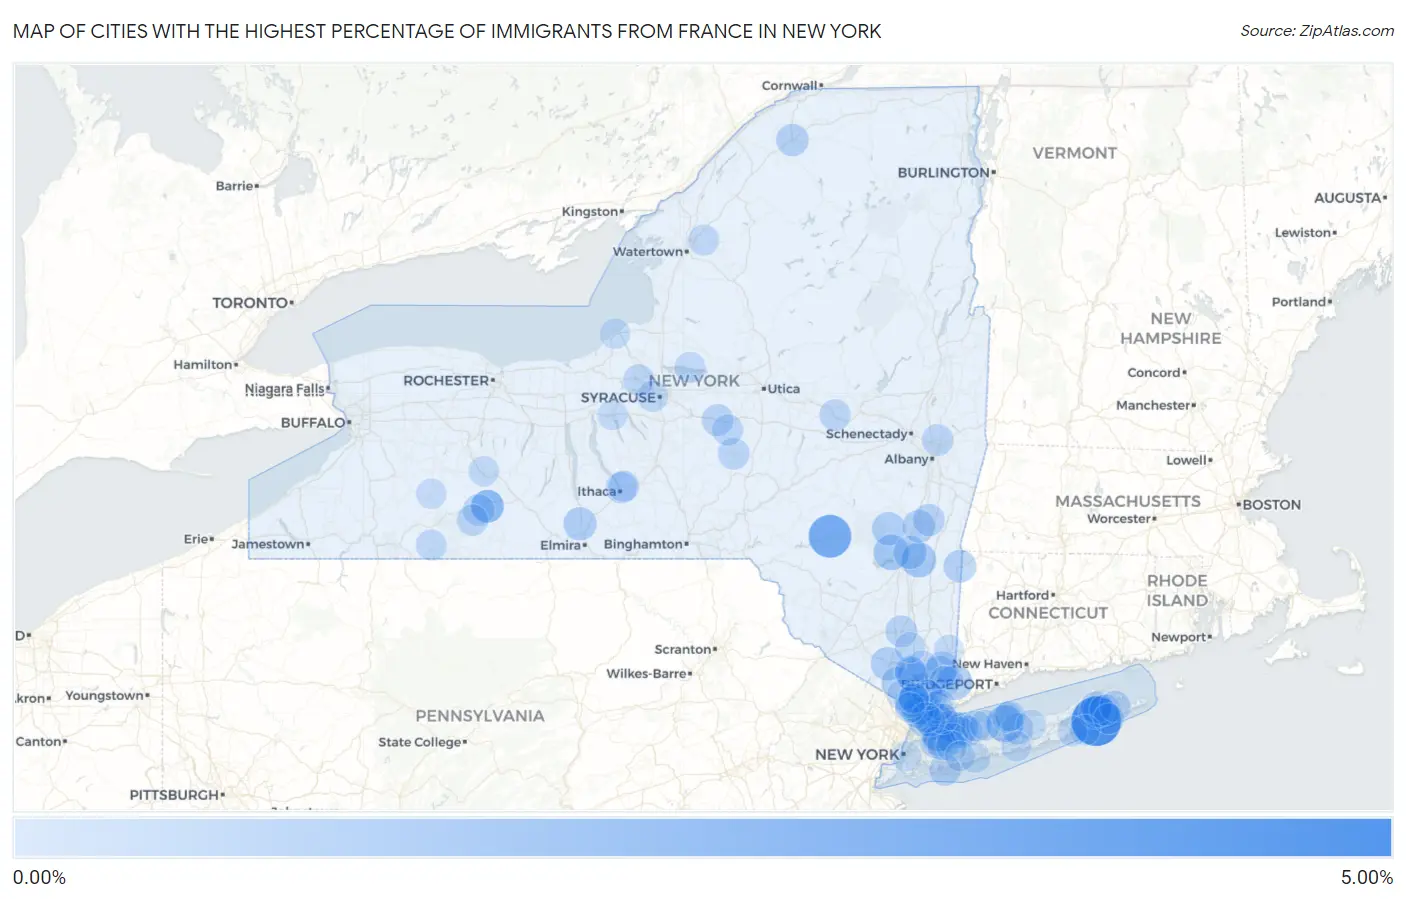
Map of Cities with the Highest Percentage of Immigrants from France in New York
0.00%
5.00%
Cities with the Highest Percentage of Immigrants from France in New York
| City | France | vs State | vs National | |
| 1. | Bridgehampton | 4.16% | 0.13%(+4.03)#1 | 0.056%(+4.10)#14 |
| 2. | Margaretville | 2.74% | 0.13%(+2.61)#2 | 0.056%(+2.69)#24 |
| 3. | Stony Brook University | 1.56% | 0.13%(+1.44)#3 | 0.056%(+1.51)#68 |
| 4. | Mamaroneck | 1.51% | 0.13%(+1.38)#4 | 0.056%(+1.45)#73 |
| 5. | Woodstock | 1.22% | 0.13%(+1.09)#5 | 0.056%(+1.16)#108 |
| 6. | Red Hook | 1.16% | 0.13%(+1.03)#6 | 0.056%(+1.10)#115 |
| 7. | Scotts Corners | 1.13% | 0.13%(+1.00)#7 | 0.056%(+1.07)#119 |
| 8. | Valhalla | 1.11% | 0.13%(+0.985)#8 | 0.056%(+1.06)#123 |
| 9. | Sleepy Hollow Lake | 1.10% | 0.13%(+0.971)#9 | 0.056%(+1.04)#128 |
| 10. | Tannersville | 0.86% | 0.13%(+0.729)#10 | 0.056%(+0.802)#176 |
| 11. | Harriman | 0.85% | 0.13%(+0.717)#11 | 0.056%(+0.790)#178 |
| 12. | Glasco | 0.84% | 0.13%(+0.715)#12 | 0.056%(+0.788)#179 |
| 13. | Piermont | 0.84% | 0.13%(+0.709)#13 | 0.056%(+0.782)#182 |
| 14. | Pine Valley | 0.82% | 0.13%(+0.692)#14 | 0.056%(+0.765)#189 |
| 15. | Cove Neck | 0.78% | 0.13%(+0.655)#15 | 0.056%(+0.728)#207 |
| 16. | Montrose | 0.75% | 0.13%(+0.622)#16 | 0.056%(+0.695)#220 |
| 17. | Greenville Cdp Westchester County | 0.74% | 0.13%(+0.612)#17 | 0.056%(+0.685)#226 |
| 18. | Katonah | 0.74% | 0.13%(+0.611)#18 | 0.056%(+0.684)#227 |
| 19. | Ardsley | 0.74% | 0.13%(+0.609)#19 | 0.056%(+0.682)#228 |
| 20. | Noyack | 0.71% | 0.13%(+0.580)#20 | 0.056%(+0.653)#235 |
| 21. | Catskill | 0.70% | 0.13%(+0.576)#21 | 0.056%(+0.649)#238 |
| 22. | Millerton | 0.70% | 0.13%(+0.567)#22 | 0.056%(+0.640)#241 |
| 23. | North Hornell | 0.69% | 0.13%(+0.565)#23 | 0.056%(+0.639)#244 |
| 24. | Manorhaven | 0.69% | 0.13%(+0.564)#24 | 0.056%(+0.637)#246 |
| 25. | Potsdam | 0.68% | 0.13%(+0.548)#25 | 0.056%(+0.621)#255 |
| 26. | Hornell | 0.67% | 0.13%(+0.541)#26 | 0.056%(+0.614)#258 |
| 27. | Bronxville | 0.65% | 0.13%(+0.526)#27 | 0.056%(+0.599)#266 |
| 28. | Port Washington North | 0.63% | 0.13%(+0.502)#28 | 0.056%(+0.575)#281 |
| 29. | Sag Harbor | 0.58% | 0.13%(+0.451)#29 | 0.056%(+0.524)#312 |
| 30. | Golden S Bridge | 0.58% | 0.13%(+0.449)#30 | 0.056%(+0.523)#314 |
| 31. | Hudson | 0.57% | 0.13%(+0.445)#31 | 0.056%(+0.518)#317 |
| 32. | Pomona | 0.57% | 0.13%(+0.444)#32 | 0.056%(+0.517)#319 |
| 33. | Briarcliff Manor | 0.57% | 0.13%(+0.439)#33 | 0.056%(+0.512)#322 |
| 34. | North Haven | 0.55% | 0.13%(+0.419)#34 | 0.056%(+0.492)#332 |
| 35. | Harrison | 0.55% | 0.13%(+0.418)#35 | 0.056%(+0.491)#333 |
| 36. | Mill Neck | 0.54% | 0.13%(+0.413)#36 | 0.056%(+0.486)#338 |
| 37. | Balmville | 0.53% | 0.13%(+0.400)#37 | 0.056%(+0.473)#347 |
| 38. | Morrisville | 0.52% | 0.13%(+0.395)#38 | 0.056%(+0.468)#351 |
| 39. | Sherburne | 0.51% | 0.13%(+0.377)#39 | 0.056%(+0.450)#365 |
| 40. | Cold Spring Harbor | 0.50% | 0.13%(+0.375)#40 | 0.056%(+0.448)#370 |
| 41. | Cayuga Heights | 0.49% | 0.13%(+0.366)#41 | 0.056%(+0.439)#379 |
| 42. | Dobbs Ferry | 0.49% | 0.13%(+0.361)#42 | 0.056%(+0.434)#385 |
| 43. | Cohoes | 0.48% | 0.13%(+0.355)#43 | 0.056%(+0.429)#394 |
| 44. | Almond | 0.48% | 0.13%(+0.350)#44 | 0.056%(+0.423)#401 |
| 45. | Grand View On Hudson | 0.47% | 0.13%(+0.343)#45 | 0.056%(+0.416)#406 |
| 46. | Barnum Island | 0.47% | 0.13%(+0.339)#46 | 0.056%(+0.412)#412 |
| 47. | Oyster Bay Cove | 0.46% | 0.13%(+0.334)#47 | 0.056%(+0.408)#420 |
| 48. | Coram | 0.45% | 0.13%(+0.322)#48 | 0.056%(+0.395)#431 |
| 49. | Lattingtown | 0.44% | 0.13%(+0.312)#49 | 0.056%(+0.386)#440 |
| 50. | Plandome | 0.44% | 0.13%(+0.311)#50 | 0.056%(+0.384)#443 |
| 51. | Alfred | 0.44% | 0.13%(+0.308)#51 | 0.056%(+0.381)#447 |
| 52. | Nelliston | 0.43% | 0.13%(+0.304)#52 | 0.056%(+0.377)#453 |
| 53. | Baldwinsville | 0.43% | 0.13%(+0.297)#53 | 0.056%(+0.370)#462 |
| 54. | Hastings On Hudson | 0.43% | 0.13%(+0.297)#54 | 0.056%(+0.370)#465 |
| 55. | Kensington | 0.42% | 0.13%(+0.286)#55 | 0.056%(+0.359)#477 |
| 56. | Hamilton | 0.41% | 0.13%(+0.283)#56 | 0.056%(+0.356)#480 |
| 57. | Crugers | 0.41% | 0.13%(+0.280)#57 | 0.056%(+0.353)#484 |
| 58. | Crompond | 0.41% | 0.13%(+0.278)#58 | 0.056%(+0.351)#489 |
| 59. | Northwest Harbor | 0.40% | 0.13%(+0.269)#59 | 0.056%(+0.342)#505 |
| 60. | Springs | 0.39% | 0.13%(+0.264)#60 | 0.056%(+0.337)#511 |
| 61. | Northeast Ithaca | 0.38% | 0.13%(+0.252)#61 | 0.056%(+0.325)#527 |
| 62. | Orangeburg | 0.38% | 0.13%(+0.250)#62 | 0.056%(+0.323)#528 |
| 63. | Solvay | 0.38% | 0.13%(+0.249)#63 | 0.056%(+0.323)#532 |
| 64. | Brookville | 0.37% | 0.13%(+0.239)#64 | 0.056%(+0.312)#550 |
| 65. | Nanuet | 0.36% | 0.13%(+0.231)#65 | 0.056%(+0.304)#565 |
| 66. | Carmel | 0.36% | 0.13%(+0.229)#66 | 0.056%(+0.302)#568 |
| 67. | Cleveland | 0.35% | 0.13%(+0.224)#67 | 0.056%(+0.297)#577 |
| 68. | Buchanan | 0.35% | 0.13%(+0.223)#68 | 0.056%(+0.296)#580 |
| 69. | Richburg | 0.35% | 0.13%(+0.220)#69 | 0.056%(+0.293)#584 |
| 70. | Fort Drum | 0.34% | 0.13%(+0.215)#70 | 0.056%(+0.288)#593 |
| 71. | Bedford | 0.34% | 0.13%(+0.212)#71 | 0.056%(+0.285)#597 |
| 72. | Searingtown | 0.34% | 0.13%(+0.211)#72 | 0.056%(+0.285)#601 |
| 73. | Rye Brook | 0.33% | 0.13%(+0.204)#73 | 0.056%(+0.277)#611 |
| 74. | Centerport | 0.33% | 0.13%(+0.202)#74 | 0.056%(+0.275)#613 |
| 75. | Cold Spring | 0.33% | 0.13%(+0.196)#75 | 0.056%(+0.270)#620 |
| 76. | Rye | 0.32% | 0.13%(+0.187)#76 | 0.056%(+0.260)#629 |
| 77. | East Hampton | 0.31% | 0.13%(+0.186)#77 | 0.056%(+0.259)#634 |
| 78. | Siena College | 0.31% | 0.13%(+0.176)#78 | 0.056%(+0.250)#655 |
| 79. | Westbury | 0.30% | 0.13%(+0.169)#79 | 0.056%(+0.242)#670 |
| 80. | Southampton | 0.29% | 0.13%(+0.161)#80 | 0.056%(+0.234)#691 |
| 81. | Fort Salonga | 0.28% | 0.13%(+0.156)#81 | 0.056%(+0.229)#700 |
| 82. | New Rochelle | 0.28% | 0.13%(+0.152)#82 | 0.056%(+0.225)#708 |
| 83. | Hawthorne | 0.28% | 0.13%(+0.148)#83 | 0.056%(+0.221)#719 |
| 84. | Lindenhurst | 0.28% | 0.13%(+0.147)#84 | 0.056%(+0.220)#721 |
| 85. | Dansville | 0.27% | 0.13%(+0.143)#85 | 0.056%(+0.216)#731 |
| 86. | Poquott | 0.27% | 0.13%(+0.142)#86 | 0.056%(+0.215)#736 |
| 87. | Nyack | 0.26% | 0.13%(+0.126)#87 | 0.056%(+0.199)#777 |
| 88. | South Nyack | 0.26% | 0.13%(+0.126)#88 | 0.056%(+0.199)#778 |
| 89. | Eastchester | 0.25% | 0.13%(+0.123)#89 | 0.056%(+0.196)#790 |
| 90. | Belle Terre | 0.25% | 0.13%(+0.118)#90 | 0.056%(+0.191)#804 |
| 91. | Tappan | 0.24% | 0.13%(+0.113)#91 | 0.056%(+0.186)#818 |
| 92. | Suny Oswego | 0.24% | 0.13%(+0.111)#92 | 0.056%(+0.184)#824 |
| 93. | Brewster | 0.24% | 0.13%(+0.110)#93 | 0.056%(+0.184)#826 |
| 94. | Ridge | 0.24% | 0.13%(+0.110)#94 | 0.056%(+0.183)#829 |
| 95. | North Wantagh | 0.24% | 0.13%(+0.107)#95 | 0.056%(+0.180)#834 |
| 96. | Patchogue | 0.23% | 0.13%(+0.098)#96 | 0.056%(+0.171)#868 |
| 97. | Houghton | 0.23% | 0.13%(+0.097)#97 | 0.056%(+0.170)#873 |
| 98. | Auburn | 0.22% | 0.13%(+0.096)#98 | 0.056%(+0.169)#875 |
| 99. | Hampton Bays | 0.22% | 0.13%(+0.095)#99 | 0.056%(+0.168)#877 |
| 100. | New York | 0.22% | 0.13%(+0.093)#100 | 0.056%(+0.166)#881 |
Common Questions
What are the Top 10 Cities with the Highest Percentage of Immigrants from France in New York?
Top 10 Cities with the Highest Percentage of Immigrants from France in New York are:
#1
4.16%
#2
2.74%
#3
1.56%
#4
1.51%
#5
1.22%
#6
1.16%
#7
1.13%
#8
1.11%
#9
0.86%
#10
0.85%
What city has the Highest Percentage of Immigrants from France in New York?
Bridgehampton has the Highest Percentage of Immigrants from France in New York with 4.16%.
What is the Percentage of Immigrants from France in the State of New York?
Percentage of Immigrants from France in New York is 0.13%.
What is the Percentage of Immigrants from France in the United States?
Percentage of Immigrants from France in the United States is 0.056%.