Cities with the Highest Percentage of Immigrants from Western Europe in New Jersey
RELATED REPORTS & OPTIONS
Western Europe
New Jersey
Compare Cities
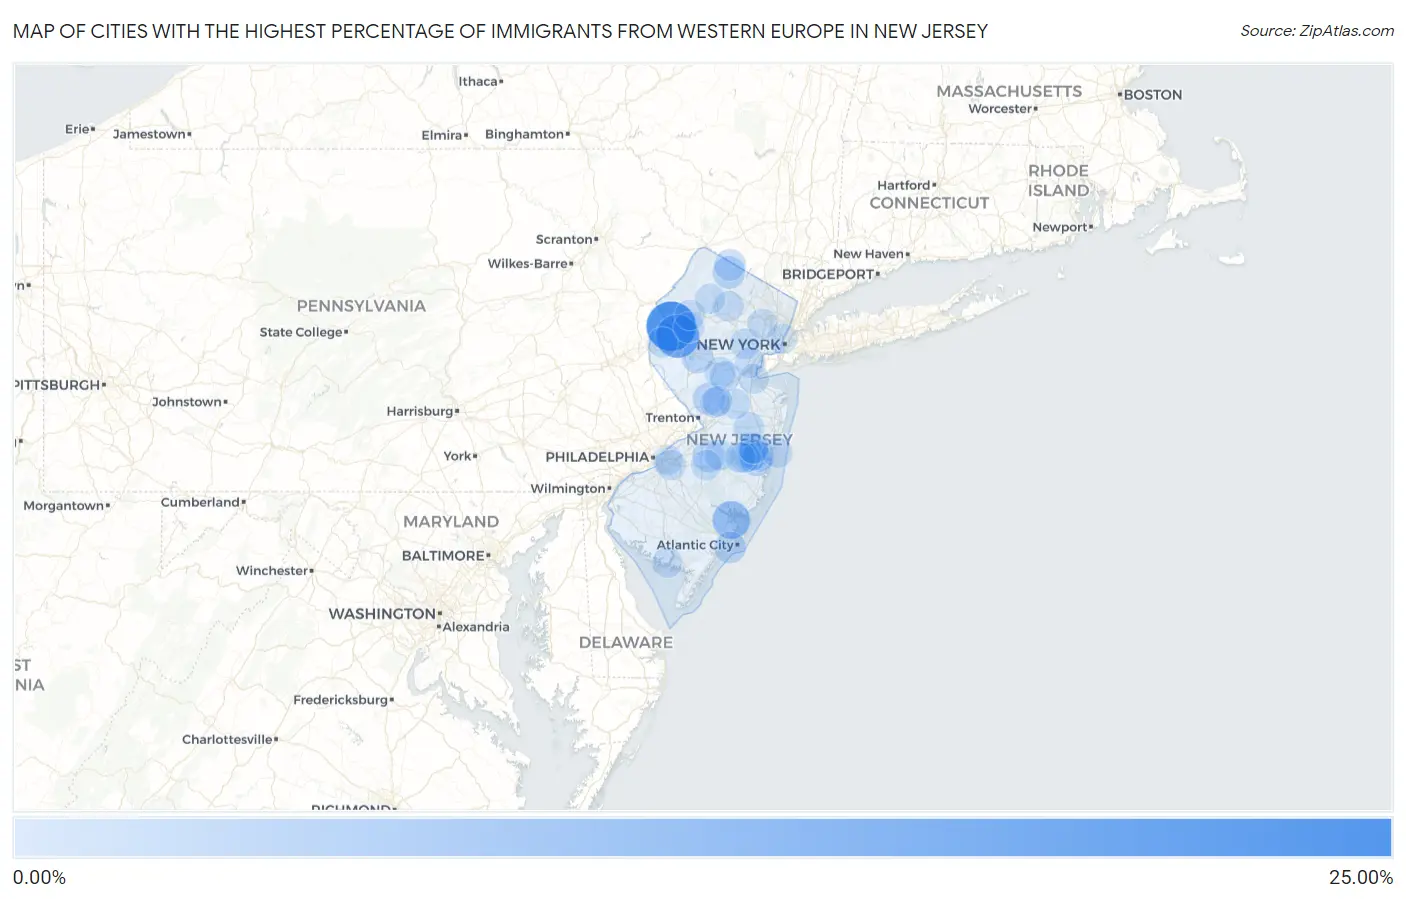
Map of Cities with the Highest Percentage of Immigrants from Western Europe in New Jersey
0.00%
25.00%
Cities with the Highest Percentage of Immigrants from Western Europe in New Jersey
| City | Western Europe | vs State | vs National | |
| 1. | Buttzville | 24.27% | 0.34%(+23.9)#1 | 0.28%(+24.0)#11 |
| 2. | Port Colden | 16.44% | 0.34%(+16.1)#2 | 0.28%(+16.2)#15 |
| 3. | Rocky Hill Borough | 9.70% | 0.34%(+9.36)#3 | 0.28%(+9.42)#33 |
| 4. | Port Republic | 9.69% | 0.34%(+9.36)#4 | 0.28%(+9.41)#34 |
| 5. | Fortescue | 9.20% | 0.34%(+8.86)#5 | 0.28%(+8.92)#39 |
| 6. | Heislerville | 9.09% | 0.34%(+8.75)#6 | 0.28%(+8.81)#42 |
| 7. | Dorothy | 7.60% | 0.34%(+7.27)#7 | 0.28%(+7.33)#63 |
| 8. | Highlands Borough | 4.43% | 0.34%(+4.10)#8 | 0.28%(+4.15)#151 |
| 9. | Vernon Center | 3.15% | 0.34%(+2.81)#9 | 0.28%(+2.87)#239 |
| 10. | Holiday Heights | 3.07% | 0.34%(+2.74)#10 | 0.28%(+2.80)#248 |
| 11. | Princeton | 3.07% | 0.34%(+2.73)#11 | 0.28%(+2.79)#250 |
| 12. | Pemberton Heights | 2.99% | 0.34%(+2.65)#12 | 0.28%(+2.71)#259 |
| 13. | Mauricetown | 2.76% | 0.34%(+2.42)#13 | 0.28%(+2.48)#299 |
| 14. | Carlls Corner | 2.46% | 0.34%(+2.12)#14 | 0.28%(+2.18)#361 |
| 15. | White House Station | 2.40% | 0.34%(+2.07)#15 | 0.28%(+2.12)#373 |
| 16. | Ventnor City | 2.32% | 0.34%(+1.98)#16 | 0.28%(+2.04)#400 |
| 17. | Vernon Valley | 2.31% | 0.34%(+1.97)#17 | 0.28%(+2.03)#403 |
| 18. | Rockleigh Borough | 2.12% | 0.34%(+1.78)#18 | 0.28%(+1.84)#468 |
| 19. | Brookside | 2.07% | 0.34%(+1.74)#19 | 0.28%(+1.79)#483 |
| 20. | Pines Lake | 1.88% | 0.34%(+1.54)#20 | 0.28%(+1.60)#569 |
| 21. | Madison Borough | 1.74% | 0.34%(+1.40)#21 | 0.28%(+1.46)#637 |
| 22. | Liberty Corner | 1.71% | 0.34%(+1.37)#22 | 0.28%(+1.43)#650 |
| 23. | Frenchtown Borough | 1.65% | 0.34%(+1.31)#23 | 0.28%(+1.37)#690 |
| 24. | Peapack And Gladstone Borough | 1.64% | 0.34%(+1.30)#24 | 0.28%(+1.36)#697 |
| 25. | Rainbow Lakes | 1.60% | 0.34%(+1.26)#25 | 0.28%(+1.32)#725 |
| 26. | Silver Ridge | 1.60% | 0.34%(+1.26)#26 | 0.28%(+1.32)#727 |
| 27. | Weston | 1.59% | 0.34%(+1.25)#27 | 0.28%(+1.31)#737 |
| 28. | Pine Ridge At Crestwood | 1.57% | 0.34%(+1.23)#28 | 0.28%(+1.29)#749 |
| 29. | Leisure Knoll | 1.56% | 0.34%(+1.23)#29 | 0.28%(+1.28)#752 |
| 30. | Ocean View | 1.56% | 0.34%(+1.22)#30 | 0.28%(+1.28)#755 |
| 31. | Holiday City Berkeley | 1.53% | 0.34%(+1.19)#31 | 0.28%(+1.25)#779 |
| 32. | Stone Harbor Borough | 1.47% | 0.34%(+1.13)#32 | 0.28%(+1.19)#815 |
| 33. | Lyons | 1.45% | 0.34%(+1.11)#33 | 0.28%(+1.17)#830 |
| 34. | Vista Center | 1.42% | 0.34%(+1.09)#34 | 0.28%(+1.15)#854 |
| 35. | Pompton Plains | 1.36% | 0.34%(+1.02)#35 | 0.28%(+1.08)#912 |
| 36. | Bernardsville Borough | 1.36% | 0.34%(+1.02)#36 | 0.28%(+1.08)#917 |
| 37. | Paramus Borough | 1.34% | 0.34%(+1.00)#37 | 0.28%(+1.06)#937 |
| 38. | Crestwood Village | 1.30% | 0.34%(+0.960)#38 | 0.28%(+1.02)#982 |
| 39. | Chester Borough | 1.28% | 0.34%(+0.947)#39 | 0.28%(+1.00)#997 |
| 40. | Hasbrouck Heights Borough | 1.28% | 0.34%(+0.946)#40 | 0.28%(+1.00)#1,002 |
| 41. | Beattystown | 1.23% | 0.34%(+0.893)#41 | 0.28%(+0.951)#1,056 |
| 42. | Farmingdale Borough | 1.21% | 0.34%(+0.869)#42 | 0.28%(+0.927)#1,081 |
| 43. | Lakehurst Borough | 1.21% | 0.34%(+0.869)#43 | 0.28%(+0.927)#1,084 |
| 44. | Hopelawn | 1.20% | 0.34%(+0.866)#44 | 0.28%(+0.923)#1,089 |
| 45. | Ledgewood | 1.19% | 0.34%(+0.857)#45 | 0.28%(+0.914)#1,101 |
| 46. | Concordia | 1.18% | 0.34%(+0.844)#46 | 0.28%(+0.902)#1,126 |
| 47. | Pleasantdale | 1.18% | 0.34%(+0.841)#47 | 0.28%(+0.899)#1,132 |
| 48. | Browns Mills | 1.17% | 0.34%(+0.836)#48 | 0.28%(+0.894)#1,140 |
| 49. | Kenilworth Borough | 1.16% | 0.34%(+0.825)#49 | 0.28%(+0.883)#1,156 |
| 50. | Summit | 1.16% | 0.34%(+0.820)#50 | 0.28%(+0.878)#1,167 |
| 51. | Millington | 1.16% | 0.34%(+0.819)#51 | 0.28%(+0.877)#1,169 |
| 52. | Leisuretowne | 1.15% | 0.34%(+0.815)#52 | 0.28%(+0.873)#1,175 |
| 53. | Milmay | 1.15% | 0.34%(+0.814)#53 | 0.28%(+0.872)#1,176 |
| 54. | Middlebush | 1.13% | 0.34%(+0.792)#54 | 0.28%(+0.850)#1,197 |
| 55. | Midland Park Borough | 1.13% | 0.34%(+0.788)#55 | 0.28%(+0.846)#1,203 |
| 56. | Folsom Borough | 1.08% | 0.34%(+0.742)#56 | 0.28%(+0.800)#1,273 |
| 57. | New Village | 1.05% | 0.34%(+0.718)#57 | 0.28%(+0.776)#1,315 |
| 58. | Far Hills Borough | 1.05% | 0.34%(+0.713)#58 | 0.28%(+0.771)#1,324 |
| 59. | Flemington Borough | 1.03% | 0.34%(+0.691)#59 | 0.28%(+0.749)#1,379 |
| 60. | Cedar Glen Lakes | 1.03% | 0.34%(+0.690)#60 | 0.28%(+0.747)#1,383 |
| 61. | Gillette | 1.02% | 0.34%(+0.682)#61 | 0.28%(+0.740)#1,395 |
| 62. | Bay Head Borough | 1.00% | 0.34%(+0.667)#62 | 0.28%(+0.724)#1,425 |
| 63. | Panther Valley | 0.99% | 0.34%(+0.649)#63 | 0.28%(+0.707)#1,453 |
| 64. | Germania | 0.96% | 0.34%(+0.627)#64 | 0.28%(+0.685)#1,500 |
| 65. | Ramsey Borough | 0.96% | 0.34%(+0.619)#65 | 0.28%(+0.677)#1,517 |
| 66. | Shrewsbury Borough | 0.94% | 0.34%(+0.605)#66 | 0.28%(+0.663)#1,549 |
| 67. | Lake Telemark | 0.92% | 0.34%(+0.585)#67 | 0.28%(+0.643)#1,594 |
| 68. | Barnegat Light Borough | 0.92% | 0.34%(+0.582)#68 | 0.28%(+0.640)#1,602 |
| 69. | Lake Mohawk | 0.91% | 0.34%(+0.570)#69 | 0.28%(+0.628)#1,638 |
| 70. | Allendale Borough | 0.89% | 0.34%(+0.558)#70 | 0.28%(+0.616)#1,669 |
| 71. | Sussex Borough | 0.89% | 0.34%(+0.549)#71 | 0.28%(+0.607)#1,695 |
| 72. | Dover Beaches North | 0.88% | 0.34%(+0.547)#72 | 0.28%(+0.605)#1,702 |
| 73. | Essex Fells Borough | 0.87% | 0.34%(+0.536)#73 | 0.28%(+0.594)#1,732 |
| 74. | Califon Borough | 0.85% | 0.34%(+0.515)#74 | 0.28%(+0.573)#1,779 |
| 75. | Hampton Borough | 0.85% | 0.34%(+0.509)#75 | 0.28%(+0.567)#1,796 |
| 76. | Englishtown Borough | 0.85% | 0.34%(+0.508)#76 | 0.28%(+0.566)#1,797 |
| 77. | Mountain Lakes Borough | 0.84% | 0.34%(+0.507)#77 | 0.28%(+0.565)#1,800 |
| 78. | Leisure Village West | 0.84% | 0.34%(+0.501)#78 | 0.28%(+0.559)#1,820 |
| 79. | Surf City Borough | 0.83% | 0.34%(+0.493)#79 | 0.28%(+0.551)#1,836 |
| 80. | Glen Ridge Borough | 0.82% | 0.34%(+0.484)#80 | 0.28%(+0.542)#1,861 |
| 81. | Colonia | 0.79% | 0.34%(+0.454)#81 | 0.28%(+0.512)#1,956 |
| 82. | New Providence Borough | 0.78% | 0.34%(+0.443)#82 | 0.28%(+0.500)#1,989 |
| 83. | Cliffside Park Borough | 0.77% | 0.34%(+0.434)#83 | 0.28%(+0.492)#2,016 |
| 84. | Atlantic Highlands Borough | 0.77% | 0.34%(+0.434)#84 | 0.28%(+0.492)#2,017 |
| 85. | Port Norris | 0.76% | 0.34%(+0.423)#85 | 0.28%(+0.481)#2,055 |
| 86. | Basking Ridge | 0.76% | 0.34%(+0.422)#86 | 0.28%(+0.480)#2,058 |
| 87. | Golden Triangle | 0.75% | 0.34%(+0.409)#87 | 0.28%(+0.467)#2,093 |
| 88. | Hoboken | 0.74% | 0.34%(+0.407)#88 | 0.28%(+0.465)#2,103 |
| 89. | Princeton Junction | 0.74% | 0.34%(+0.405)#89 | 0.28%(+0.463)#2,111 |
| 90. | Little Silver Borough | 0.74% | 0.34%(+0.400)#90 | 0.28%(+0.458)#2,133 |
| 91. | Bridgewater Center | 0.74% | 0.34%(+0.400)#91 | 0.28%(+0.458)#2,134 |
| 92. | Barclay | 0.73% | 0.34%(+0.396)#92 | 0.28%(+0.453)#2,148 |
| 93. | Riverton Borough | 0.72% | 0.34%(+0.386)#93 | 0.28%(+0.444)#2,194 |
| 94. | South Amboy | 0.72% | 0.34%(+0.381)#94 | 0.28%(+0.438)#2,209 |
| 95. | Manville Borough | 0.72% | 0.34%(+0.379)#95 | 0.28%(+0.437)#2,215 |
| 96. | The Hills | 0.69% | 0.34%(+0.358)#96 | 0.28%(+0.416)#2,276 |
| 97. | Alpine Borough | 0.69% | 0.34%(+0.353)#97 | 0.28%(+0.411)#2,290 |
| 98. | Plainsboro Center | 0.69% | 0.34%(+0.350)#98 | 0.28%(+0.408)#2,304 |
| 99. | Upper Montclair | 0.68% | 0.34%(+0.346)#99 | 0.28%(+0.404)#2,321 |
| 100. | Collingswood Borough | 0.67% | 0.34%(+0.335)#100 | 0.28%(+0.393)#2,368 |
Common Questions
What are the Top 10 Cities with the Highest Percentage of Immigrants from Western Europe in New Jersey?
Top 10 Cities with the Highest Percentage of Immigrants from Western Europe in New Jersey are:
#1
24.27%
#2
16.44%
#3
9.69%
#4
3.15%
#5
3.07%
#6
3.07%
#7
2.99%
#8
2.40%
#9
2.32%
#10
2.31%
What city has the Highest Percentage of Immigrants from Western Europe in New Jersey?
Buttzville has the Highest Percentage of Immigrants from Western Europe in New Jersey with 24.27%.
What is the Percentage of Immigrants from Western Europe in the State of New Jersey?
Percentage of Immigrants from Western Europe in New Jersey is 0.34%.
What is the Percentage of Immigrants from Western Europe in the United States?
Percentage of Immigrants from Western Europe in the United States is 0.28%.