Cities with the Largest West Indian Community in New Jersey
RELATED REPORTS & OPTIONS
West Indian
New Jersey
Compare Cities
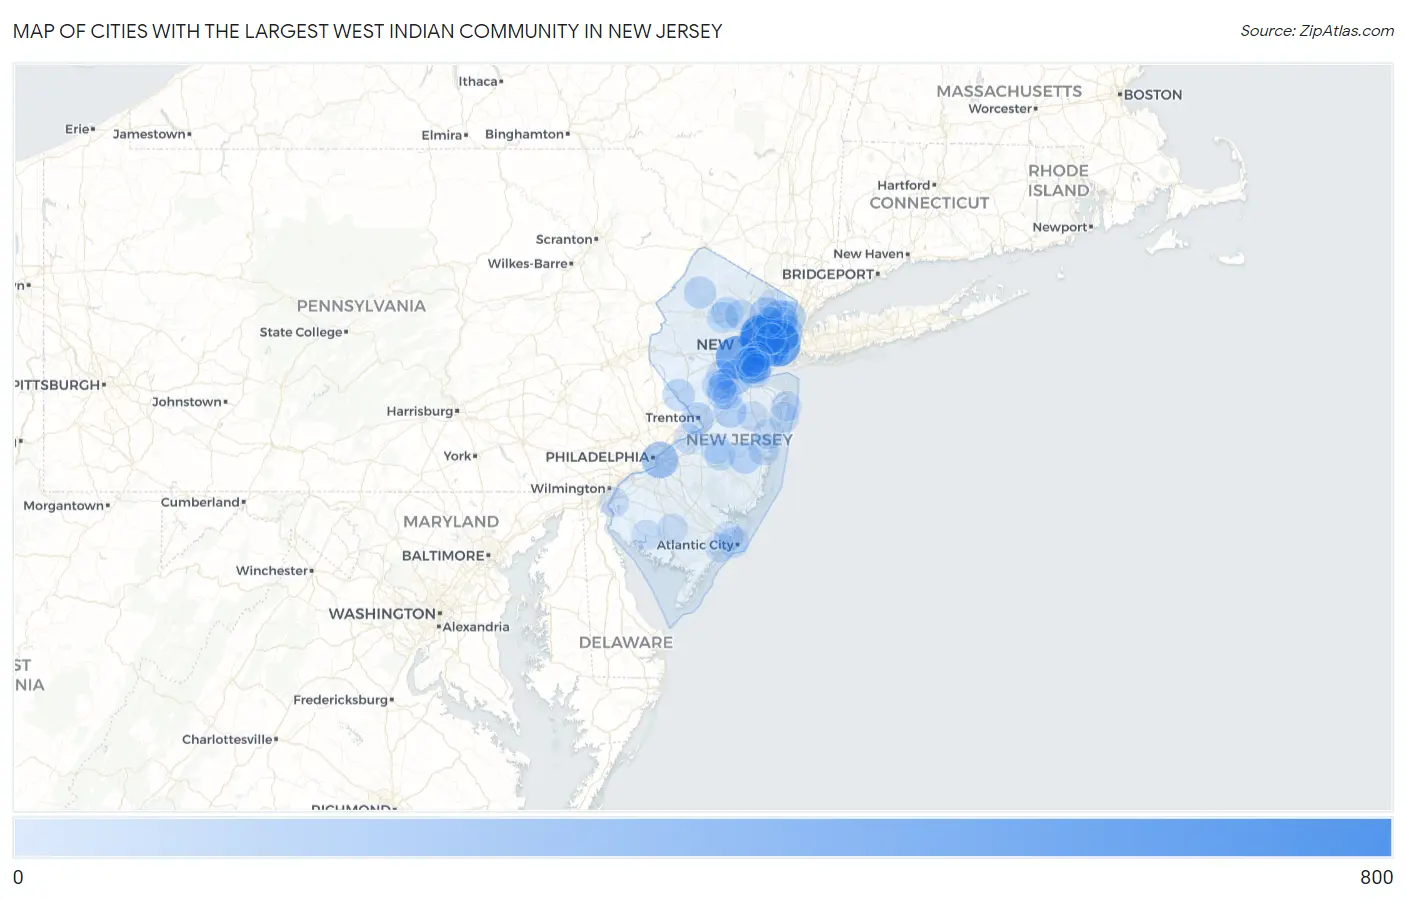
Map of Cities with the Largest West Indian Community in New Jersey
0
800
Cities with the Largest West Indian Community in New Jersey
| City | West Indian | vs State | vs National | |
| 1. | Newark | 758 | 14,042(5.40%)#1 | 267,308(0.28%)#24 |
| 2. | Jersey City | 618 | 14,042(4.40%)#2 | 267,308(0.23%)#32 |
| 3. | Plainfield | 520 | 14,042(3.70%)#3 | 267,308(0.19%)#41 |
| 4. | East Orange | 502 | 14,042(3.57%)#4 | 267,308(0.19%)#44 |
| 5. | Sayreville Borough | 398 | 14,042(2.83%)#5 | 267,308(0.15%)#67 |
| 6. | Menlo Park Terrace | 307 | 14,042(2.19%)#6 | 267,308(0.11%)#100 |
| 7. | Iselin | 264 | 14,042(1.88%)#7 | 267,308(0.10%)#116 |
| 8. | Camden | 258 | 14,042(1.84%)#8 | 267,308(0.10%)#123 |
| 9. | Bogota Borough | 212 | 14,042(1.51%)#9 | 267,308(0.08%)#154 |
| 10. | New Brunswick | 193 | 14,042(1.37%)#10 | 267,308(0.07%)#174 |
| 11. | Hackensack | 190 | 14,042(1.35%)#11 | 267,308(0.07%)#178 |
| 12. | West New York | 189 | 14,042(1.35%)#12 | 267,308(0.07%)#179 |
| 13. | Englewood | 148 | 14,042(1.05%)#13 | 267,308(0.06%)#225 |
| 14. | Paterson | 133 | 14,042(0.95%)#14 | 267,308(0.05%)#253 |
| 15. | Elizabeth | 127 | 14,042(0.90%)#15 | 267,308(0.05%)#271 |
| 16. | Twin Rivers | 126 | 14,042(0.90%)#16 | 267,308(0.05%)#277 |
| 17. | Carteret Borough | 111 | 14,042(0.79%)#17 | 267,308(0.04%)#317 |
| 18. | Trenton | 108 | 14,042(0.77%)#18 | 267,308(0.04%)#325 |
| 19. | Union City | 107 | 14,042(0.76%)#19 | 267,308(0.04%)#327 |
| 20. | Bergenfield Borough | 107 | 14,042(0.76%)#20 | 267,308(0.04%)#330 |
| 21. | Woodbridge | 106 | 14,042(0.75%)#21 | 267,308(0.04%)#335 |
| 22. | Ramsey Borough | 105 | 14,042(0.75%)#22 | 267,308(0.04%)#337 |
| 23. | Crestwood Village | 102 | 14,042(0.73%)#23 | 267,308(0.04%)#346 |
| 24. | Hopatcong Borough | 101 | 14,042(0.72%)#24 | 267,308(0.04%)#350 |
| 25. | Bayonne | 97 | 14,042(0.69%)#25 | 267,308(0.04%)#361 |
| 26. | Lambertville | 94 | 14,042(0.67%)#26 | 267,308(0.04%)#374 |
| 27. | Newton | 90 | 14,042(0.64%)#27 | 267,308(0.03%)#394 |
| 28. | Hoboken | 79 | 14,042(0.56%)#28 | 267,308(0.03%)#435 |
| 29. | Neptune City Borough | 79 | 14,042(0.56%)#29 | 267,308(0.03%)#438 |
| 30. | Rahway | 76 | 14,042(0.54%)#30 | 267,308(0.03%)#446 |
| 31. | Freehold Borough | 76 | 14,042(0.54%)#31 | 267,308(0.03%)#447 |
| 32. | Harrison | 73 | 14,042(0.52%)#32 | 267,308(0.03%)#463 |
| 33. | Westmont | 71 | 14,042(0.51%)#33 | 267,308(0.03%)#479 |
| 34. | Monmouth Junction | 70 | 14,042(0.50%)#34 | 267,308(0.03%)#489 |
| 35. | Perth Amboy | 68 | 14,042(0.48%)#35 | 267,308(0.03%)#496 |
| 36. | Roselle Borough | 68 | 14,042(0.48%)#36 | 267,308(0.03%)#500 |
| 37. | White Meadow Lake | 64 | 14,042(0.46%)#37 | 267,308(0.02%)#522 |
| 38. | Palisades Park Borough | 57 | 14,042(0.41%)#38 | 267,308(0.02%)#573 |
| 39. | Ridgefield Park | 57 | 14,042(0.41%)#39 | 267,308(0.02%)#576 |
| 40. | Matawan Borough | 57 | 14,042(0.41%)#40 | 267,308(0.02%)#577 |
| 41. | Dover | 56 | 14,042(0.40%)#41 | 267,308(0.02%)#584 |
| 42. | Toms River | 53 | 14,042(0.38%)#42 | 267,308(0.02%)#602 |
| 43. | Passaic | 52 | 14,042(0.37%)#43 | 267,308(0.02%)#611 |
| 44. | Browns Mills | 48 | 14,042(0.34%)#44 | 267,308(0.02%)#643 |
| 45. | Beesleys Point | 48 | 14,042(0.34%)#45 | 267,308(0.02%)#647 |
| 46. | North Plainfield Borough | 45 | 14,042(0.32%)#46 | 267,308(0.02%)#682 |
| 47. | Griggstown | 43 | 14,042(0.31%)#47 | 267,308(0.02%)#698 |
| 48. | Metuchen Borough | 42 | 14,042(0.30%)#48 | 267,308(0.02%)#710 |
| 49. | Union Beach Borough | 42 | 14,042(0.30%)#49 | 267,308(0.02%)#711 |
| 50. | Boonton | 39 | 14,042(0.28%)#50 | 267,308(0.01%)#752 |
| 51. | Linden | 37 | 14,042(0.26%)#51 | 267,308(0.01%)#769 |
| 52. | Hillsborough | 37 | 14,042(0.26%)#52 | 267,308(0.01%)#773 |
| 53. | Ramtown | 37 | 14,042(0.26%)#53 | 267,308(0.01%)#780 |
| 54. | Atlantic City | 36 | 14,042(0.26%)#54 | 267,308(0.01%)#793 |
| 55. | Closter Borough | 36 | 14,042(0.26%)#55 | 267,308(0.01%)#800 |
| 56. | Fort Dix | 36 | 14,042(0.26%)#56 | 267,308(0.01%)#801 |
| 57. | Clifton | 35 | 14,042(0.25%)#57 | 267,308(0.01%)#805 |
| 58. | Haledon Borough | 35 | 14,042(0.25%)#58 | 267,308(0.01%)#816 |
| 59. | Prospect Park Borough | 35 | 14,042(0.25%)#59 | 267,308(0.01%)#818 |
| 60. | Port Reading | 35 | 14,042(0.25%)#60 | 267,308(0.01%)#819 |
| 61. | Avenel | 33 | 14,042(0.24%)#61 | 267,308(0.01%)#845 |
| 62. | Manville Borough | 33 | 14,042(0.24%)#62 | 267,308(0.01%)#848 |
| 63. | Vauxhall | 33 | 14,042(0.24%)#63 | 267,308(0.01%)#850 |
| 64. | Asbury Park | 32 | 14,042(0.23%)#64 | 267,308(0.01%)#856 |
| 65. | Maywood Borough | 31 | 14,042(0.22%)#65 | 267,308(0.01%)#877 |
| 66. | Somerdale Borough | 31 | 14,042(0.22%)#66 | 267,308(0.01%)#882 |
| 67. | Vineland | 29 | 14,042(0.21%)#67 | 267,308(0.01%)#917 |
| 68. | Long Branch | 28 | 14,042(0.20%)#68 | 267,308(0.01%)#937 |
| 69. | Bloomingdale Borough | 28 | 14,042(0.20%)#69 | 267,308(0.01%)#948 |
| 70. | Dumont Borough | 27 | 14,042(0.19%)#70 | 267,308(0.01%)#971 |
| 71. | West Freehold | 27 | 14,042(0.19%)#71 | 267,308(0.01%)#974 |
| 72. | South Plainfield Borough | 25 | 14,042(0.18%)#72 | 267,308(0.01%)#1,019 |
| 73. | Cliffside Park Borough | 24 | 14,042(0.17%)#73 | 267,308(0.01%)#1,043 |
| 74. | Carlstadt Borough | 24 | 14,042(0.17%)#74 | 267,308(0.01%)#1,054 |
| 75. | Roselle Park Borough | 23 | 14,042(0.16%)#75 | 267,308(0.01%)#1,076 |
| 76. | East Millstone | 23 | 14,042(0.16%)#76 | 267,308(0.01%)#1,090 |
| 77. | Pennsville | 22 | 14,042(0.16%)#77 | 267,308(0.01%)#1,111 |
| 78. | Glen Ridge Borough | 22 | 14,042(0.16%)#78 | 267,308(0.01%)#1,116 |
| 79. | Watsessing | 22 | 14,042(0.16%)#79 | 267,308(0.01%)#1,117 |
| 80. | New Milford Borough | 20 | 14,042(0.14%)#80 | 267,308(0.01%)#1,170 |
| 81. | Oak Ridge | 20 | 14,042(0.14%)#81 | 267,308(0.01%)#1,172 |
| 82. | Packanack Lake | 20 | 14,042(0.14%)#82 | 267,308(0.01%)#1,176 |
| 83. | Sewaren | 20 | 14,042(0.14%)#83 | 267,308(0.01%)#1,180 |
| 84. | Bridgeton | 19 | 14,042(0.14%)#84 | 267,308(0.01%)#1,199 |
| 85. | Burlington | 19 | 14,042(0.14%)#85 | 267,308(0.01%)#1,213 |
| 86. | North Arlington Borough | 18 | 14,042(0.13%)#86 | 267,308(0.01%)#1,252 |
| 87. | Franklin Park | 17 | 14,042(0.12%)#87 | 267,308(0.01%)#1,292 |
| 88. | Linwood | 16 | 14,042(0.11%)#88 | 267,308(0.01%)#1,324 |
| 89. | Landing | 16 | 14,042(0.11%)#89 | 267,308(0.01%)#1,328 |
| 90. | Kearny | 15 | 14,042(0.11%)#90 | 267,308(0.01%)#1,344 |
| 91. | Absecon | 15 | 14,042(0.11%)#91 | 267,308(0.01%)#1,361 |
| 92. | Colonia | 14 | 14,042(0.10%)#92 | 267,308(0.01%)#1,392 |
| 93. | Dayton | 14 | 14,042(0.10%)#93 | 267,308(0.01%)#1,399 |
| 94. | Ridgewood | 12 | 14,042(0.09%)#94 | 267,308(0.00%)#1,459 |
| 95. | Parsippany | 12 | 14,042(0.09%)#95 | 267,308(0.00%)#1,464 |
| 96. | Wanaque Borough | 12 | 14,042(0.09%)#96 | 267,308(0.00%)#1,478 |
| 97. | Upper Saddle River Borough | 12 | 14,042(0.09%)#97 | 267,308(0.00%)#1,481 |
| 98. | Fort Lee Borough | 11 | 14,042(0.08%)#98 | 267,308(0.00%)#1,506 |
| 99. | Kendall Park | 11 | 14,042(0.08%)#99 | 267,308(0.00%)#1,529 |
| 100. | Fair Lawn Borough | 10 | 14,042(0.07%)#100 | 267,308(0.00%)#1,557 |
Common Questions
What are the Top 10 Cities with the Largest West Indian Community in New Jersey?
Top 10 Cities with the Largest West Indian Community in New Jersey are:
#1
758
#2
618
#3
520
#4
502
#5
264
#6
258
#7
193
#8
190
#9
189
#10
148
What city has the Largest West Indian Community in New Jersey?
Newark has the Largest West Indian Community in New Jersey with 758.
What is the Total West Indian Population in the State of New Jersey?
Total West Indian Population in New Jersey is 14,042.
What is the Total West Indian Population in the United States?
Total West Indian Population in the United States is 267,308.