Cities with the Highest Percentage of Population with a Degree in Computers and Mathematics in Kentucky
RELATED REPORTS & OPTIONS
Computers and Mathematics
Kentucky
Compare Cities
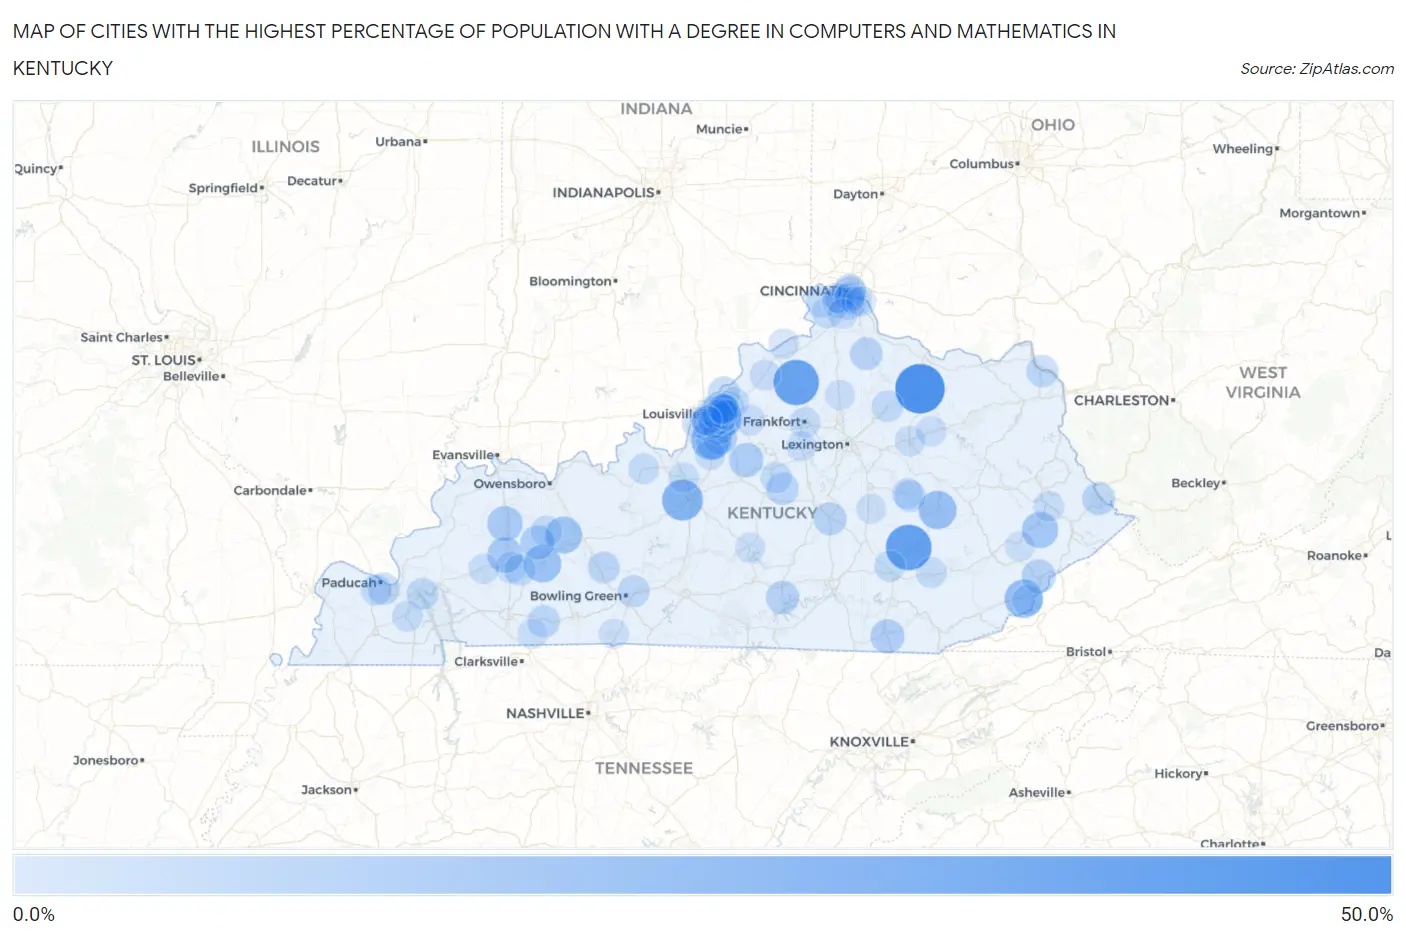
Map of Cities with the Highest Percentage of Population with a Degree in Computers and Mathematics in Kentucky
0.0%
50.0%
Cities with the Highest Percentage of Population with a Degree in Computers and Mathematics in Kentucky
| City | % Graduates | vs State | vs National | |
| 1. | Ewing | 50.0% | 3.8%(+46.2)#1 | 4.9%(+45.1)#105 |
| 2. | Annville | 40.9% | 3.8%(+37.1)#2 | 4.9%(+36.0)#157 |
| 3. | Gratz | 40.0% | 3.8%(+36.2)#3 | 4.9%(+35.1)#167 |
| 4. | Cecilia | 29.4% | 3.8%(+25.6)#4 | 4.9%(+24.5)#298 |
| 5. | Hunters Hollow | 27.8% | 3.8%(+23.9)#5 | 4.9%(+22.9)#336 |
| 6. | Hurstbourne Acres | 25.3% | 3.8%(+21.4)#6 | 4.9%(+20.4)#401 |
| 7. | Benham | 23.7% | 3.8%(+19.9)#7 | 4.9%(+18.9)#457 |
| 8. | Beattyville | 23.0% | 3.8%(+19.1)#8 | 4.9%(+18.1)#484 |
| 9. | Greenville | 21.3% | 3.8%(+17.5)#9 | 4.9%(+16.4)#548 |
| 10. | Centertown | 20.0% | 3.8%(+16.2)#10 | 4.9%(+15.1)#596 |
| 11. | Wayland | 18.8% | 3.8%(+14.9)#11 | 4.9%(+13.9)#687 |
| 12. | Earlington | 16.7% | 3.8%(+12.8)#12 | 4.9%(+11.8)#854 |
| 13. | Slaughters | 16.7% | 3.8%(+12.8)#13 | 4.9%(+11.8)#864 |
| 14. | Bremen | 14.3% | 3.8%(+10.4)#14 | 4.9%(+9.39)#1,119 |
| 15. | Fairfield | 14.3% | 3.8%(+10.4)#15 | 4.9%(+9.39)#1,130 |
| 16. | Heritage Creek | 13.9% | 3.8%(+10.1)#16 | 4.9%(+9.04)#1,170 |
| 17. | Emlyn | 13.6% | 3.8%(+9.75)#17 | 4.9%(+8.69)#1,224 |
| 18. | Whitesburg | 13.5% | 3.8%(+9.62)#18 | 4.9%(+8.56)#1,249 |
| 19. | Jamestown | 11.9% | 3.8%(+8.06)#19 | 4.9%(+7.00)#1,550 |
| 20. | Lynnview | 11.8% | 3.8%(+7.93)#20 | 4.9%(+6.87)#1,573 |
| 21. | Hillview | 11.6% | 3.8%(+7.80)#21 | 4.9%(+6.74)#1,616 |
| 22. | Stanford | 11.5% | 3.8%(+7.66)#22 | 4.9%(+6.60)#1,650 |
| 23. | South Williamson | 11.4% | 3.8%(+7.53)#23 | 4.9%(+6.47)#1,681 |
| 24. | Falmouth | 10.8% | 3.8%(+6.96)#24 | 4.9%(+5.90)#1,847 |
| 25. | Mackville | 10.3% | 3.8%(+6.51)#25 | 4.9%(+5.45)#2,005 |
| 26. | Elkton | 10.0% | 3.8%(+6.16)#26 | 4.9%(+5.11)#2,122 |
| 27. | Goshen | 9.7% | 3.8%(+5.90)#27 | 4.9%(+4.84)#2,253 |
| 28. | Taylor Mill | 9.7% | 3.8%(+5.85)#28 | 4.9%(+4.79)#2,265 |
| 29. | Farley | 9.5% | 3.8%(+5.66)#29 | 4.9%(+4.60)#2,377 |
| 30. | Wurtland | 9.5% | 3.8%(+5.64)#30 | 4.9%(+4.58)#2,384 |
| 31. | Brownsboro Farm | 9.1% | 3.8%(+5.26)#31 | 4.9%(+4.20)#2,571 |
| 32. | Plum Springs | 9.1% | 3.8%(+5.26)#32 | 4.9%(+4.20)#2,576 |
| 33. | Woodlawn | 9.1% | 3.8%(+5.26)#33 | 4.9%(+4.20)#2,587 |
| 34. | Woodbury | 9.1% | 3.8%(+5.26)#34 | 4.9%(+4.20)#2,594 |
| 35. | Grand Rivers | 8.9% | 3.8%(+5.08)#35 | 4.9%(+4.02)#2,681 |
| 36. | Millersburg | 8.8% | 3.8%(+4.96)#36 | 4.9%(+3.90)#2,728 |
| 37. | Bellevue | 8.7% | 3.8%(+4.89)#37 | 4.9%(+3.83)#2,779 |
| 38. | Hollow Creek | 8.5% | 3.8%(+4.67)#38 | 4.9%(+3.62)#2,888 |
| 39. | Ravenna | 8.3% | 3.8%(+4.50)#39 | 4.9%(+3.44)#2,984 |
| 40. | West Van Lear | 8.2% | 3.8%(+4.34)#40 | 4.9%(+3.28)#3,101 |
| 41. | Nortonville | 8.0% | 3.8%(+4.16)#41 | 4.9%(+3.11)#3,203 |
| 42. | Willisburg | 8.0% | 3.8%(+4.16)#42 | 4.9%(+3.11)#3,210 |
| 43. | Lincolnshire | 8.0% | 3.8%(+4.16)#43 | 4.9%(+3.11)#3,218 |
| 44. | Union | 7.9% | 3.8%(+4.04)#44 | 4.9%(+2.98)#3,307 |
| 45. | Jeffersontown | 7.9% | 3.8%(+4.03)#45 | 4.9%(+2.97)#3,314 |
| 46. | Hurstbourne | 7.9% | 3.8%(+4.01)#46 | 4.9%(+2.96)#3,326 |
| 47. | White Plains | 7.7% | 3.8%(+3.86)#47 | 4.9%(+2.80)#3,442 |
| 48. | East Bernstadt | 7.6% | 3.8%(+3.74)#48 | 4.9%(+2.68)#3,552 |
| 49. | Island | 7.3% | 3.8%(+3.48)#49 | 4.9%(+2.42)#3,738 |
| 50. | Hills And Dales | 7.3% | 3.8%(+3.48)#50 | 4.9%(+2.42)#3,742 |
| 51. | Mockingbird Valley | 7.3% | 3.8%(+3.46)#51 | 4.9%(+2.40)#3,759 |
| 52. | Irvington | 7.1% | 3.8%(+3.31)#52 | 4.9%(+2.25)#3,864 |
| 53. | Shively | 7.1% | 3.8%(+3.28)#53 | 4.9%(+2.23)#3,920 |
| 54. | Benton | 7.1% | 3.8%(+3.23)#54 | 4.9%(+2.17)#3,970 |
| 55. | Irvine | 7.0% | 3.8%(+3.19)#55 | 4.9%(+2.14)#3,999 |
| 56. | Lynch | 7.0% | 3.8%(+3.16)#56 | 4.9%(+2.11)#4,025 |
| 57. | Frankfort | 7.0% | 3.8%(+3.15)#57 | 4.9%(+2.09)#4,035 |
| 58. | Hendron | 6.9% | 3.8%(+3.11)#58 | 4.9%(+2.06)#4,081 |
| 59. | Manchester | 6.9% | 3.8%(+3.06)#59 | 4.9%(+2.00)#4,124 |
| 60. | Crestwood | 6.8% | 3.8%(+2.98)#60 | 4.9%(+1.92)#4,206 |
| 61. | Cambridge | 6.8% | 3.8%(+2.94)#61 | 4.9%(+1.89)#4,243 |
| 62. | Allen | 6.7% | 3.8%(+2.83)#62 | 4.9%(+1.77)#4,370 |
| 63. | Westwood | 6.5% | 3.8%(+2.68)#63 | 4.9%(+1.62)#4,544 |
| 64. | Langdon Place | 6.5% | 3.8%(+2.64)#64 | 4.9%(+1.58)#4,581 |
| 65. | Burlington | 6.4% | 3.8%(+2.58)#65 | 4.9%(+1.52)#4,648 |
| 66. | Radcliff | 6.3% | 3.8%(+2.47)#66 | 4.9%(+1.41)#4,775 |
| 67. | Seneca Gardens | 6.3% | 3.8%(+2.45)#67 | 4.9%(+1.39)#4,793 |
| 68. | Erlanger | 6.3% | 3.8%(+2.43)#68 | 4.9%(+1.37)#4,807 |
| 69. | Campbellsburg | 6.2% | 3.8%(+2.41)#69 | 4.9%(+1.36)#4,833 |
| 70. | Crescent Springs | 6.2% | 3.8%(+2.34)#70 | 4.9%(+1.28)#4,918 |
| 71. | Mount Sterling | 6.1% | 3.8%(+2.31)#71 | 4.9%(+1.25)#4,957 |
| 72. | Murray Hill | 6.1% | 3.8%(+2.30)#72 | 4.9%(+1.25)#4,970 |
| 73. | Druid Hills | 6.1% | 3.8%(+2.28)#73 | 4.9%(+1.22)#5,002 |
| 74. | West Buechel | 6.1% | 3.8%(+2.27)#74 | 4.9%(+1.21)#5,010 |
| 75. | Fincastle | 6.0% | 3.8%(+2.18)#75 | 4.9%(+1.12)#5,139 |
| 76. | Lawrenceburg | 5.9% | 3.8%(+2.07)#76 | 4.9%(+1.01)#5,269 |
| 77. | Ghent | 5.9% | 3.8%(+2.05)#77 | 4.9%(+0.988)#5,318 |
| 78. | Owingsville | 5.8% | 3.8%(+1.92)#78 | 4.9%(+0.865)#5,470 |
| 79. | Wilder | 5.8% | 3.8%(+1.92)#79 | 4.9%(+0.858)#5,481 |
| 80. | Simpsonville | 5.7% | 3.8%(+1.91)#80 | 4.9%(+0.849)#5,489 |
| 81. | Dawson Springs | 5.7% | 3.8%(+1.88)#81 | 4.9%(+0.820)#5,521 |
| 82. | Fort Mitchell | 5.6% | 3.8%(+1.78)#82 | 4.9%(+0.719)#5,660 |
| 83. | Bellemeade | 5.6% | 3.8%(+1.76)#83 | 4.9%(+0.702)#5,689 |
| 84. | St Matthews | 5.6% | 3.8%(+1.74)#84 | 4.9%(+0.682)#5,716 |
| 85. | Audubon Park | 5.5% | 3.8%(+1.65)#85 | 4.9%(+0.588)#5,881 |
| 86. | Meadow Vale | 5.4% | 3.8%(+1.60)#86 | 4.9%(+0.541)#5,948 |
| 87. | Southgate | 5.4% | 3.8%(+1.55)#87 | 4.9%(+0.491)#6,019 |
| 88. | Sycamore | 5.4% | 3.8%(+1.52)#88 | 4.9%(+0.463)#6,076 |
| 89. | Shepherdsville | 5.3% | 3.8%(+1.51)#89 | 4.9%(+0.454)#6,087 |
| 90. | Sadieville | 5.3% | 3.8%(+1.43)#90 | 4.9%(+0.369)#6,227 |
| 91. | Franklin | 5.2% | 3.8%(+1.41)#91 | 4.9%(+0.352)#6,267 |
| 92. | Crestview | 5.1% | 3.8%(+1.31)#92 | 4.9%(+0.253)#6,434 |
| 93. | Independence | 5.1% | 3.8%(+1.27)#93 | 4.9%(+0.215)#6,495 |
| 94. | Berea | 5.1% | 3.8%(+1.24)#94 | 4.9%(+0.178)#6,551 |
| 95. | Goose Creek | 5.0% | 3.8%(+1.21)#95 | 4.9%(+0.148)#6,605 |
| 96. | Parkway Village | 5.0% | 3.8%(+1.16)#96 | 4.9%(+0.106)#6,682 |
| 97. | Melbourne | 5.0% | 3.8%(+1.16)#97 | 4.9%(+0.106)#6,684 |
| 98. | Trenton | 5.0% | 3.8%(+1.16)#98 | 4.9%(+0.106)#6,693 |
| 99. | Campbellsville | 4.9% | 3.8%(+1.06)#99 | 4.9%(-0.000)#6,858 |
| 100. | Hindman | 4.9% | 3.8%(+1.04)#100 | 4.9%(-0.016)#6,901 |
Common Questions
What are the Top 10 Cities with the Highest Percentage of Population with a Degree in Computers and Mathematics in Kentucky?
Top 10 Cities with the Highest Percentage of Population with a Degree in Computers and Mathematics in Kentucky are:
#1
50.0%
#2
40.9%
#3
40.0%
#4
29.4%
#5
27.8%
#6
25.3%
#7
23.7%
#8
23.0%
#9
21.3%
#10
20.0%
What city has the Highest Percentage of Population with a Degree in Computers and Mathematics in Kentucky?
Ewing has the Highest Percentage of Population with a Degree in Computers and Mathematics in Kentucky with 50.0%.
What is the Percentage of Population with a Degree in Computers and Mathematics in the State of Kentucky?
Percentage of Population with a Degree in Computers and Mathematics in Kentucky is 3.8%.
What is the Percentage of Population with a Degree in Computers and Mathematics in the United States?
Percentage of Population with a Degree in Computers and Mathematics in the United States is 4.9%.