Soviet Union Disability Age 5 to 17

COMPARE

Soviet Union
Race
Ancestry
AfghanAfricanAlaska NativeAlaskan AthabascanAlbanianAleutAlsatianAmericanApacheArabArapahoArgentineanArmenianAssyrian/Chaldean/SyriacAustralianAustrianBahamianBangladeshiBarbadianBasqueBelgianBelizeanBermudanBhutaneseBlackfeetBolivianBrazilianBritishBritish West IndianBulgarianBurmeseCajunCambodianCanadianCape VerdeanCarpatho RusynCelticCentral AmericanCentral American IndianCherokeeCheyenneChickasawChileanChineseChippewaChoctawColombianColvilleComancheCosta RicanCreeCreekCroatianCrowCubanCypriotCzechCzechoslovakianDanishDelawareDominicanDutchDutch West IndianEastern EuropeanEcuadorianEgyptianEnglishEstonianEthiopianEuropeanFijianFilipinoFinnishFrenchFrench American IndianFrench CanadianGermanGerman RussianGhanaianGreekGuamanian/ChamorroGuatemalanGuyaneseHaitianHmongHonduranHopiHoumaHungarianIcelanderIndian (Asian)IndonesianInupiatIranianIraqiIrishIroquoisIsraeliItalianJamaicanJapaneseJordanianKenyanKiowaKoreanLaotianLatvianLebaneseLiberianLithuanianLumbeeLuxembourgerMacedonianMalaysianMalteseMarshalleseMenomineeMexicanMexican American IndianMongolianMoroccanNative HawaiianNavajoNepaleseNew ZealanderNicaraguanNigerianNorthern EuropeanNorwegianOkinawanOsageOttawaPaiutePakistaniPalestinianPanamanianParaguayanPennsylvania GermanPeruvianPimaPolishPortuguesePotawatomiPuebloPuerto RicanPuget Sound SalishRomanianRussianSalvadoranSamoanScandinavianScotch-IrishScottishSeminoleSenegaleseSerbianShoshoneSierra LeoneanSiouxSlavicSlovakSloveneSomaliSouth AfricanSouth AmericanSouth American IndianSoviet UnionSpaniardSpanishSpanish AmericanSpanish American IndianSri LankanSubsaharan AfricanSudaneseSwedishSwissSyrianTaiwaneseThaiTlingit-HaidaTohono O'OdhamTonganTrinidadian and TobagonianTsimshianTurkishU.S. Virgin IslanderUgandanUkrainianUruguayanUteVenezuelanVietnameseWelshWest IndianYakamaYaquiYugoslavianYumanYup'ikZimbabwean
Immigration
NonimmigrantsImmigrantsAfghanistanAfricaAlbaniaArgentinaArmeniaAsiaAustraliaAustriaBahamasBangladeshBarbadosBelarusBelgiumBelizeBoliviaBosnia and HerzegovinaBrazilBulgariaBurma/MyanmarCabo VerdeCambodiaCameroonCanadaCaribbeanCentral AmericaChileChinaColombiaCongoCosta RicaCroatiaCubaCzechoslovakiaDenmarkDominicaDominican RepublicEastern AfricaEastern AsiaEastern EuropeEcuadorEgyptEl SalvadorEnglandEritreaEthiopiaEuropeFijiFranceGermanyGhanaGreeceGrenadaGuatemalaGuyanaHaitiHondurasHong KongHungaryIndiaIndonesiaIranIraqIrelandIsraelItalyJamaicaJapanJordanKazakhstanKenyaKoreaKuwaitLaosLatin AmericaLatviaLebanonLiberiaLithuaniaMalaysiaMexicoMicronesiaMiddle AfricaMoldovaMoroccoNepalNetherlandsNicaraguaNigeriaNorth AmericaNorth MacedoniaNorthern AfricaNorthern EuropeNorwayOceaniaPakistanPanamaPeruPhilippinesPolandPortugalRomaniaRussiaSaudi ArabiaScotlandSenegalSerbiaSierra LeoneSingaporeSomaliaSouth AfricaSouth AmericaSouth Central AsiaSouth Eastern AsiaSouthern EuropeSpainSri LankaSt. Vincent and the GrenadinesSudanSwedenSwitzerlandSyriaTaiwanThailandTrinidad and TobagoTurkeyUgandaUkraineUruguayUzbekistanVenezuelaVietnamWest IndiesWestern AfricaWestern AsiaWestern EuropeYemenZaireZimbabweAzores
Select to Compare
Race
Ancestry
AfghanAfricanAlaska NativeAlaskan AthabascanAlbanianAleutAlsatianAmericanApacheArabArapahoArgentineanArmenianAssyrian/Chaldean/SyriacAustralianAustrianBahamianBangladeshiBarbadianBasqueBelgianBelizeanBermudanBhutaneseBlackfeetBolivianBrazilianBritishBritish West IndianBulgarianBurmeseCajunCambodianCanadianCape VerdeanCarpatho RusynCelticCentral AmericanCentral American IndianCherokeeCheyenneChickasawChileanChineseChippewaChoctawColombianColvilleComancheCosta RicanCreeCreekCroatianCrowCubanCypriotCzechCzechoslovakianDanishDelawareDominicanDutchDutch West IndianEastern EuropeanEcuadorianEgyptianEnglishEstonianEthiopianEuropeanFijianFilipinoFinnishFrenchFrench American IndianFrench CanadianGermanGerman RussianGhanaianGreekGuamanian/ChamorroGuatemalanGuyaneseHaitianHmongHonduranHopiHoumaHungarianIcelanderIndian (Asian)IndonesianInupiatIranianIraqiIrishIroquoisIsraeliItalianJamaicanJapaneseJordanianKenyanKiowaKoreanLaotianLatvianLebaneseLiberianLithuanianLumbeeLuxembourgerMacedonianMalaysianMalteseMarshalleseMenomineeMexicanMexican American IndianMongolianMoroccanNative HawaiianNavajoNepaleseNew ZealanderNicaraguanNigerianNorthern EuropeanNorwegianOkinawanOsageOttawaPaiutePakistaniPalestinianPanamanianParaguayanPennsylvania GermanPeruvianPimaPolishPortuguesePotawatomiPuebloPuerto RicanPuget Sound SalishRomanianRussianSalvadoranSamoanScandinavianScotch-IrishScottishSeminoleSenegaleseSerbianShoshoneSierra LeoneanSiouxSlavicSlovakSloveneSomaliSouth AfricanSouth AmericanSouth American IndianSpaniardSpanishSpanish AmericanSpanish American IndianSri LankanSubsaharan AfricanSudaneseSwedishSwissSyrianTaiwaneseThaiTlingit-HaidaTohono O'OdhamTonganTrinidadian and TobagonianTsimshianTurkishU.S. Virgin IslanderUgandanUkrainianUruguayanUteVenezuelanVietnameseWelshWest IndianYakamaYaquiYugoslavianYumanYup'ikZimbabwean
Immigration
NonimmigrantsImmigrantsAfghanistanAfricaAlbaniaArgentinaArmeniaAsiaAustraliaAustriaBahamasBangladeshBarbadosBelarusBelgiumBelizeBoliviaBosnia and HerzegovinaBrazilBulgariaBurma/MyanmarCabo VerdeCambodiaCameroonCanadaCaribbeanCentral AmericaChileChinaColombiaCongoCosta RicaCroatiaCubaCzechoslovakiaDenmarkDominicaDominican RepublicEastern AfricaEastern AsiaEastern EuropeEcuadorEgyptEl SalvadorEnglandEritreaEthiopiaEuropeFijiFranceGermanyGhanaGreeceGrenadaGuatemalaGuyanaHaitiHondurasHong KongHungaryIndiaIndonesiaIranIraqIrelandIsraelItalyJamaicaJapanJordanKazakhstanKenyaKoreaKuwaitLaosLatin AmericaLatviaLebanonLiberiaLithuaniaMalaysiaMexicoMicronesiaMiddle AfricaMoldovaMoroccoNepalNetherlandsNicaraguaNigeriaNorth AmericaNorth MacedoniaNorthern AfricaNorthern EuropeNorwayOceaniaPakistanPanamaPeruPhilippinesPolandPortugalRomaniaRussiaSaudi ArabiaScotlandSenegalSerbiaSierra LeoneSingaporeSomaliaSouth AfricaSouth AmericaSouth Central AsiaSouth Eastern AsiaSouthern EuropeSpainSri LankaSt. Vincent and the GrenadinesSudanSwedenSwitzerlandSyriaTaiwanThailandTrinidad and TobagoTurkeyUgandaUkraineUruguayUzbekistanVenezuelaVietnamWest IndiesWestern AfricaWestern AsiaWestern EuropeYemenZaireZimbabweAzores
Disability Age 5 to 17
Income
Poverty
Unemployment
Labor Participation
Family Structure
Vehicle Availability
Education Level
Disability

Soviet Union Disability Age 5 to 17
Exceptional

5.0%
DISABILITY | AGE 5 TO 17
100.0/ 100
METRIC RATING
32nd/ 347
METRIC RANK

Soviet Union Disability Age 5 to 17 Correlation Chart

The statistical analysis conducted on geographies consisting of 43,434,016 people shows a mild positive correlation between the proportion of Soviet Union and percentage of population with a disability between the ages 5 and 17 in the United States with a correlation coefficient (R) of 0.391 and weighted average of 5.0%. On average, for every 1% (one percent) increase in Soviet Union within a typical geography, there is an increase of 2.4% in percentage of population with a disability between the ages 5 and 17.
Soviet Union Disability Age 5 to 17
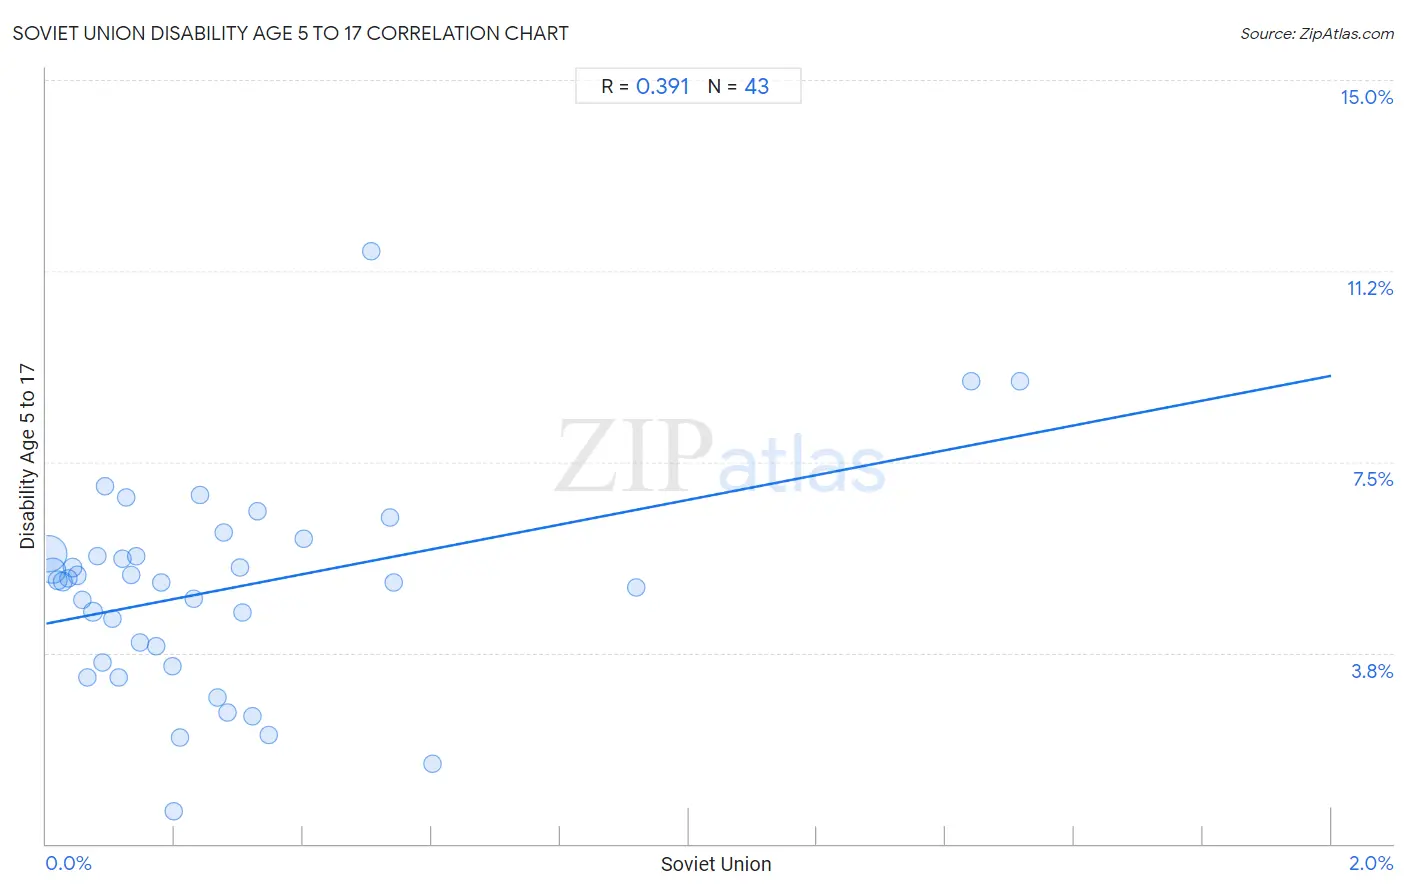
It is essential to understand that the correlation between the percentage of Soviet Union and percentage of population with a disability between the ages 5 and 17 does not imply a direct cause-and-effect relationship. It remains uncertain whether the presence of Soviet Union influences an upward or downward trend in the level of percentage of population with a disability between the ages 5 and 17 within an area, or if Soviet Union simply ended up residing in those areas with higher or lower levels of percentage of population with a disability between the ages 5 and 17 due to other factors.

Demographics Similar to Soviet Union by Disability Age 5 to 17

In terms of disability age 5 to 17, the demographic groups most similar to Soviet Union are Immigrants from Pakistan (5.0%, a difference of 0.040%), Immigrants from Malaysia (5.0%, a difference of 0.28%), Immigrants from Indonesia (5.0%, a difference of 0.32%), Israeli (5.0%, a difference of 0.44%), and Immigrants from Serbia (4.9%, a difference of 0.51%).
DemographicsRating | RankDisability Age 5 to 17
Immigrants from Asia
100.0
/100
|
#25
Exceptional
4.8%
Bhutanese
100.0
/100
|
#26
Exceptional
4.9%
Taiwanese
100.0
/100
|
#27
Exceptional
4.9%
Immigrants from Japan
100.0
/100
|
#28
Exceptional
4.9%
Immigrants from Serbia
100.0
/100
|
#29
Exceptional
4.9%
Immigrants from Malaysia
100.0
/100
|
#30
Exceptional
5.0%
Immigrants from Pakistan
100.0
/100
|
#31
Exceptional
5.0%
Soviet Union
100.0
/100
|
#32
Exceptional
5.0%
Immigrants from Indonesia
100.0
/100
|
#33
Exceptional
5.0%
Israelis
100.0
/100
|
#34
Exceptional
5.0%
Bolivians
100.0
/100
|
#35
Exceptional
5.0%
Immigrants from Egypt
100.0
/100
|
#36
Exceptional
5.0%
Immigrants from Belarus
100.0
/100
|
#37
Exceptional
5.0%
Immigrants from Philippines
100.0
/100
|
#38
Exceptional
5.0%
Immigrants from Argentina
100.0
/100
|
#39
Exceptional
5.0%

Soviet Union Disability Age 5 to 17 Correlation Summary

MeasurementSoviet Union DataDisability Age 5 to 17 Data
Minimum0.0032%0.64%
Maximum1.5%11.6%
Range1.5%11.0%
Mean0.27%5.0%
Median0.18%5.2%
Interquartile 25% (IQ1)0.080%3.6%
Interquartile 75% (IQ3)0.32%5.7%
Interquartile Range (IQR)0.24%2.1%
Standard Deviation (Sample)0.33%2.0%
Standard Deviation (Population)0.32%2.0%

Correlation Details

Soviet Union PercentileSample SizeDisability Age 5 to 17
[
0.0%
-
0.5%
]
0.0032%
24,703,9135.7%
[
0.0%
-
0.5%
]
0.0095%
11,258,3235.4%
[
0.0%
-
0.5%
]
0.018%
1,054,8675.2%
[
0.0%
-
0.5%
]
0.026%
864,7525.2%
[
0.0%
-
0.5%
]
0.034%
932,9425.2%
[
0.0%
-
0.5%
]
0.040%
1,513,9245.4%
[
0.0%
-
0.5%
]
0.049%
675,3775.3%
[
0.0%
-
0.5%
]
0.056%
355,8174.8%
[
0.0%
-
0.5%
]
0.064%
277,0853.3%
[
0.0%
-
0.5%
]
0.073%
255,7334.6%
[
0.0%
-
0.5%
]
0.080%
327,9455.7%
[
0.0%
-
0.5%
]
0.088%
27,2113.6%
[
0.0%
-
0.5%
]
0.092%
41,4407.0%
[
0.0%
-
0.5%
]
0.10%
151,0944.4%
[
0.0%
-
0.5%
]
0.11%
95,6133.3%
[
0.0%
-
0.5%
]
0.12%
72,8345.6%
[
0.0%
-
0.5%
]
0.12%
104,9956.8%
[
0.0%
-
0.5%
]
0.13%
112,9055.3%
[
0.0%
-
0.5%
]
0.14%
34,0485.6%
[
0.0%
-
0.5%
]
0.15%
71,9094.0%
[
0.0%
-
0.5%
]
0.17%
123,3373.9%
[
0.0%
-
0.5%
]
0.18%
6,1275.1%
[
0.0%
-
0.5%
]
0.20%
32,5373.5%
[
0.0%
-
0.5%
]
0.20%
3,5330.64%
[
0.0%
-
0.5%
]
0.21%
17,3662.1%
[
0.0%
-
0.5%
]
0.23%
23,4454.8%
[
0.0%
-
0.5%
]
0.24%
5,4286.8%
[
0.0%
-
0.5%
]
0.27%
60,2312.9%
[
0.0%
-
0.5%
]
0.28%
6,5176.1%
[
0.0%
-
0.5%
]
0.28%
10,3022.6%
[
0.0%
-
0.5%
]
0.30%
8,2795.4%
[
0.0%
-
0.5%
]
0.31%
27,1714.5%
[
0.0%
-
0.5%
]
0.32%
81,1092.5%
[
0.0%
-
0.5%
]
0.33%
20,4116.5%
[
0.0%
-
0.5%
]
0.35%
4,0412.1%
[
0.0%
-
0.5%
]
0.40%
1,0006.0%
[
0.5%
-
1.0%
]
0.51%
8,29811.6%
[
0.5%
-
1.0%
]
0.54%
15,4976.4%
[
0.5%
-
1.0%
]
0.54%
27,5145.1%
[
0.5%
-
1.0%
]
0.60%
16,8081.6%
[
0.5%
-
1.0%
]
0.92%
2,0675.0%
[
1.0%
-
1.5%
]
1.44%
1399.1%
[
1.5%
-
2.0%
]
1.52%
1329.1%