Immigrants from Iraq Disability Age 5 to 17
COMPARE
Immigrants from Iraq
Select to Compare
Disability Age 5 to 17
Immigrants from Iraq Disability Age 5 to 17
5.6%
DISABILITY | AGE 5 TO 17
53.9/ 100
METRIC RATING
171st/ 347
METRIC RANK
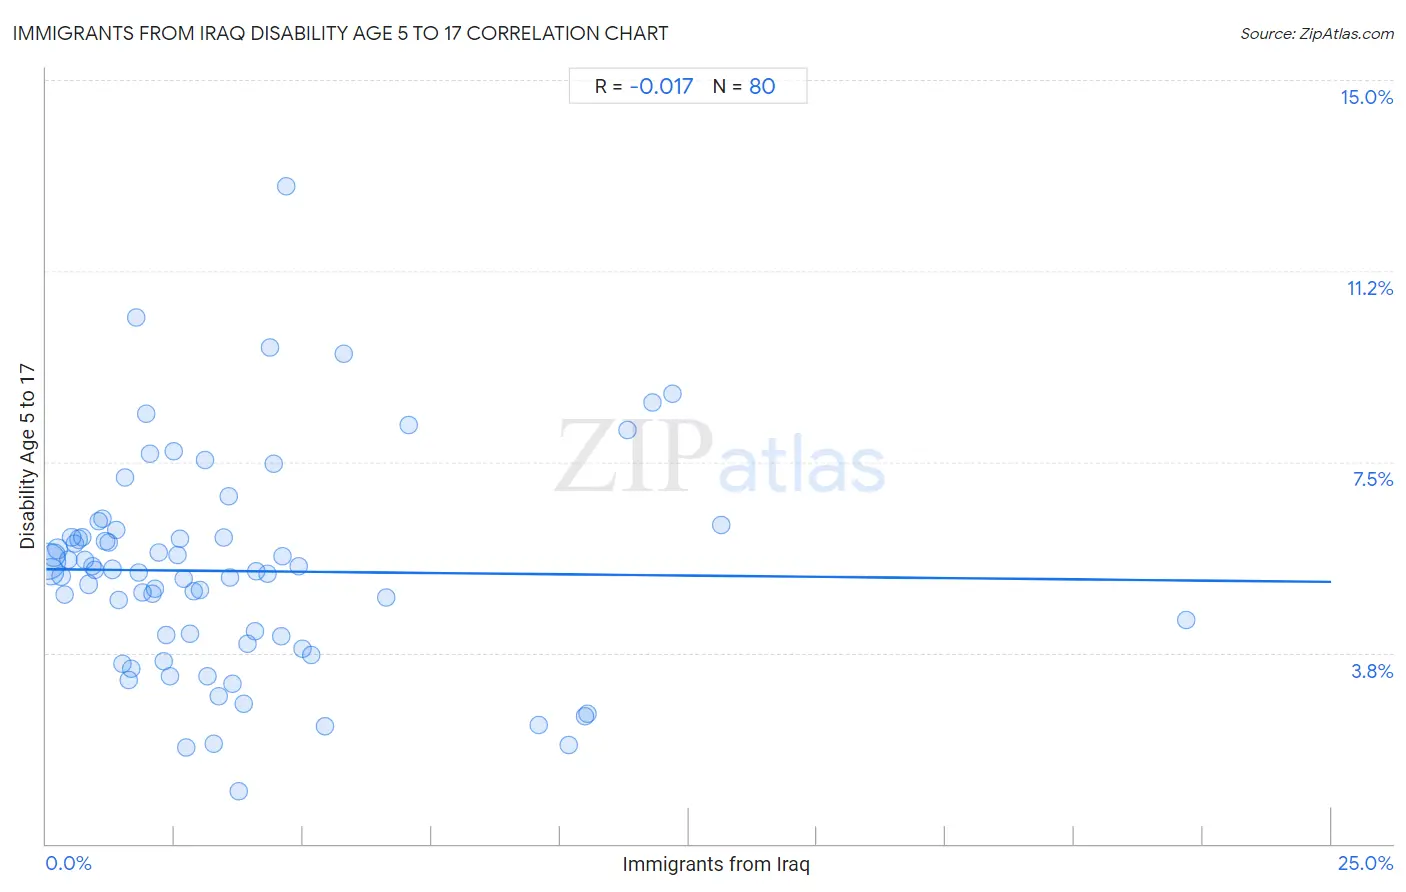
Immigrants from Iraq Disability Age 5 to 17 Correlation Chart
The statistical analysis conducted on geographies consisting of 194,133,073 people shows no correlation between the proportion of Immigrants from Iraq and percentage of population with a disability between the ages 5 and 17 in the United States with a correlation coefficient (R) of -0.017 and weighted average of 5.6%. On average, for every 1% (one percent) increase in Immigrants from Iraq within a typical geography, there is a decrease of 0.0099% in percentage of population with a disability between the ages 5 and 17.
It is essential to understand that the correlation between the percentage of Immigrants from Iraq and percentage of population with a disability between the ages 5 and 17 does not imply a direct cause-and-effect relationship. It remains uncertain whether the presence of Immigrants from Iraq influences an upward or downward trend in the level of percentage of population with a disability between the ages 5 and 17 within an area, or if Immigrants from Iraq simply ended up residing in those areas with higher or lower levels of percentage of population with a disability between the ages 5 and 17 due to other factors.
Demographics Similar to Immigrants from Iraq by Disability Age 5 to 17
In terms of disability age 5 to 17, the demographic groups most similar to Immigrants from Iraq are Serbian (5.6%, a difference of 0.0%), Immigrants from Norway (5.6%, a difference of 0.090%), Iraqi (5.6%, a difference of 0.11%), Ukrainian (5.6%, a difference of 0.12%), and Uruguayan (5.6%, a difference of 0.15%).
| Demographics | Rating | Rank | Disability Age 5 to 17 |
| Immigrants from Scotland | 61.9 /100 | #164 | Good 5.6% |
| Lebanese | 61.4 /100 | #165 | Good 5.6% |
| Greeks | 60.6 /100 | #166 | Good 5.6% |
| Immigrants from Burma/Myanmar | 59.3 /100 | #167 | Average 5.6% |
| Iraqis | 56.0 /100 | #168 | Average 5.6% |
| Immigrants from Norway | 55.7 /100 | #169 | Average 5.6% |
| Serbians | 54.0 /100 | #170 | Average 5.6% |
| Immigrants from Iraq | 53.9 /100 | #171 | Average 5.6% |
| Ukrainians | 51.5 /100 | #172 | Average 5.6% |
| Uruguayans | 51.0 /100 | #173 | Average 5.6% |
| Costa Ricans | 50.0 /100 | #174 | Average 5.6% |
| Shoshone | 49.4 /100 | #175 | Average 5.6% |
| Immigrants from Central America | 49.4 /100 | #176 | Average 5.6% |
| Immigrants from Western Europe | 47.8 /100 | #177 | Average 5.6% |
| Immigrants from Trinidad and Tobago | 47.6 /100 | #178 | Average 5.6% |
Immigrants from Iraq Disability Age 5 to 17 Correlation Summary
| Measurement | Immigrants from Iraq Data | Disability Age 5 to 17 Data |
| Minimum | 0.030% | 1.0% |
| Maximum | 22.2% | 12.9% |
| Range | 22.1% | 11.9% |
| Mean | 3.6% | 5.4% |
| Median | 2.6% | 5.3% |
| Interquartile 25% (IQ1) | 1.3% | 4.0% |
| Interquartile 75% (IQ3) | 4.4% | 6.0% |
| Interquartile Range (IQR) | 3.1% | 2.0% |
| Standard Deviation (Sample) | 3.7% | 2.1% |
| Standard Deviation (Population) | 3.7% | 2.1% |
Correlation Details
| Immigrants from Iraq Percentile | Sample Size | Disability Age 5 to 17 |
[ 0.0% - 0.5% ] 0.030% | 91,269,312 | 5.5% |
[ 0.0% - 0.5% ] 0.097% | 38,009,380 | 5.3% |
[ 0.0% - 0.5% ] 0.16% | 22,574,924 | 5.7% |
[ 0.0% - 0.5% ] 0.23% | 11,017,656 | 5.8% |
[ 0.0% - 0.5% ] 0.29% | 6,954,459 | 5.3% |
[ 0.0% - 0.5% ] 0.36% | 3,882,366 | 4.9% |
[ 0.0% - 0.5% ] 0.43% | 3,395,535 | 5.6% |
[ 0.0% - 0.5% ] 0.49% | 2,262,312 | 6.0% |
[ 0.5% - 1.0% ] 0.56% | 1,342,266 | 5.9% |
[ 0.5% - 1.0% ] 0.63% | 1,572,175 | 6.0% |
[ 0.5% - 1.0% ] 0.69% | 2,253,097 | 6.0% |
[ 0.5% - 1.0% ] 0.75% | 820,101 | 5.6% |
[ 0.5% - 1.0% ] 0.82% | 834,189 | 5.1% |
[ 0.5% - 1.0% ] 0.89% | 693,999 | 5.4% |
[ 0.5% - 1.0% ] 0.96% | 923,200 | 5.4% |
[ 1.0% - 1.5% ] 1.01% | 512,613 | 6.3% |
[ 1.0% - 1.5% ] 1.09% | 434,001 | 6.4% |
[ 1.0% - 1.5% ] 1.15% | 656,527 | 5.9% |
[ 1.0% - 1.5% ] 1.21% | 303,626 | 5.9% |
[ 1.0% - 1.5% ] 1.28% | 328,050 | 5.4% |
[ 1.0% - 1.5% ] 1.36% | 167,460 | 6.2% |
[ 1.0% - 1.5% ] 1.41% | 183,610 | 4.8% |
[ 1.0% - 1.5% ] 1.49% | 253,196 | 3.5% |
[ 1.5% - 2.0% ] 1.53% | 94,650 | 7.2% |
[ 1.5% - 2.0% ] 1.60% | 38,227 | 3.2% |
[ 1.5% - 2.0% ] 1.66% | 106,999 | 3.4% |
[ 1.5% - 2.0% ] 1.75% | 58,414 | 10.3% |
[ 1.5% - 2.0% ] 1.81% | 123,641 | 5.3% |
[ 1.5% - 2.0% ] 1.88% | 71,744 | 4.9% |
[ 1.5% - 2.0% ] 1.93% | 131,150 | 8.4% |
[ 2.0% - 2.5% ] 2.01% | 222,859 | 7.7% |
[ 2.0% - 2.5% ] 2.07% | 109,104 | 4.9% |
[ 2.0% - 2.5% ] 2.12% | 71,140 | 5.0% |
[ 2.0% - 2.5% ] 2.20% | 115,707 | 5.7% |
[ 2.0% - 2.5% ] 2.28% | 66,618 | 3.6% |
[ 2.0% - 2.5% ] 2.34% | 49,287 | 4.1% |
[ 2.0% - 2.5% ] 2.40% | 2,713 | 3.3% |
[ 2.0% - 2.5% ] 2.48% | 13,960 | 7.7% |
[ 2.5% - 3.0% ] 2.56% | 130,976 | 5.7% |
[ 2.5% - 3.0% ] 2.60% | 65,411 | 6.0% |
[ 2.5% - 3.0% ] 2.68% | 115,504 | 5.2% |
[ 2.5% - 3.0% ] 2.72% | 41,902 | 1.9% |
[ 2.5% - 3.0% ] 2.81% | 74,389 | 4.1% |
[ 2.5% - 3.0% ] 2.88% | 130,465 | 4.9% |
[ 2.5% - 3.0% ] 2.98% | 238,915 | 5.0% |
[ 3.0% - 3.5% ] 3.08% | 4,028 | 7.5% |
[ 3.0% - 3.5% ] 3.14% | 509 | 3.3% |
[ 3.0% - 3.5% ] 3.26% | 54,569 | 2.0% |
[ 3.0% - 3.5% ] 3.34% | 7,444 | 2.9% |
[ 3.0% - 3.5% ] 3.44% | 110,117 | 6.0% |
[ 3.5% - 4.0% ] 3.54% | 16,469 | 6.8% |
[ 3.5% - 4.0% ] 3.58% | 36,981 | 5.2% |
[ 3.5% - 4.0% ] 3.62% | 15,017 | 3.1% |
[ 3.5% - 4.0% ] 3.75% | 33,170 | 1.0% |
[ 3.5% - 4.0% ] 3.85% | 67,076 | 2.7% |
[ 3.5% - 4.0% ] 3.91% | 74,049 | 3.9% |
[ 4.0% - 4.5% ] 4.05% | 62,474 | 4.2% |
[ 4.0% - 4.5% ] 4.08% | 25,051 | 5.4% |
[ 4.0% - 4.5% ] 4.30% | 16,850 | 5.3% |
[ 4.0% - 4.5% ] 4.36% | 9,951 | 9.7% |
[ 4.0% - 4.5% ] 4.43% | 16,742 | 7.5% |
[ 4.5% - 5.0% ] 4.56% | 57,421 | 4.1% |
[ 4.5% - 5.0% ] 4.60% | 6,018 | 5.6% |
[ 4.5% - 5.0% ] 4.67% | 214 | 12.9% |
[ 4.5% - 5.0% ] 4.91% | 30,802 | 5.4% |
[ 4.5% - 5.0% ] 4.98% | 53,044 | 3.8% |
[ 5.0% - 5.5% ] 5.16% | 63,085 | 3.7% |
[ 5.0% - 5.5% ] 5.42% | 22,152 | 2.3% |
[ 5.5% - 6.0% ] 5.78% | 34,004 | 9.6% |
[ 6.5% - 7.0% ] 6.61% | 27,848 | 4.8% |
[ 7.0% - 7.5% ] 7.05% | 69,638 | 8.2% |
[ 9.5% - 10.0% ] 9.58% | 21,587 | 2.3% |
[ 10.0% - 10.5% ] 10.17% | 22,430 | 2.0% |
[ 10.0% - 10.5% ] 10.48% | 33,174 | 2.5% |
[ 10.5% - 11.0% ] 10.54% | 45,937 | 2.6% |
[ 11.0% - 11.5% ] 11.30% | 34,921 | 8.1% |
[ 11.5% - 12.0% ] 11.80% | 59,775 | 8.7% |
[ 12.0% - 12.5% ] 12.19% | 105,721 | 8.8% |
[ 13.0% - 13.5% ] 13.14% | 133,744 | 6.3% |
[ 22.0% - 22.5% ] 22.18% | 43,232 | 4.4% |