Immigrants from Western Europe Self-Care Disability

COMPARE

Immigrants from Western Europe
Race
Ancestry
AfghanAfricanAlaska NativeAlaskan AthabascanAlbanianAleutAlsatianAmericanApacheArabArapahoArgentineanArmenianAssyrian/Chaldean/SyriacAustralianAustrianBahamianBangladeshiBarbadianBasqueBelgianBelizeanBermudanBhutaneseBlackfeetBolivianBrazilianBritishBritish West IndianBulgarianBurmeseCajunCambodianCanadianCape VerdeanCarpatho RusynCelticCentral AmericanCentral American IndianCherokeeCheyenneChickasawChileanChineseChippewaChoctawColombianColvilleComancheCosta RicanCreeCreekCroatianCrowCubanCypriotCzechCzechoslovakianDanishDelawareDominicanDutchDutch West IndianEastern EuropeanEcuadorianEgyptianEnglishEstonianEthiopianEuropeanFijianFilipinoFinnishFrenchFrench American IndianFrench CanadianGermanGerman RussianGhanaianGreekGuamanian/ChamorroGuatemalanGuyaneseHaitianHmongHonduranHopiHoumaHungarianIcelanderIndian (Asian)IndonesianInupiatIranianIraqiIrishIroquoisIsraeliItalianJamaicanJapaneseJordanianKenyanKiowaKoreanLaotianLatvianLebaneseLiberianLithuanianLumbeeLuxembourgerMacedonianMalaysianMalteseMarshalleseMenomineeMexicanMexican American IndianMongolianMoroccanNative HawaiianNavajoNepaleseNew ZealanderNicaraguanNigerianNorthern EuropeanNorwegianOkinawanOsageOttawaPaiutePakistaniPalestinianPanamanianParaguayanPennsylvania GermanPeruvianPimaPolishPortuguesePotawatomiPuebloPuerto RicanPuget Sound SalishRomanianRussianSalvadoranSamoanScandinavianScotch-IrishScottishSeminoleSenegaleseSerbianShoshoneSierra LeoneanSiouxSlavicSlovakSloveneSomaliSouth AfricanSouth AmericanSouth American IndianSoviet UnionSpaniardSpanishSpanish AmericanSpanish American IndianSri LankanSubsaharan AfricanSudaneseSwedishSwissSyrianTaiwaneseThaiTlingit-HaidaTohono O'OdhamTonganTrinidadian and TobagonianTsimshianTurkishU.S. Virgin IslanderUgandanUkrainianUruguayanUteVenezuelanVietnameseWelshWest IndianYakamaYaquiYugoslavianYumanYup'ikZimbabwean
Immigration
NonimmigrantsImmigrantsAfghanistanAfricaAlbaniaArgentinaArmeniaAsiaAustraliaAustriaBahamasBangladeshBarbadosBelarusBelgiumBelizeBoliviaBosnia and HerzegovinaBrazilBulgariaBurma/MyanmarCabo VerdeCambodiaCameroonCanadaCaribbeanCentral AmericaChileChinaColombiaCongoCosta RicaCroatiaCubaCzechoslovakiaDenmarkDominicaDominican RepublicEastern AfricaEastern AsiaEastern EuropeEcuadorEgyptEl SalvadorEnglandEritreaEthiopiaEuropeFijiFranceGermanyGhanaGreeceGrenadaGuatemalaGuyanaHaitiHondurasHong KongHungaryIndiaIndonesiaIranIraqIrelandIsraelItalyJamaicaJapanJordanKazakhstanKenyaKoreaKuwaitLaosLatin AmericaLatviaLebanonLiberiaLithuaniaMalaysiaMexicoMicronesiaMiddle AfricaMoldovaMoroccoNepalNetherlandsNicaraguaNigeriaNorth AmericaNorth MacedoniaNorthern AfricaNorthern EuropeNorwayOceaniaPakistanPanamaPeruPhilippinesPolandPortugalRomaniaRussiaSaudi ArabiaScotlandSenegalSerbiaSierra LeoneSingaporeSomaliaSouth AfricaSouth AmericaSouth Central AsiaSouth Eastern AsiaSouthern EuropeSpainSri LankaSt. Vincent and the GrenadinesSudanSwedenSwitzerlandSyriaTaiwanThailandTrinidad and TobagoTurkeyUgandaUkraineUruguayUzbekistanVenezuelaVietnamWest IndiesWestern AfricaWestern AsiaWestern EuropeYemenZaireZimbabweAzores
Select to Compare
Race
Ancestry
AfghanAfricanAlaska NativeAlaskan AthabascanAlbanianAleutAlsatianAmericanApacheArabArapahoArgentineanArmenianAssyrian/Chaldean/SyriacAustralianAustrianBahamianBangladeshiBarbadianBasqueBelgianBelizeanBermudanBhutaneseBlackfeetBolivianBrazilianBritishBritish West IndianBulgarianBurmeseCajunCambodianCanadianCape VerdeanCarpatho RusynCelticCentral AmericanCentral American IndianCherokeeCheyenneChickasawChileanChineseChippewaChoctawColombianColvilleComancheCosta RicanCreeCreekCroatianCrowCubanCypriotCzechCzechoslovakianDanishDelawareDominicanDutchDutch West IndianEastern EuropeanEcuadorianEgyptianEnglishEstonianEthiopianEuropeanFijianFilipinoFinnishFrenchFrench American IndianFrench CanadianGermanGerman RussianGhanaianGreekGuamanian/ChamorroGuatemalanGuyaneseHaitianHmongHonduranHopiHoumaHungarianIcelanderIndian (Asian)IndonesianInupiatIranianIraqiIrishIroquoisIsraeliItalianJamaicanJapaneseJordanianKenyanKiowaKoreanLaotianLatvianLebaneseLiberianLithuanianLumbeeLuxembourgerMacedonianMalaysianMalteseMarshalleseMenomineeMexicanMexican American IndianMongolianMoroccanNative HawaiianNavajoNepaleseNew ZealanderNicaraguanNigerianNorthern EuropeanNorwegianOkinawanOsageOttawaPaiutePakistaniPalestinianPanamanianParaguayanPennsylvania GermanPeruvianPimaPolishPortuguesePotawatomiPuebloPuerto RicanPuget Sound SalishRomanianRussianSalvadoranSamoanScandinavianScotch-IrishScottishSeminoleSenegaleseSerbianShoshoneSierra LeoneanSiouxSlavicSlovakSloveneSomaliSouth AfricanSouth AmericanSouth American IndianSoviet UnionSpaniardSpanishSpanish AmericanSpanish American IndianSri LankanSubsaharan AfricanSudaneseSwedishSwissSyrianTaiwaneseThaiTlingit-HaidaTohono O'OdhamTonganTrinidadian and TobagonianTsimshianTurkishU.S. Virgin IslanderUgandanUkrainianUruguayanUteVenezuelanVietnameseWelshWest IndianYakamaYaquiYugoslavianYumanYup'ikZimbabwean
Immigration
NonimmigrantsImmigrantsAfghanistanAfricaAlbaniaArgentinaArmeniaAsiaAustraliaAustriaBahamasBangladeshBarbadosBelarusBelgiumBelizeBoliviaBosnia and HerzegovinaBrazilBulgariaBurma/MyanmarCabo VerdeCambodiaCameroonCanadaCaribbeanCentral AmericaChileChinaColombiaCongoCosta RicaCroatiaCubaCzechoslovakiaDenmarkDominicaDominican RepublicEastern AfricaEastern AsiaEastern EuropeEcuadorEgyptEl SalvadorEnglandEritreaEthiopiaEuropeFijiFranceGermanyGhanaGreeceGrenadaGuatemalaGuyanaHaitiHondurasHong KongHungaryIndiaIndonesiaIranIraqIrelandIsraelItalyJamaicaJapanJordanKazakhstanKenyaKoreaKuwaitLaosLatin AmericaLatviaLebanonLiberiaLithuaniaMalaysiaMexicoMicronesiaMiddle AfricaMoldovaMoroccoNepalNetherlandsNicaraguaNigeriaNorth AmericaNorth MacedoniaNorthern AfricaNorthern EuropeNorwayOceaniaPakistanPanamaPeruPhilippinesPolandPortugalRomaniaRussiaSaudi ArabiaScotlandSenegalSerbiaSierra LeoneSingaporeSomaliaSouth AfricaSouth AmericaSouth Central AsiaSouth Eastern AsiaSouthern EuropeSpainSri LankaSt. Vincent and the GrenadinesSudanSwedenSwitzerlandSyriaTaiwanThailandTrinidad and TobagoTurkeyUgandaUkraineUruguayUzbekistanVenezuelaVietnamWest IndiesWestern AfricaWestern AsiaYemenZaireZimbabweAzores
Self-Care Disability
Income
Poverty
Unemployment
Labor Participation
Family Structure
Vehicle Availability
Education Level
Disability

Immigrants from Western Europe Self-Care Disability
Good

2.4%
SELF-CARE DISABILITY
68.6/ 100
METRIC RATING
158th/ 347
METRIC RANK

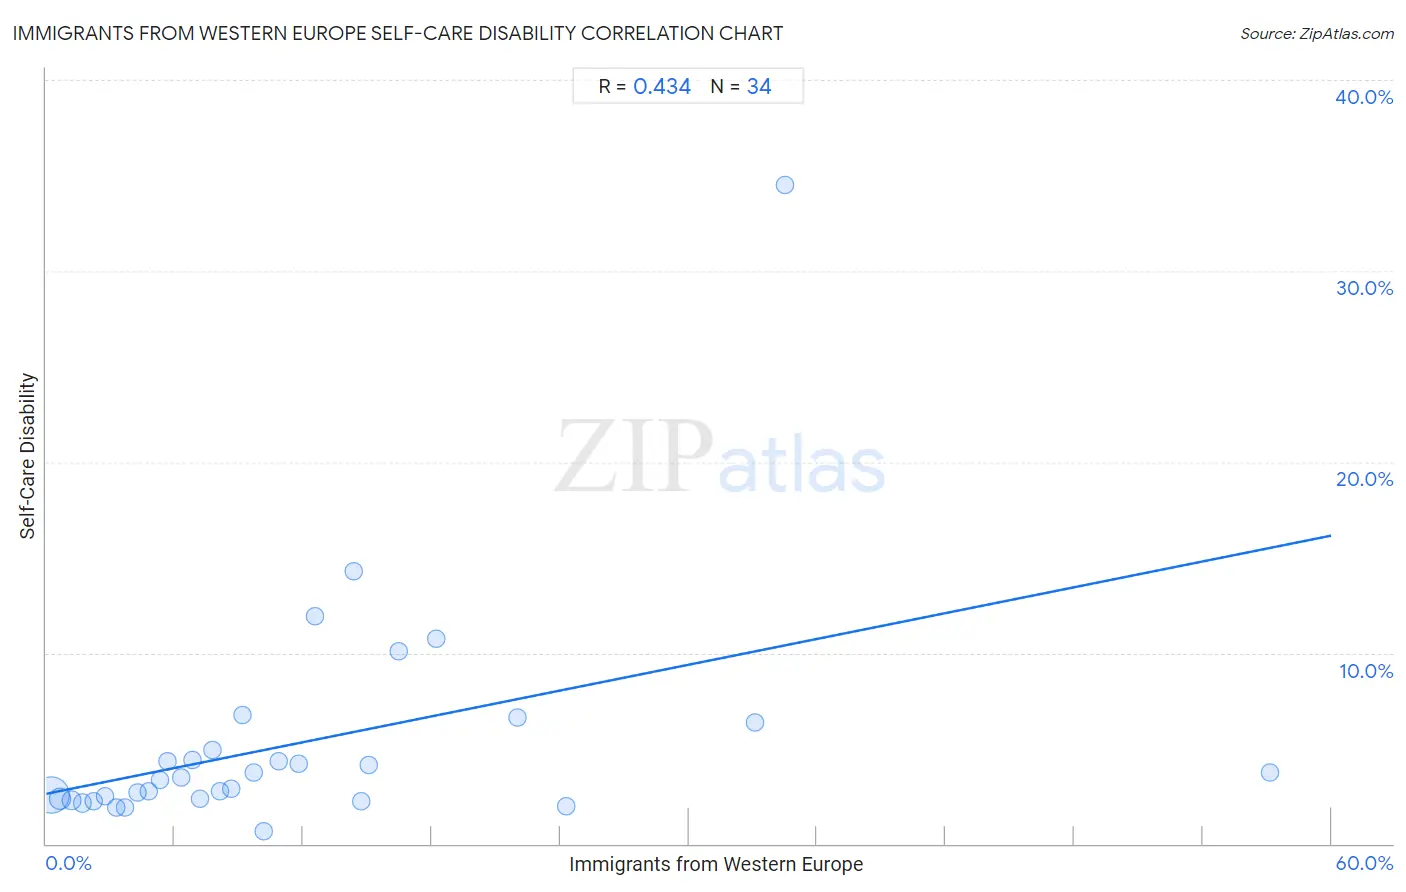
Immigrants from Western Europe Self-Care Disability Correlation Chart

The statistical analysis conducted on geographies consisting of 493,216,023 people shows a moderate positive correlation between the proportion of Immigrants from Western Europe and percentage of population with self-care disability in the United States with a correlation coefficient (R) of 0.434 and weighted average of 2.4%. On average, for every 1% (one percent) increase in Immigrants from Western Europe within a typical geography, there is an increase of 0.23% in percentage of population with self-care disability.
Immigrants from Western Europe Self-Care Disability
It is essential to understand that the correlation between the percentage of Immigrants from Western Europe and percentage of population with self-care disability does not imply a direct cause-and-effect relationship. It remains uncertain whether the presence of Immigrants from Western Europe influences an upward or downward trend in the level of percentage of population with self-care disability within an area, or if Immigrants from Western Europe simply ended up residing in those areas with higher or lower levels of percentage of population with self-care disability due to other factors.

Demographics Similar to Immigrants from Western Europe by Self-Care Disability

In terms of self-care disability, the demographic groups most similar to Immigrants from Western Europe are Immigrants from Italy (2.4%, a difference of 0.0%), Immigrants from Europe (2.4%, a difference of 0.060%), Finnish (2.4%, a difference of 0.090%), Lebanese (2.4%, a difference of 0.11%), and Nigerian (2.4%, a difference of 0.12%).
DemographicsRating | RankSelf-Care Disability
Basques
74.0
/100
|
#151
Good
2.4%
Tlingit-Haida
73.5
/100
|
#152
Good
2.4%
Immigrants from England
73.5
/100
|
#153
Good
2.4%
Italians
72.2
/100
|
#154
Good
2.4%
Pakistanis
71.4
/100
|
#155
Good
2.4%
Nigerians
70.6
/100
|
#156
Good
2.4%
Immigrants from Europe
69.6
/100
|
#157
Good
2.4%
Immigrants from Western Europe
68.6
/100
|
#158
Good
2.4%
Immigrants from Italy
68.5
/100
|
#159
Good
2.4%
Finns
67.0
/100
|
#160
Good
2.4%
Lebanese
66.5
/100
|
#161
Good
2.4%
Somalis
63.7
/100
|
#162
Good
2.5%
German Russians
62.7
/100
|
#163
Good
2.5%
Immigrants from Vietnam
59.3
/100
|
#164
Average
2.5%
Syrians
59.0
/100
|
#165
Average
2.5%

Immigrants from Western Europe Self-Care Disability Correlation Summary

MeasurementImmigrants from Western Europe DataSelf-Care Disability Data
Minimum0.21%0.64%
Maximum57.1%34.5%
Range56.9%33.8%
Mean11.6%5.2%
Median8.4%3.4%
Interquartile 25% (IQ1)4.3%2.4%
Interquartile 75% (IQ3)14.7%4.9%
Interquartile Range (IQR)10.5%2.6%
Standard Deviation (Sample)11.6%6.0%
Standard Deviation (Population)11.5%5.9%

Correlation Details

Immigrants from Western Europe PercentileSample SizeSelf-Care Disability
[
0.0%
-
0.5%
]
0.21%
395,597,0552.5%
[
0.5%
-
1.0%
]
0.66%
77,081,1352.4%
[
1.0%
-
1.5%
]
1.19%
13,167,3662.3%
[
1.5%
-
2.0%
]
1.71%
4,183,5212.1%
[
2.0%
-
2.5%
]
2.20%
2,048,5082.2%
[
2.5%
-
3.0%
]
2.73%
621,3722.5%
[
3.0%
-
3.5%
]
3.25%
202,7151.9%
[
3.5%
-
4.0%
]
3.66%
127,4951.9%
[
4.0%
-
4.5%
]
4.25%
59,3952.7%
[
4.5%
-
5.0%
]
4.80%
31,6292.8%
[
5.0%
-
5.5%
]
5.30%
40,6423.4%
[
5.5%
-
6.0%
]
5.69%
6,7514.3%
[
6.0%
-
6.5%
]
6.28%
6,4803.5%
[
6.5%
-
7.0%
]
6.83%
2,9144.4%
[
7.0%
-
7.5%
]
7.15%
8,1932.4%
[
7.5%
-
8.0%
]
7.74%
8,4584.9%
[
8.0%
-
8.5%
]
8.14%
2,4822.8%
[
8.5%
-
9.0%
]
8.62%
8,4652.9%
[
9.0%
-
9.5%
]
9.16%
2,3586.8%
[
9.5%
-
10.0%
]
9.70%
3,8243.7%
[
10.0%
-
10.5%
]
10.18%
9630.64%
[
10.5%
-
11.0%
]
10.87%
924.3%
[
11.5%
-
12.0%
]
11.81%
1274.2%
[
12.5%
-
13.0%
]
12.55%
50211.9%
[
14.0%
-
14.5%
]
14.35%
41814.3%
[
14.5%
-
15.0%
]
14.71%
1362.2%
[
15.0%
-
15.5%
]
15.04%
8384.1%
[
16.0%
-
16.5%
]
16.47%
83210.1%
[
18.0%
-
18.5%
]
18.19%
83010.7%
[
21.5%
-
22.0%
]
21.98%
916.6%
[
24.0%
-
24.5%
]
24.27%
1031.9%
[
33.0%
-
33.5%
]
33.10%
1426.3%
[
34.0%
-
34.5%
]
34.48%
5834.5%
[
57.0%
-
57.5%
]
57.14%
1333.8%