Immigrants from Brazil Self-Care Disability
COMPARE
Immigrants from Brazil
Select to Compare
Self-Care Disability
Immigrants from Brazil Self-Care Disability
2.3%
SELF-CARE DISABILITY
99.7/ 100
METRIC RATING
50th/ 347
METRIC RANK
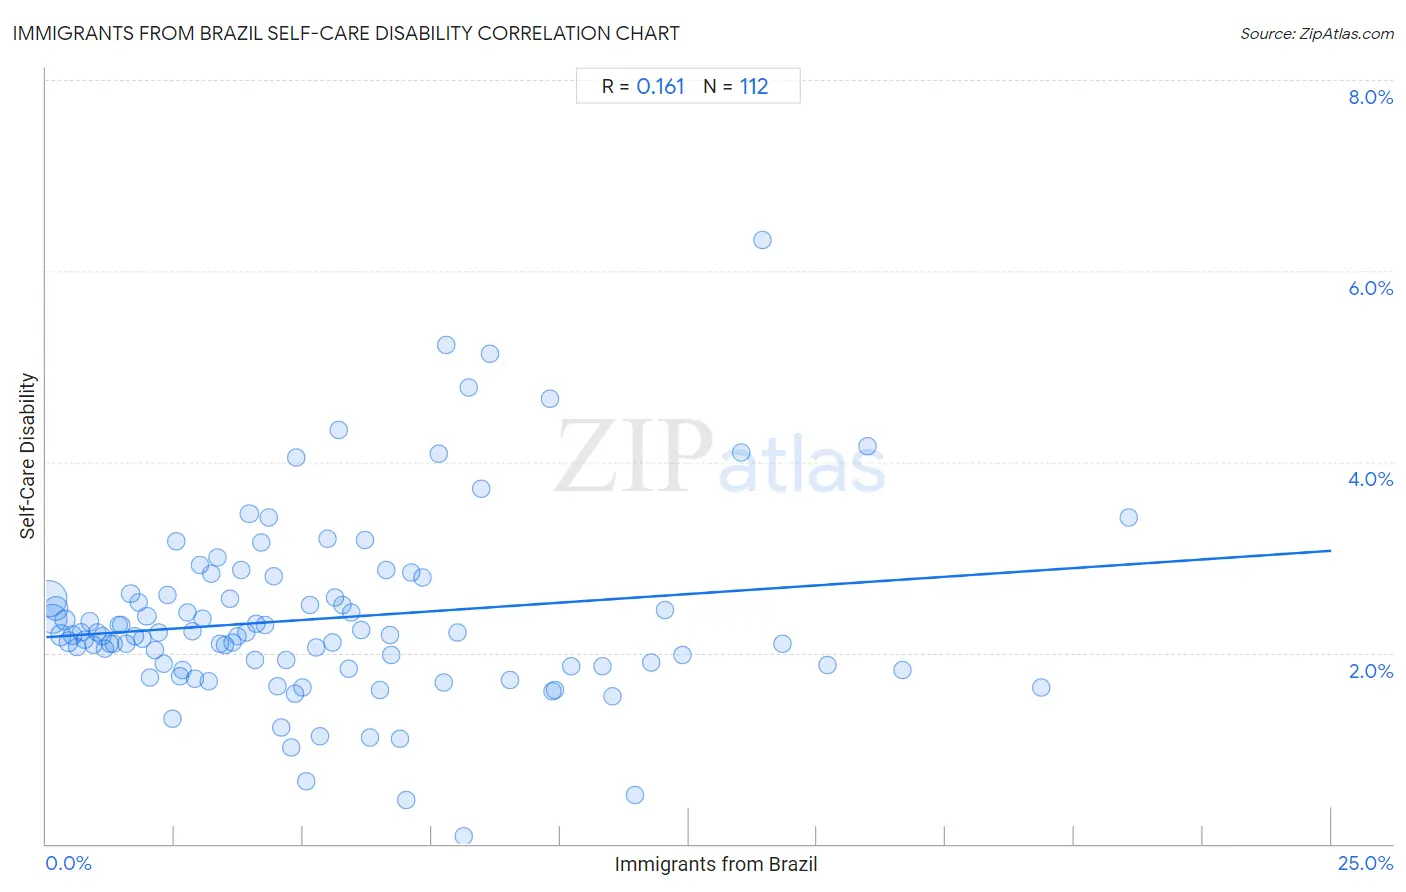
Immigrants from Brazil Self-Care Disability Correlation Chart
The statistical analysis conducted on geographies consisting of 342,700,860 people shows a poor positive correlation between the proportion of Immigrants from Brazil and percentage of population with self-care disability in the United States with a correlation coefficient (R) of 0.161 and weighted average of 2.3%. On average, for every 1% (one percent) increase in Immigrants from Brazil within a typical geography, there is an increase of 0.036% in percentage of population with self-care disability.
It is essential to understand that the correlation between the percentage of Immigrants from Brazil and percentage of population with self-care disability does not imply a direct cause-and-effect relationship. It remains uncertain whether the presence of Immigrants from Brazil influences an upward or downward trend in the level of percentage of population with self-care disability within an area, or if Immigrants from Brazil simply ended up residing in those areas with higher or lower levels of percentage of population with self-care disability due to other factors.
Demographics Similar to Immigrants from Brazil by Self-Care Disability
In terms of self-care disability, the demographic groups most similar to Immigrants from Brazil are Latvian (2.3%, a difference of 0.020%), Kenyan (2.3%, a difference of 0.15%), Immigrants from Serbia (2.3%, a difference of 0.17%), Immigrants from Malaysia (2.3%, a difference of 0.20%), and Australian (2.3%, a difference of 0.20%).
| Demographics | Rating | Rank | Self-Care Disability |
| Immigrants from Pakistan | 99.8 /100 | #43 | Exceptional 2.3% |
| Immigrants from South Africa | 99.8 /100 | #44 | Exceptional 2.3% |
| Norwegians | 99.8 /100 | #45 | Exceptional 2.3% |
| Czechs | 99.8 /100 | #46 | Exceptional 2.3% |
| Jordanians | 99.7 /100 | #47 | Exceptional 2.3% |
| Immigrants from Malaysia | 99.7 /100 | #48 | Exceptional 2.3% |
| Latvians | 99.7 /100 | #49 | Exceptional 2.3% |
| Immigrants from Brazil | 99.7 /100 | #50 | Exceptional 2.3% |
| Kenyans | 99.7 /100 | #51 | Exceptional 2.3% |
| Immigrants from Serbia | 99.6 /100 | #52 | Exceptional 2.3% |
| Australians | 99.6 /100 | #53 | Exceptional 2.3% |
| Argentineans | 99.6 /100 | #54 | Exceptional 2.3% |
| Immigrants from France | 99.6 /100 | #55 | Exceptional 2.3% |
| Immigrants from Eastern Asia | 99.6 /100 | #56 | Exceptional 2.3% |
| Immigrants from Belgium | 99.6 /100 | #57 | Exceptional 2.3% |
Immigrants from Brazil Self-Care Disability Correlation Summary
| Measurement | Immigrants from Brazil Data | Self-Care Disability Data |
| Minimum | 0.039% | 0.076% |
| Maximum | 21.1% | 6.3% |
| Range | 21.0% | 6.3% |
| Mean | 5.4% | 2.4% |
| Median | 4.5% | 2.2% |
| Interquartile 25% (IQ1) | 2.2% | 1.9% |
| Interquartile 75% (IQ3) | 7.2% | 2.6% |
| Interquartile Range (IQR) | 5.0% | 0.73% |
| Standard Deviation (Sample) | 4.3% | 0.97% |
| Standard Deviation (Population) | 4.3% | 0.97% |
Correlation Details
| Immigrants from Brazil Percentile | Sample Size | Self-Care Disability |
[ 0.0% - 0.5% ] 0.039% | 128,434,792 | 2.6% |
[ 0.0% - 0.5% ] 0.12% | 76,031,753 | 2.4% |
[ 0.0% - 0.5% ] 0.19% | 47,079,782 | 2.5% |
[ 0.0% - 0.5% ] 0.28% | 22,633,005 | 2.2% |
[ 0.0% - 0.5% ] 0.36% | 16,959,513 | 2.3% |
[ 0.0% - 0.5% ] 0.44% | 11,172,504 | 2.1% |
[ 0.5% - 1.0% ] 0.52% | 6,391,437 | 2.2% |
[ 0.5% - 1.0% ] 0.60% | 5,762,024 | 2.1% |
[ 0.5% - 1.0% ] 0.68% | 2,884,523 | 2.2% |
[ 0.5% - 1.0% ] 0.75% | 3,307,533 | 2.1% |
[ 0.5% - 1.0% ] 0.84% | 2,275,338 | 2.3% |
[ 0.5% - 1.0% ] 0.91% | 2,602,038 | 2.1% |
[ 0.5% - 1.0% ] 1.00% | 1,731,004 | 2.2% |
[ 1.0% - 1.5% ] 1.08% | 1,259,151 | 2.2% |
[ 1.0% - 1.5% ] 1.15% | 1,366,821 | 2.0% |
[ 1.0% - 1.5% ] 1.24% | 928,548 | 2.1% |
[ 1.0% - 1.5% ] 1.31% | 828,881 | 2.1% |
[ 1.0% - 1.5% ] 1.40% | 497,825 | 2.3% |
[ 1.0% - 1.5% ] 1.47% | 497,040 | 2.3% |
[ 1.5% - 2.0% ] 1.56% | 488,611 | 2.1% |
[ 1.5% - 2.0% ] 1.64% | 628,923 | 2.6% |
[ 1.5% - 2.0% ] 1.72% | 281,848 | 2.2% |
[ 1.5% - 2.0% ] 1.81% | 625,246 | 2.5% |
[ 1.5% - 2.0% ] 1.88% | 543,046 | 2.1% |
[ 1.5% - 2.0% ] 1.96% | 467,057 | 2.4% |
[ 2.0% - 2.5% ] 2.02% | 130,963 | 1.7% |
[ 2.0% - 2.5% ] 2.12% | 344,907 | 2.0% |
[ 2.0% - 2.5% ] 2.19% | 511,768 | 2.2% |
[ 2.0% - 2.5% ] 2.28% | 379,423 | 1.9% |
[ 2.0% - 2.5% ] 2.36% | 237,807 | 2.6% |
[ 2.0% - 2.5% ] 2.45% | 62,792 | 1.3% |
[ 2.5% - 3.0% ] 2.52% | 111,210 | 3.2% |
[ 2.5% - 3.0% ] 2.59% | 140,952 | 1.8% |
[ 2.5% - 3.0% ] 2.66% | 76,869 | 1.8% |
[ 2.5% - 3.0% ] 2.75% | 414,647 | 2.4% |
[ 2.5% - 3.0% ] 2.84% | 138,433 | 2.2% |
[ 2.5% - 3.0% ] 2.89% | 417,721 | 1.7% |
[ 3.0% - 3.5% ] 3.00% | 171,709 | 2.9% |
[ 3.0% - 3.5% ] 3.04% | 149,987 | 2.4% |
[ 3.0% - 3.5% ] 3.17% | 76,458 | 1.7% |
[ 3.0% - 3.5% ] 3.21% | 112,728 | 2.8% |
[ 3.0% - 3.5% ] 3.34% | 209,912 | 3.0% |
[ 3.0% - 3.5% ] 3.38% | 6,651 | 2.1% |
[ 3.0% - 3.5% ] 3.47% | 41,499 | 2.1% |
[ 3.5% - 4.0% ] 3.57% | 49,770 | 2.6% |
[ 3.5% - 4.0% ] 3.62% | 40,772 | 2.1% |
[ 3.5% - 4.0% ] 3.73% | 63,264 | 2.2% |
[ 3.5% - 4.0% ] 3.79% | 75,805 | 2.9% |
[ 3.5% - 4.0% ] 3.88% | 53,417 | 2.2% |
[ 3.5% - 4.0% ] 3.95% | 335,694 | 3.5% |
[ 4.0% - 4.5% ] 4.07% | 27,996 | 1.9% |
[ 4.0% - 4.5% ] 4.09% | 157,704 | 2.3% |
[ 4.0% - 4.5% ] 4.18% | 64,839 | 3.1% |
[ 4.0% - 4.5% ] 4.25% | 13,965 | 2.3% |
[ 4.0% - 4.5% ] 4.33% | 327,503 | 3.4% |
[ 4.0% - 4.5% ] 4.43% | 10,335 | 2.8% |
[ 4.5% - 5.0% ] 4.51% | 33,414 | 1.6% |
[ 4.5% - 5.0% ] 4.56% | 86,913 | 1.2% |
[ 4.5% - 5.0% ] 4.68% | 18,822 | 1.9% |
[ 4.5% - 5.0% ] 4.78% | 6,027 | 1.0% |
[ 4.5% - 5.0% ] 4.84% | 43,421 | 1.6% |
[ 4.5% - 5.0% ] 4.88% | 38,008 | 4.1% |
[ 4.5% - 5.0% ] 4.98% | 28,729 | 1.6% |
[ 5.0% - 5.5% ] 5.06% | 158 | 0.65% |
[ 5.0% - 5.5% ] 5.14% | 139,266 | 2.5% |
[ 5.0% - 5.5% ] 5.26% | 68,427 | 2.1% |
[ 5.0% - 5.5% ] 5.33% | 863 | 1.1% |
[ 5.0% - 5.5% ] 5.46% | 9,246 | 3.2% |
[ 5.5% - 6.0% ] 5.56% | 16,684 | 2.1% |
[ 5.5% - 6.0% ] 5.62% | 130,926 | 2.6% |
[ 5.5% - 6.0% ] 5.70% | 48,457 | 4.3% |
[ 5.5% - 6.0% ] 5.77% | 132,036 | 2.5% |
[ 5.5% - 6.0% ] 5.88% | 10,921 | 1.8% |
[ 5.5% - 6.0% ] 5.92% | 65,384 | 2.4% |
[ 6.0% - 6.5% ] 6.13% | 8,595 | 2.2% |
[ 6.0% - 6.5% ] 6.21% | 54,125 | 3.2% |
[ 6.0% - 6.5% ] 6.29% | 39,028 | 1.1% |
[ 6.5% - 7.0% ] 6.50% | 46,595 | 1.6% |
[ 6.5% - 7.0% ] 6.62% | 10,623 | 2.9% |
[ 6.5% - 7.0% ] 6.69% | 2,766 | 2.2% |
[ 6.5% - 7.0% ] 6.71% | 656 | 2.0% |
[ 6.5% - 7.0% ] 6.88% | 33,691 | 1.1% |
[ 6.5% - 7.0% ] 6.99% | 58,595 | 0.46% |
[ 7.0% - 7.5% ] 7.09% | 48,922 | 2.8% |
[ 7.0% - 7.5% ] 7.32% | 2,718 | 2.8% |
[ 7.5% - 8.0% ] 7.63% | 32,076 | 4.1% |
[ 7.5% - 8.0% ] 7.73% | 54,957 | 1.7% |
[ 7.5% - 8.0% ] 7.78% | 13,154 | 5.2% |
[ 8.0% - 8.5% ] 8.01% | 11,929 | 2.2% |
[ 8.0% - 8.5% ] 8.12% | 1,428 | 0.076% |
[ 8.0% - 8.5% ] 8.22% | 608 | 4.8% |
[ 8.0% - 8.5% ] 8.46% | 86,455 | 3.7% |
[ 8.5% - 9.0% ] 8.64% | 3,589 | 5.1% |
[ 9.0% - 9.5% ] 9.02% | 11,551 | 1.7% |
[ 9.5% - 10.0% ] 9.81% | 1,285 | 4.7% |
[ 9.5% - 10.0% ] 9.85% | 32,091 | 1.6% |
[ 9.5% - 10.0% ] 9.90% | 31,932 | 1.6% |
[ 10.0% - 10.5% ] 10.22% | 60,009 | 1.9% |
[ 10.5% - 11.0% ] 10.82% | 152,106 | 1.9% |
[ 11.0% - 11.5% ] 11.02% | 82,782 | 1.6% |
[ 11.0% - 11.5% ] 11.46% | 5,159 | 0.52% |
[ 11.5% - 12.0% ] 11.77% | 27,569 | 1.9% |
[ 12.0% - 12.5% ] 12.04% | 97,370 | 2.4% |
[ 12.0% - 12.5% ] 12.37% | 45,694 | 2.0% |
[ 13.5% - 14.0% ] 13.52% | 17,178 | 4.1% |
[ 13.5% - 14.0% ] 13.92% | 237 | 6.3% |
[ 14.0% - 14.5% ] 14.32% | 8,547 | 2.1% |
[ 15.0% - 15.5% ] 15.21% | 4,418 | 1.9% |
[ 15.5% - 16.0% ] 15.97% | 2,367 | 4.2% |
[ 16.5% - 17.0% ] 16.65% | 38,898 | 1.8% |
[ 19.0% - 19.5% ] 19.37% | 56,696 | 1.6% |
[ 21.0% - 21.5% ] 21.06% | 1,016 | 3.4% |