Cities with the Highest Percentage of Population Employed in Agriculture, Fishing & Hunting in Washington
RELATED REPORTS & OPTIONS
Agriculture, Fishing & Hunting
Washington
Compare Cities
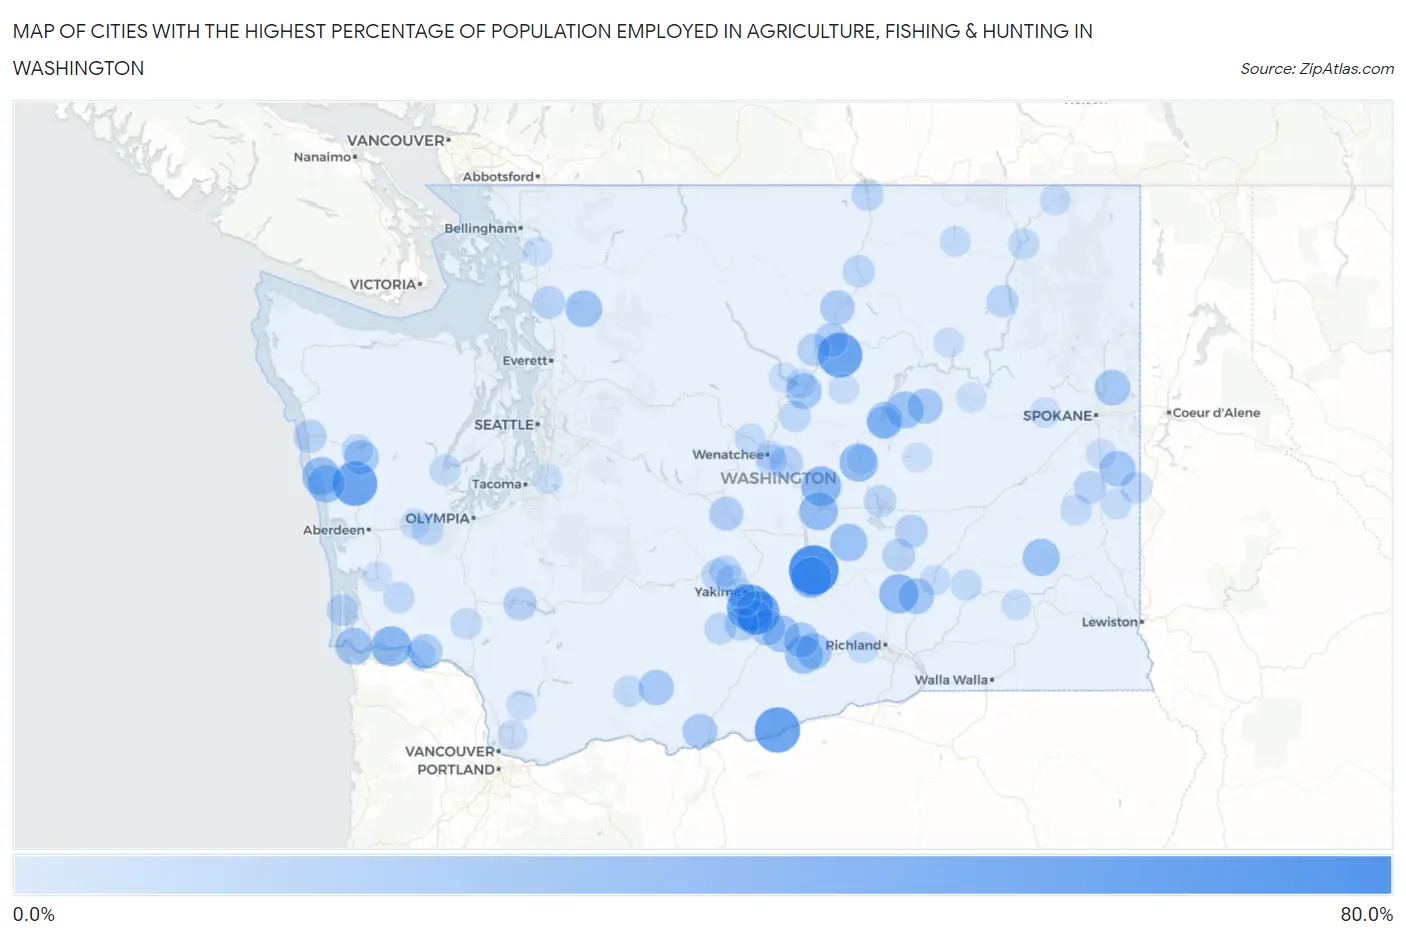
Map of Cities with the Highest Percentage of Population Employed in Agriculture, Fishing & Hunting in Washington
0.0%
80.0%
Cities with the Highest Percentage of Population Employed in Agriculture, Fishing & Hunting in Washington
| City | % Employed | vs State | vs National | |
| 1. | Mattawa | 76.0% | 2.4%(+73.6)#1 | 1.2%(+74.8)#91 |
| 2. | Parker | 64.5% | 2.4%(+62.1)#2 | 1.2%(+63.3)#117 |
| 3. | Roosevelt | 62.1% | 2.4%(+59.7)#3 | 1.2%(+60.9)#126 |
| 4. | Bridgeport | 59.8% | 2.4%(+57.4)#4 | 1.2%(+58.6)#140 |
| 5. | Humptulips | 58.9% | 2.4%(+56.5)#5 | 1.2%(+57.7)#144 |
| 6. | Donald | 56.7% | 2.4%(+54.3)#6 | 1.2%(+55.5)#156 |
| 7. | Desert Aire | 45.7% | 2.4%(+43.3)#7 | 1.2%(+44.5)#232 |
| 8. | Schwana | 44.8% | 2.4%(+42.4)#8 | 1.2%(+43.6)#240 |
| 9. | Altoona | 43.8% | 2.4%(+41.4)#9 | 1.2%(+42.6)#254 |
| 10. | Quincy | 42.9% | 2.4%(+40.5)#10 | 1.2%(+41.7)#266 |
| 11. | Basin City | 40.8% | 2.4%(+38.4)#11 | 1.2%(+39.6)#294 |
| 12. | Lakeview | 38.6% | 2.4%(+36.2)#12 | 1.2%(+37.4)#325 |
| 13. | George | 38.3% | 2.4%(+35.9)#13 | 1.2%(+37.1)#332 |
| 14. | Santiago | 37.5% | 2.4%(+35.1)#14 | 1.2%(+36.3)#341 |
| 15. | Mabton | 35.8% | 2.4%(+33.4)#15 | 1.2%(+34.6)#370 |
| 16. | Qui Nai Elt Village | 35.7% | 2.4%(+33.3)#16 | 1.2%(+34.5)#371 |
| 17. | Beverly | 35.7% | 2.4%(+33.3)#17 | 1.2%(+34.5)#374 |
| 18. | Royal City | 35.1% | 2.4%(+32.7)#18 | 1.2%(+33.9)#386 |
| 19. | Lacrosse | 34.7% | 2.4%(+32.3)#19 | 1.2%(+33.5)#392 |
| 20. | Hartline | 34.3% | 2.4%(+31.9)#20 | 1.2%(+33.1)#402 |
| 21. | Chinook | 33.6% | 2.4%(+31.2)#21 | 1.2%(+32.4)#410 |
| 22. | Oso | 33.3% | 2.4%(+30.9)#22 | 1.2%(+32.1)#414 |
| 23. | Granger | 32.8% | 2.4%(+30.4)#23 | 1.2%(+31.6)#444 |
| 24. | Grandview | 30.9% | 2.4%(+28.5)#24 | 1.2%(+29.7)#496 |
| 25. | Banks Lake South | 30.7% | 2.4%(+28.3)#25 | 1.2%(+29.5)#511 |
| 26. | Waverly | 30.3% | 2.4%(+27.9)#26 | 1.2%(+29.1)#524 |
| 27. | Toppenish | 29.8% | 2.4%(+27.4)#27 | 1.2%(+28.6)#539 |
| 28. | Mesa | 29.5% | 2.4%(+27.1)#28 | 1.2%(+28.3)#545 |
| 29. | Chelan Falls | 29.5% | 2.4%(+27.1)#29 | 1.2%(+28.3)#546 |
| 30. | Green Bluff | 29.2% | 2.4%(+26.9)#30 | 1.2%(+28.0)#552 |
| 31. | Sunnyside | 28.4% | 2.4%(+26.0)#31 | 1.2%(+27.2)#587 |
| 32. | Glenwood | 28.3% | 2.4%(+25.9)#32 | 1.2%(+27.1)#590 |
| 33. | Almira | 28.1% | 2.4%(+25.7)#33 | 1.2%(+26.9)#594 |
| 34. | Wapato | 27.9% | 2.4%(+25.5)#34 | 1.2%(+26.7)#601 |
| 35. | Neilton | 27.2% | 2.4%(+24.8)#35 | 1.2%(+26.0)#630 |
| 36. | Centerville | 26.9% | 2.4%(+24.5)#36 | 1.2%(+25.7)#647 |
| 37. | Malott | 25.7% | 2.4%(+23.3)#37 | 1.2%(+24.5)#694 |
| 38. | Upper Elochoman | 25.4% | 2.4%(+23.0)#38 | 1.2%(+24.2)#703 |
| 39. | Brewster | 24.5% | 2.4%(+22.1)#39 | 1.2%(+23.3)#743 |
| 40. | Thorp | 24.4% | 2.4%(+22.0)#40 | 1.2%(+23.2)#747 |
| 41. | Ocosta | 23.8% | 2.4%(+21.4)#41 | 1.2%(+22.6)#774 |
| 42. | Harrah | 22.9% | 2.4%(+20.5)#42 | 1.2%(+21.7)#823 |
| 43. | Pataha | 22.5% | 2.4%(+20.1)#43 | 1.2%(+21.3)#841 |
| 44. | Coulee City | 22.4% | 2.4%(+20.0)#44 | 1.2%(+21.2)#849 |
| 45. | Rock Island | 22.0% | 2.4%(+19.6)#45 | 1.2%(+20.8)#881 |
| 46. | Mossyrock | 21.9% | 2.4%(+19.6)#46 | 1.2%(+20.7)#888 |
| 47. | Warden | 21.9% | 2.4%(+19.5)#47 | 1.2%(+20.7)#890 |
| 48. | Othello | 21.0% | 2.4%(+18.6)#48 | 1.2%(+19.8)#940 |
| 49. | Pateros | 20.8% | 2.4%(+18.4)#49 | 1.2%(+19.6)#950 |
| 50. | Queets | 20.7% | 2.4%(+18.3)#50 | 1.2%(+19.5)#956 |
| 51. | Lake Mcmurray | 20.5% | 2.4%(+18.1)#51 | 1.2%(+19.3)#972 |
| 52. | Malden | 20.0% | 2.4%(+17.6)#52 | 1.2%(+18.8)#1,005 |
| 53. | Riverside | 18.9% | 2.4%(+16.5)#53 | 1.2%(+17.7)#1,092 |
| 54. | Cascade Valley | 18.6% | 2.4%(+16.2)#54 | 1.2%(+17.4)#1,114 |
| 55. | Inchelium | 18.6% | 2.4%(+16.2)#55 | 1.2%(+17.4)#1,118 |
| 56. | Tieton | 18.2% | 2.4%(+15.8)#56 | 1.2%(+17.0)#1,151 |
| 57. | Union Gap | 17.9% | 2.4%(+15.5)#57 | 1.2%(+16.7)#1,182 |
| 58. | Ocean Park | 17.8% | 2.4%(+15.4)#58 | 1.2%(+16.6)#1,188 |
| 59. | Tekoa | 17.3% | 2.4%(+14.9)#59 | 1.2%(+16.1)#1,229 |
| 60. | Naches | 17.3% | 2.4%(+14.9)#60 | 1.2%(+16.1)#1,230 |
| 61. | White Swan | 17.2% | 2.4%(+14.8)#61 | 1.2%(+16.0)#1,243 |
| 62. | Oroville | 17.0% | 2.4%(+14.6)#62 | 1.2%(+15.8)#1,268 |
| 63. | Malone | 16.9% | 2.4%(+14.5)#63 | 1.2%(+15.7)#1,274 |
| 64. | Amanda Park | 16.7% | 2.4%(+14.3)#64 | 1.2%(+15.5)#1,300 |
| 65. | Waterville | 16.6% | 2.4%(+14.2)#65 | 1.2%(+15.4)#1,318 |
| 66. | South Wenatchee | 16.5% | 2.4%(+14.1)#66 | 1.2%(+15.3)#1,327 |
| 67. | Lebam | 16.2% | 2.4%(+13.8)#67 | 1.2%(+15.0)#1,362 |
| 68. | St John | 15.8% | 2.4%(+13.4)#68 | 1.2%(+14.6)#1,394 |
| 69. | Trout Lake | 15.6% | 2.4%(+13.2)#69 | 1.2%(+14.4)#1,413 |
| 70. | Vader | 15.4% | 2.4%(+13.0)#70 | 1.2%(+14.2)#1,436 |
| 71. | Eschbach | 15.4% | 2.4%(+13.0)#71 | 1.2%(+14.2)#1,440 |
| 72. | Kahlotus | 15.3% | 2.4%(+12.9)#72 | 1.2%(+14.1)#1,458 |
| 73. | Skokomish | 15.2% | 2.4%(+12.8)#73 | 1.2%(+14.0)#1,464 |
| 74. | Lower Elochoman | 14.9% | 2.4%(+12.5)#74 | 1.2%(+13.7)#1,493 |
| 75. | Marcus | 14.9% | 2.4%(+12.5)#75 | 1.2%(+13.7)#1,496 |
| 76. | Benton City | 14.8% | 2.4%(+12.4)#76 | 1.2%(+13.6)#1,504 |
| 77. | Cashmere | 14.3% | 2.4%(+11.9)#77 | 1.2%(+13.1)#1,563 |
| 78. | Connell | 14.0% | 2.4%(+11.6)#78 | 1.2%(+12.8)#1,609 |
| 79. | Northport | 13.9% | 2.4%(+11.5)#79 | 1.2%(+12.7)#1,618 |
| 80. | Oakesdale | 13.8% | 2.4%(+11.4)#80 | 1.2%(+12.6)#1,636 |
| 81. | Torboy | 13.7% | 2.4%(+11.3)#81 | 1.2%(+12.5)#1,637 |
| 82. | Elma | 12.7% | 2.4%(+10.3)#82 | 1.2%(+11.5)#1,793 |
| 83. | Mansfield | 12.6% | 2.4%(+10.2)#83 | 1.2%(+11.4)#1,805 |
| 84. | Reardan | 12.6% | 2.4%(+10.2)#84 | 1.2%(+11.4)#1,815 |
| 85. | Brush Prairie | 12.5% | 2.4%(+10.1)#85 | 1.2%(+11.3)#1,821 |
| 86. | Spangle | 12.4% | 2.4%(+10.0)#86 | 1.2%(+11.2)#1,852 |
| 87. | Starbuck | 12.3% | 2.4%(+9.89)#87 | 1.2%(+11.1)#1,882 |
| 88. | Amboy | 12.2% | 2.4%(+9.83)#88 | 1.2%(+11.0)#1,886 |
| 89. | Creston | 12.2% | 2.4%(+9.77)#89 | 1.2%(+11.0)#1,895 |
| 90. | Manson | 12.1% | 2.4%(+9.66)#90 | 1.2%(+10.9)#1,907 |
| 91. | Keller | 12.0% | 2.4%(+9.61)#91 | 1.2%(+10.8)#1,917 |
| 92. | Chelan | 11.9% | 2.4%(+9.52)#92 | 1.2%(+10.7)#1,931 |
| 93. | Marine View | 11.6% | 2.4%(+9.24)#93 | 1.2%(+10.4)#1,999 |
| 94. | Algona | 11.5% | 2.4%(+9.12)#94 | 1.2%(+10.3)#2,030 |
| 95. | East Wenatchee | 11.3% | 2.4%(+8.92)#95 | 1.2%(+10.1)#2,068 |
| 96. | Raymond | 11.2% | 2.4%(+8.84)#96 | 1.2%(+10.0)#2,089 |
| 97. | Krupp Marlin | 11.1% | 2.4%(+8.72)#97 | 1.2%(+9.91)#2,131 |
| 98. | Soap Lake | 11.0% | 2.4%(+8.66)#98 | 1.2%(+9.85)#2,140 |
| 99. | Yakima | 11.0% | 2.4%(+8.62)#99 | 1.2%(+9.81)#2,147 |
| 100. | Alger | 11.0% | 2.4%(+8.58)#100 | 1.2%(+9.78)#2,153 |
Common Questions
What are the Top 10 Cities with the Highest Percentage of Population Employed in Agriculture, Fishing & Hunting in Washington?
Top 10 Cities with the Highest Percentage of Population Employed in Agriculture, Fishing & Hunting in Washington are:
#1
76.0%
#2
64.5%
#3
62.1%
#4
59.8%
#5
58.9%
#6
56.7%
#7
45.7%
#8
43.8%
#9
42.9%
#10
40.8%
What city has the Highest Percentage of Population Employed in Agriculture, Fishing & Hunting in Washington?
Mattawa has the Highest Percentage of Population Employed in Agriculture, Fishing & Hunting in Washington with 76.0%.
What is the Percentage of Population Employed in Agriculture, Fishing & Hunting in the State of Washington?
Percentage of Population Employed in Agriculture, Fishing & Hunting in Washington is 2.4%.
What is the Percentage of Population Employed in Agriculture, Fishing & Hunting in the United States?
Percentage of Population Employed in Agriculture, Fishing & Hunting in the United States is 1.2%.