Cuban Unemployment Among Women with Children Ages 6 to 17 years
COMPARE
Cuban
Select to Compare
Unemployment Among Women with Children Ages 6 to 17 years
Cuban Unemployment Among Women with Children Ages 6 to 17 years
9.2%
UNEMPLOYMENT | WOMEN W/ CHILDREN 6 TO 17
10.9/ 100
METRIC RATING
207th/ 347
METRIC RANK
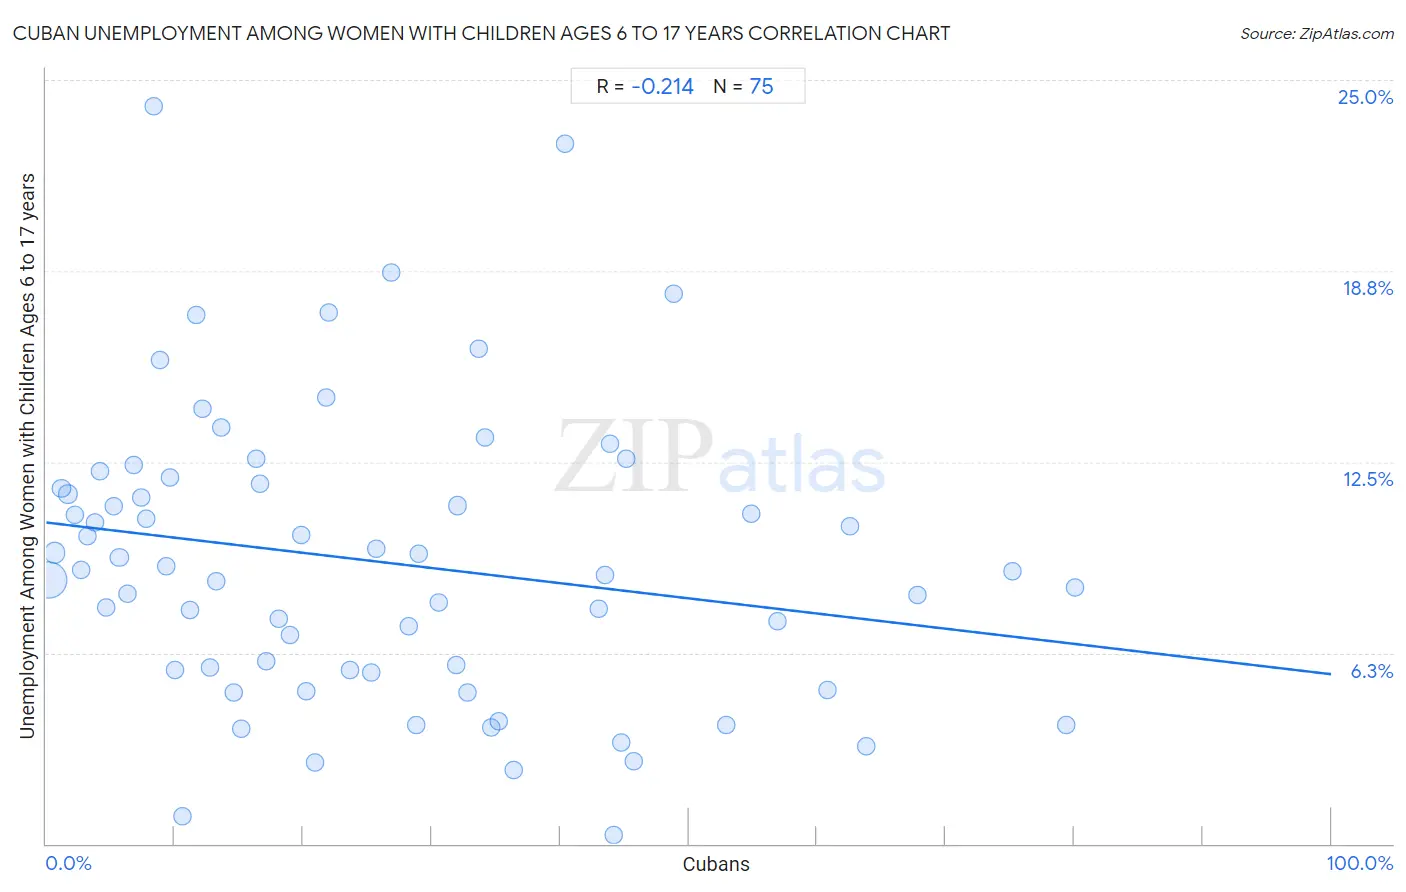
Cuban Unemployment Among Women with Children Ages 6 to 17 years Correlation Chart
The statistical analysis conducted on geographies consisting of 317,366,594 people shows a weak negative correlation between the proportion of Cubans and unemployment rate among women with children between the ages 6 and 17 in the United States with a correlation coefficient (R) of -0.214 and weighted average of 9.2%. On average, for every 1% (one percent) increase in Cubans within a typical geography, there is a decrease of 0.050% in unemployment rate among women with children between the ages 6 and 17.
It is essential to understand that the correlation between the percentage of Cubans and unemployment rate among women with children between the ages 6 and 17 does not imply a direct cause-and-effect relationship. It remains uncertain whether the presence of Cubans influences an upward or downward trend in the level of unemployment rate among women with children between the ages 6 and 17 within an area, or if Cubans simply ended up residing in those areas with higher or lower levels of unemployment rate among women with children between the ages 6 and 17 due to other factors.
Demographics Similar to Cubans by Unemployment Among Women with Children Ages 6 to 17 years
In terms of unemployment among women with children ages 6 to 17 years, the demographic groups most similar to Cubans are Immigrants from Peru (9.2%, a difference of 0.010%), Salvadoran (9.2%, a difference of 0.010%), Finnish (9.2%, a difference of 0.10%), Immigrants from Cuba (9.2%, a difference of 0.15%), and Immigrants from North America (9.2%, a difference of 0.20%).
| Demographics | Rating | Rank | Unemployment Among Women with Children Ages 6 to 17 years |
| Trinidadians and Tobagonians | 18.2 /100 | #200 | Poor 9.1% |
| Immigrants from Trinidad and Tobago | 16.7 /100 | #201 | Poor 9.1% |
| Immigrants from Middle Africa | 15.6 /100 | #202 | Poor 9.1% |
| Maltese | 15.3 /100 | #203 | Poor 9.1% |
| Immigrants from Canada | 15.3 /100 | #204 | Poor 9.1% |
| Immigrants from Western Europe | 14.1 /100 | #205 | Poor 9.1% |
| Immigrants from North America | 12.7 /100 | #206 | Poor 9.2% |
| Cubans | 10.9 /100 | #207 | Poor 9.2% |
| Immigrants from Peru | 10.8 /100 | #208 | Poor 9.2% |
| Salvadorans | 10.7 /100 | #209 | Poor 9.2% |
| Finns | 10.0 /100 | #210 | Tragic 9.2% |
| Immigrants from Cuba | 9.6 /100 | #211 | Tragic 9.2% |
| Peruvians | 9.0 /100 | #212 | Tragic 9.2% |
| Spaniards | 8.2 /100 | #213 | Tragic 9.2% |
| Iroquois | 7.5 /100 | #214 | Tragic 9.2% |
Cuban Unemployment Among Women with Children Ages 6 to 17 years Correlation Summary
| Measurement | Cuban Data | Unemployment Among Women with Children Ages 6 to 17 years Data |
| Minimum | 0.21% | 0.30% |
| Maximum | 80.1% | 24.1% |
| Range | 79.8% | 23.8% |
| Mean | 26.1% | 9.2% |
| Median | 20.9% | 8.9% |
| Interquartile 25% (IQ1) | 9.3% | 5.7% |
| Interquartile 75% (IQ3) | 40.4% | 11.8% |
| Interquartile Range (IQR) | 31.1% | 6.1% |
| Standard Deviation (Sample) | 20.6% | 4.8% |
| Standard Deviation (Population) | 20.5% | 4.8% |
Correlation Details
| Cuban Percentile | Sample Size | Unemployment Among Women with Children Ages 6 to 17 years |
[ 0.0% - 0.5% ] 0.21% | 242,877,922 | 8.7% |
[ 0.5% - 1.0% ] 0.68% | 40,134,063 | 9.5% |
[ 1.0% - 1.5% ] 1.21% | 9,939,359 | 11.6% |
[ 1.5% - 2.0% ] 1.69% | 6,476,877 | 11.4% |
[ 2.0% - 2.5% ] 2.25% | 3,391,912 | 10.8% |
[ 2.5% - 3.0% ] 2.74% | 2,865,480 | 9.0% |
[ 3.0% - 3.5% ] 3.24% | 1,471,443 | 10.1% |
[ 3.5% - 4.0% ] 3.75% | 1,317,983 | 10.5% |
[ 4.0% - 4.5% ] 4.22% | 664,065 | 12.2% |
[ 4.5% - 5.0% ] 4.70% | 534,390 | 7.7% |
[ 5.0% - 5.5% ] 5.29% | 607,862 | 11.0% |
[ 5.5% - 6.0% ] 5.69% | 499,679 | 9.4% |
[ 6.0% - 6.5% ] 6.30% | 372,682 | 8.2% |
[ 6.5% - 7.0% ] 6.79% | 205,743 | 12.4% |
[ 7.0% - 7.5% ] 7.39% | 196,478 | 11.3% |
[ 7.5% - 8.0% ] 7.75% | 697,589 | 10.6% |
[ 8.0% - 8.5% ] 8.34% | 335,041 | 24.1% |
[ 8.5% - 9.0% ] 8.84% | 238,398 | 15.8% |
[ 9.0% - 9.5% ] 9.30% | 15,779 | 9.1% |
[ 9.5% - 10.0% ] 9.63% | 39,272 | 12.0% |
[ 10.0% - 10.5% ] 10.02% | 198,912 | 5.7% |
[ 10.5% - 11.0% ] 10.63% | 34,046 | 0.90% |
[ 11.0% - 11.5% ] 11.23% | 176,277 | 7.7% |
[ 11.5% - 12.0% ] 11.72% | 27,398 | 17.3% |
[ 12.0% - 12.5% ] 12.12% | 162,170 | 14.2% |
[ 12.5% - 13.0% ] 12.78% | 37,393 | 5.8% |
[ 13.0% - 13.5% ] 13.21% | 187,596 | 8.6% |
[ 13.5% - 14.0% ] 13.62% | 51,972 | 13.6% |
[ 14.5% - 15.0% ] 14.62% | 100,449 | 5.0% |
[ 15.0% - 15.5% ] 15.16% | 294,912 | 3.8% |
[ 16.0% - 16.5% ] 16.37% | 28,712 | 12.6% |
[ 16.5% - 17.0% ] 16.65% | 17,817 | 11.8% |
[ 17.0% - 17.5% ] 17.15% | 98,652 | 6.0% |
[ 18.0% - 18.5% ] 18.08% | 149,277 | 7.4% |
[ 18.5% - 19.0% ] 18.94% | 74,371 | 6.8% |
[ 19.5% - 20.0% ] 19.82% | 15,218 | 10.1% |
[ 20.0% - 20.5% ] 20.27% | 79,996 | 5.0% |
[ 20.5% - 21.0% ] 20.90% | 99,254 | 2.7% |
[ 21.5% - 22.0% ] 21.74% | 24,257 | 14.6% |
[ 22.0% - 22.5% ] 22.03% | 68,984 | 17.4% |
[ 23.5% - 24.0% ] 23.67% | 47,065 | 5.7% |
[ 25.0% - 25.5% ] 25.28% | 89,456 | 5.6% |
[ 25.5% - 26.0% ] 25.67% | 81,431 | 9.7% |
[ 26.5% - 27.0% ] 26.85% | 44,890 | 18.7% |
[ 28.0% - 28.5% ] 28.18% | 80,064 | 7.1% |
[ 28.5% - 29.0% ] 28.82% | 31,688 | 3.9% |
[ 29.0% - 29.5% ] 29.02% | 13,261 | 9.5% |
[ 30.5% - 31.0% ] 30.57% | 69,152 | 7.9% |
[ 31.5% - 32.0% ] 31.89% | 95,783 | 5.9% |
[ 32.0% - 32.5% ] 32.04% | 497,852 | 11.1% |
[ 32.5% - 33.0% ] 32.81% | 110,046 | 4.9% |
[ 33.5% - 34.0% ] 33.65% | 36,000 | 16.2% |
[ 34.0% - 34.5% ] 34.13% | 46,844 | 13.3% |
[ 34.5% - 35.0% ] 34.64% | 78,402 | 3.8% |
[ 35.0% - 35.5% ] 35.19% | 142,880 | 4.0% |
[ 36.0% - 36.5% ] 36.35% | 14,477 | 2.4% |
[ 40.0% - 40.5% ] 40.39% | 40,278 | 22.9% |
[ 42.5% - 43.0% ] 42.99% | 29,240 | 7.7% |
[ 43.0% - 43.5% ] 43.45% | 57,066 | 8.8% |
[ 43.5% - 44.0% ] 43.89% | 68,517 | 13.1% |
[ 44.0% - 44.5% ] 44.15% | 56,791 | 0.30% |
[ 44.5% - 45.0% ] 44.71% | 37,977 | 3.3% |
[ 45.0% - 45.5% ] 45.18% | 35,705 | 12.6% |
[ 45.5% - 46.0% ] 45.69% | 13,729 | 2.7% |
[ 48.5% - 49.0% ] 48.79% | 34,742 | 18.0% |
[ 52.5% - 53.0% ] 52.97% | 29,530 | 3.9% |
[ 54.5% - 55.0% ] 54.83% | 34,057 | 10.8% |
[ 56.5% - 57.0% ] 56.95% | 52,661 | 7.3% |
[ 60.5% - 61.0% ] 60.80% | 52,101 | 5.0% |
[ 62.5% - 63.0% ] 62.57% | 55,241 | 10.4% |
[ 63.5% - 64.0% ] 63.81% | 52,851 | 3.2% |
[ 67.5% - 68.0% ] 67.79% | 90,972 | 8.2% |
[ 75.0% - 75.5% ] 75.15% | 222,996 | 8.9% |
[ 79.0% - 79.5% ] 79.36% | 42,081 | 3.9% |
[ 80.0% - 80.5% ] 80.06% | 71,088 | 8.4% |