Cities with the Highest Percentage of Population Employed in Firefighting & Prevention in Tennessee
RELATED REPORTS & OPTIONS
Firefighting & Prevention
Tennessee
Compare Cities
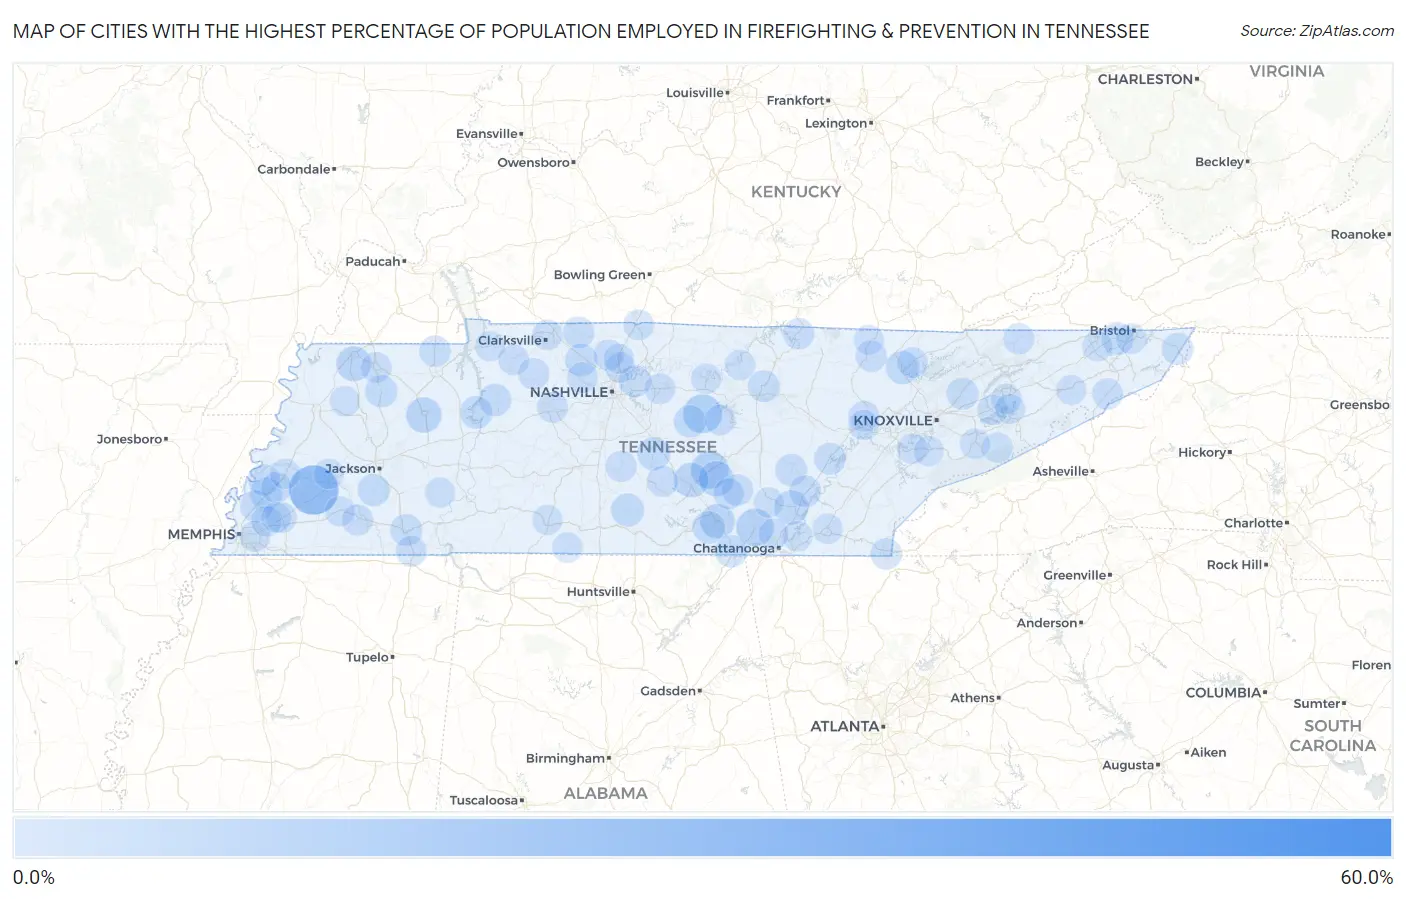
Map of Cities with the Highest Percentage of Population Employed in Firefighting & Prevention in Tennessee
0.0%
60.0%
Cities with the Highest Percentage of Population Employed in Firefighting & Prevention in Tennessee
| City | % Employed | vs State | vs National | |
| 1. | Farner | 57.5% | 1.1%(+56.4)#1 | 1.2%(+56.3)#10 |
| 2. | Essary Springs | 25.0% | 1.1%(+23.9)#2 | 1.2%(+23.8)#76 |
| 3. | Stanton | 24.8% | 1.1%(+23.7)#3 | 1.2%(+23.6)#80 |
| 4. | Rarity Bay | 19.2% | 1.1%(+18.1)#4 | 1.2%(+18.0)#127 |
| 5. | Liberty | 11.9% | 1.1%(+10.8)#5 | 1.2%(+10.7)#312 |
| 6. | Whitwell | 10.3% | 1.1%(+9.22)#6 | 1.2%(+9.13)#401 |
| 7. | Morrison | 10.2% | 1.1%(+9.15)#7 | 1.2%(+9.06)#406 |
| 8. | Beech Bluff | 9.6% | 1.1%(+8.55)#8 | 1.2%(+8.46)#447 |
| 9. | Luray | 8.4% | 1.1%(+7.30)#9 | 1.2%(+7.21)#565 |
| 10. | Huntingdon | 7.7% | 1.1%(+6.61)#10 | 1.2%(+6.52)#656 |
| 11. | Viola | 7.4% | 1.1%(+6.31)#11 | 1.2%(+6.22)#695 |
| 12. | Rives | 7.1% | 1.1%(+5.96)#12 | 1.2%(+5.87)#748 |
| 13. | New Union | 6.9% | 1.1%(+5.84)#13 | 1.2%(+5.75)#769 |
| 14. | Monteagle | 6.6% | 1.1%(+5.50)#14 | 1.2%(+5.41)#834 |
| 15. | Flat Top Mountain | 6.4% | 1.1%(+5.34)#15 | 1.2%(+5.25)#867 |
| 16. | Caryville | 5.2% | 1.1%(+4.05)#16 | 1.2%(+3.97)#1,219 |
| 17. | Christiana | 4.9% | 1.1%(+3.82)#17 | 1.2%(+3.73)#1,306 |
| 18. | Petersburg | 4.7% | 1.1%(+3.62)#18 | 1.2%(+3.54)#1,393 |
| 19. | Munford | 4.4% | 1.1%(+3.31)#19 | 1.2%(+3.22)#1,550 |
| 20. | Waverly | 4.3% | 1.1%(+3.22)#20 | 1.2%(+3.13)#1,609 |
| 21. | Sullivan Gardens | 4.2% | 1.1%(+3.14)#21 | 1.2%(+3.05)#1,649 |
| 22. | Pleasant View | 4.2% | 1.1%(+3.08)#22 | 1.2%(+2.99)#1,680 |
| 23. | Sewanee | 4.1% | 1.1%(+3.00)#23 | 1.2%(+2.91)#1,727 |
| 24. | New Johnsonville | 4.1% | 1.1%(+2.97)#24 | 1.2%(+2.88)#1,750 |
| 25. | Blountville | 4.0% | 1.1%(+2.95)#25 | 1.2%(+2.86)#1,761 |
| 26. | Greenfield | 4.0% | 1.1%(+2.93)#26 | 1.2%(+2.84)#1,776 |
| 27. | Auburntown | 3.9% | 1.1%(+2.83)#27 | 1.2%(+2.75)#1,830 |
| 28. | Medon | 3.9% | 1.1%(+2.82)#28 | 1.2%(+2.74)#1,836 |
| 29. | South Pittsburg | 3.8% | 1.1%(+2.72)#29 | 1.2%(+2.63)#1,914 |
| 30. | Walnut Grove Cdp Sumner County | 3.7% | 1.1%(+2.65)#30 | 1.2%(+2.56)#1,964 |
| 31. | Millington | 3.6% | 1.1%(+2.55)#31 | 1.2%(+2.46)#2,072 |
| 32. | Pikeville | 3.6% | 1.1%(+2.54)#32 | 1.2%(+2.46)#2,076 |
| 33. | Selmer | 3.6% | 1.1%(+2.54)#33 | 1.2%(+2.45)#2,077 |
| 34. | Green Hill | 3.6% | 1.1%(+2.46)#34 | 1.2%(+2.37)#2,157 |
| 35. | Blaine | 3.5% | 1.1%(+2.39)#35 | 1.2%(+2.30)#2,217 |
| 36. | Mountain City | 3.4% | 1.1%(+2.33)#36 | 1.2%(+2.24)#2,279 |
| 37. | Graysville | 3.4% | 1.1%(+2.32)#37 | 1.2%(+2.23)#2,290 |
| 38. | Spring City | 3.4% | 1.1%(+2.31)#38 | 1.2%(+2.22)#2,298 |
| 39. | Algood | 3.3% | 1.1%(+2.21)#39 | 1.2%(+2.12)#2,408 |
| 40. | Beersheba Springs | 3.1% | 1.1%(+1.96)#40 | 1.2%(+1.87)#2,695 |
| 41. | Gilt Edge | 3.0% | 1.1%(+1.93)#41 | 1.2%(+1.84)#2,727 |
| 42. | Puryear | 3.0% | 1.1%(+1.87)#42 | 1.2%(+1.78)#2,825 |
| 43. | Adams | 2.9% | 1.1%(+1.85)#43 | 1.2%(+1.76)#2,854 |
| 44. | Copperhill | 2.9% | 1.1%(+1.76)#44 | 1.2%(+1.67)#2,962 |
| 45. | Huntsville | 2.8% | 1.1%(+1.73)#45 | 1.2%(+1.64)#3,003 |
| 46. | Hampton | 2.8% | 1.1%(+1.73)#46 | 1.2%(+1.64)#3,004 |
| 47. | Wartrace | 2.8% | 1.1%(+1.72)#47 | 1.2%(+1.64)#3,014 |
| 48. | Slayden | 2.7% | 1.1%(+1.60)#48 | 1.2%(+1.52)#3,193 |
| 49. | Byrdstown | 2.7% | 1.1%(+1.57)#49 | 1.2%(+1.48)#3,244 |
| 50. | Sneedville | 2.5% | 1.1%(+1.44)#50 | 1.2%(+1.35)#3,473 |
| 51. | Bolivar | 2.5% | 1.1%(+1.42)#51 | 1.2%(+1.33)#3,525 |
| 52. | Chapel Hill | 2.5% | 1.1%(+1.42)#52 | 1.2%(+1.33)#3,527 |
| 53. | Guys | 2.4% | 1.1%(+1.34)#53 | 1.2%(+1.25)#3,673 |
| 54. | Oakdale | 2.3% | 1.1%(+1.17)#54 | 1.2%(+1.09)#4,035 |
| 55. | Ashland City | 2.3% | 1.1%(+1.15)#55 | 1.2%(+1.07)#4,083 |
| 56. | Altamont | 2.2% | 1.1%(+1.12)#56 | 1.2%(+1.03)#4,168 |
| 57. | Burns | 2.2% | 1.1%(+1.11)#57 | 1.2%(+1.03)#4,172 |
| 58. | Greenbrier | 2.2% | 1.1%(+1.05)#58 | 1.2%(+0.967)#4,309 |
| 59. | Erwin | 2.1% | 1.1%(+1.03)#59 | 1.2%(+0.938)#4,396 |
| 60. | Arlington | 2.1% | 1.1%(+1.01)#60 | 1.2%(+0.923)#4,430 |
| 61. | Smithville | 2.1% | 1.1%(+0.966)#61 | 1.2%(+0.877)#4,538 |
| 62. | La Follette | 2.1% | 1.1%(+0.965)#62 | 1.2%(+0.877)#4,540 |
| 63. | Brighton | 2.0% | 1.1%(+0.939)#63 | 1.2%(+0.851)#4,624 |
| 64. | Martin | 2.0% | 1.1%(+0.867)#64 | 1.2%(+0.779)#4,856 |
| 65. | Lebanon | 2.0% | 1.1%(+0.861)#65 | 1.2%(+0.773)#4,876 |
| 66. | Memphis | 1.9% | 1.1%(+0.836)#66 | 1.2%(+0.748)#4,945 |
| 67. | Cumberland City | 1.9% | 1.1%(+0.825)#67 | 1.2%(+0.737)#4,972 |
| 68. | Mitchellville | 1.9% | 1.1%(+0.825)#68 | 1.2%(+0.737)#4,976 |
| 69. | Goodlettsville | 1.9% | 1.1%(+0.813)#69 | 1.2%(+0.725)#5,022 |
| 70. | Bartlett | 1.9% | 1.1%(+0.809)#70 | 1.2%(+0.721)#5,033 |
| 71. | Dandridge | 1.9% | 1.1%(+0.788)#71 | 1.2%(+0.700)#5,100 |
| 72. | Pittman Center | 1.9% | 1.1%(+0.761)#72 | 1.2%(+0.673)#5,189 |
| 73. | Whiteville | 1.9% | 1.1%(+0.758)#73 | 1.2%(+0.670)#5,195 |
| 74. | Cleveland | 1.8% | 1.1%(+0.732)#74 | 1.2%(+0.644)#5,294 |
| 75. | Yorkville | 1.8% | 1.1%(+0.732)#75 | 1.2%(+0.643)#5,298 |
| 76. | Clarksville | 1.8% | 1.1%(+0.722)#76 | 1.2%(+0.634)#5,324 |
| 77. | Friendsville | 1.8% | 1.1%(+0.711)#77 | 1.2%(+0.623)#5,362 |
| 78. | Harriman | 1.8% | 1.1%(+0.681)#78 | 1.2%(+0.593)#5,468 |
| 79. | Gainesboro | 1.8% | 1.1%(+0.672)#79 | 1.2%(+0.584)#5,496 |
| 80. | Bristol | 1.8% | 1.1%(+0.658)#80 | 1.2%(+0.570)#5,544 |
| 81. | White Pine | 1.8% | 1.1%(+0.657)#81 | 1.2%(+0.569)#5,546 |
| 82. | Delano | 1.7% | 1.1%(+0.619)#82 | 1.2%(+0.531)#5,675 |
| 83. | Brownsville | 1.7% | 1.1%(+0.617)#83 | 1.2%(+0.529)#5,682 |
| 84. | Harrison | 1.7% | 1.1%(+0.599)#84 | 1.2%(+0.511)#5,748 |
| 85. | Carthage | 1.7% | 1.1%(+0.590)#85 | 1.2%(+0.502)#5,789 |
| 86. | Pigeon Forge | 1.7% | 1.1%(+0.582)#86 | 1.2%(+0.494)#5,828 |
| 87. | Minor Hill | 1.7% | 1.1%(+0.580)#87 | 1.2%(+0.492)#5,834 |
| 88. | Covington | 1.7% | 1.1%(+0.556)#88 | 1.2%(+0.468)#5,926 |
| 89. | Signal Mountain | 1.6% | 1.1%(+0.551)#89 | 1.2%(+0.463)#5,940 |
| 90. | Millersville | 1.6% | 1.1%(+0.502)#90 | 1.2%(+0.414)#6,122 |
| 91. | Maryville | 1.6% | 1.1%(+0.484)#91 | 1.2%(+0.396)#6,191 |
| 92. | Colonial Heights | 1.6% | 1.1%(+0.471)#92 | 1.2%(+0.383)#6,245 |
| 93. | Lawrenceburg | 1.6% | 1.1%(+0.460)#93 | 1.2%(+0.372)#6,304 |
| 94. | Dunlap | 1.5% | 1.1%(+0.452)#94 | 1.2%(+0.364)#6,333 |
| 95. | Sardis | 1.5% | 1.1%(+0.417)#95 | 1.2%(+0.329)#6,491 |
| 96. | Dover | 1.5% | 1.1%(+0.397)#96 | 1.2%(+0.309)#6,577 |
| 97. | Lakeland | 1.5% | 1.1%(+0.379)#97 | 1.2%(+0.291)#6,650 |
| 98. | Tusculum | 1.5% | 1.1%(+0.377)#98 | 1.2%(+0.289)#6,659 |
| 99. | Oneida | 1.4% | 1.1%(+0.352)#99 | 1.2%(+0.263)#6,775 |
| 100. | Baneberry | 1.4% | 1.1%(+0.352)#100 | 1.2%(+0.263)#6,779 |
Common Questions
What are the Top 10 Cities with the Highest Percentage of Population Employed in Firefighting & Prevention in Tennessee?
Top 10 Cities with the Highest Percentage of Population Employed in Firefighting & Prevention in Tennessee are:
#1
24.8%
#2
11.9%
#3
10.3%
#4
10.2%
#5
7.7%
#6
7.4%
#7
7.1%
#8
6.9%
#9
6.6%
#10
6.4%
What city has the Highest Percentage of Population Employed in Firefighting & Prevention in Tennessee?
Stanton has the Highest Percentage of Population Employed in Firefighting & Prevention in Tennessee with 24.8%.
What is the Percentage of Population Employed in Firefighting & Prevention in the State of Tennessee?
Percentage of Population Employed in Firefighting & Prevention in Tennessee is 1.1%.
What is the Percentage of Population Employed in Firefighting & Prevention in the United States?
Percentage of Population Employed in Firefighting & Prevention in the United States is 1.2%.