Cities with the Highest Percentage of Population Employed in Law Enforcement in Pennsylvania
RELATED REPORTS & OPTIONS
Law Enforcement
Pennsylvania
Compare Cities
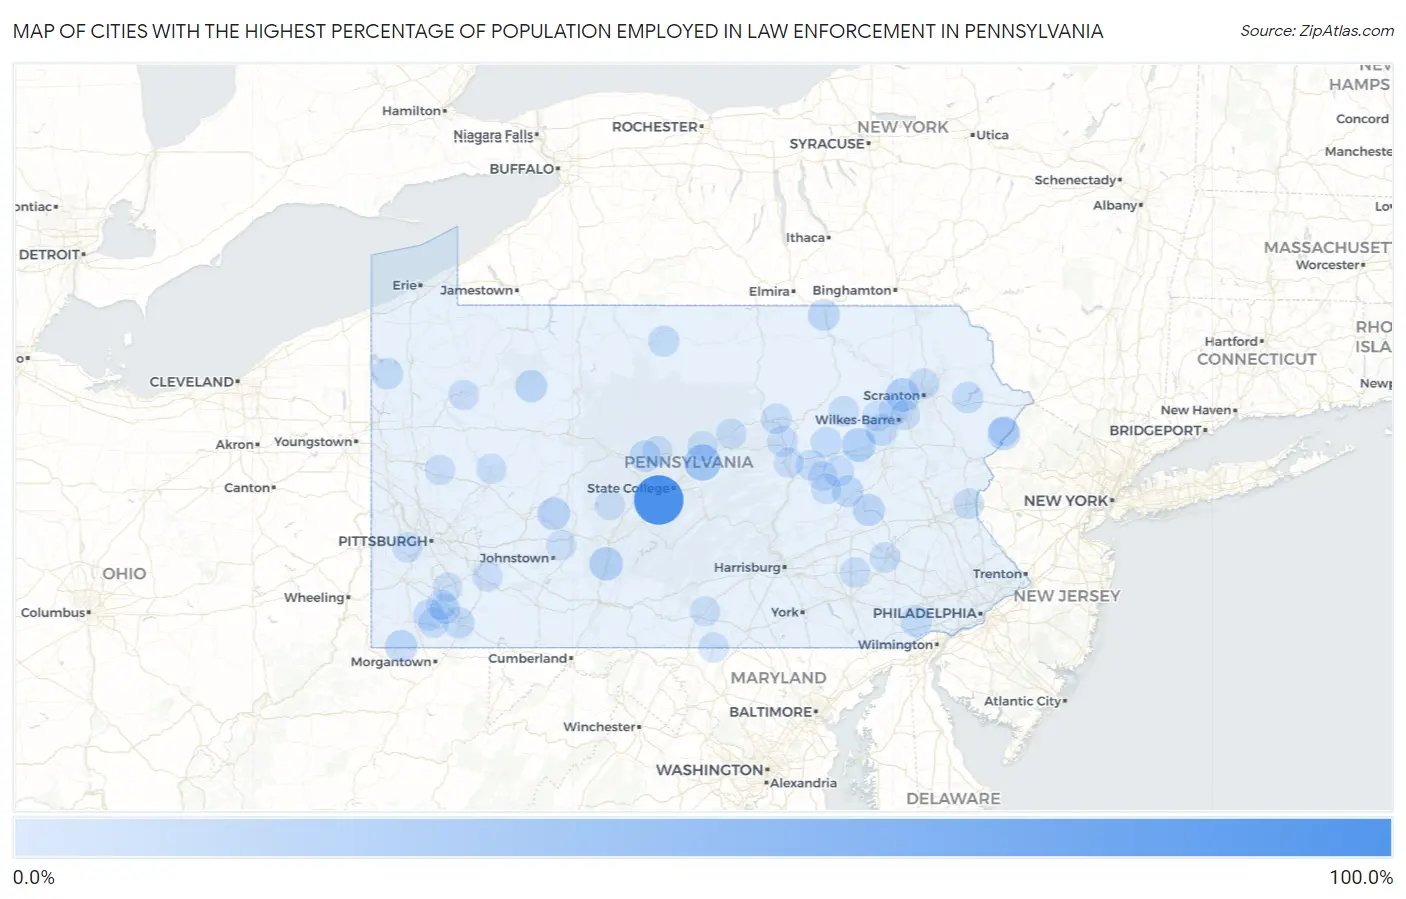
Map of Cities with the Highest Percentage of Population Employed in Law Enforcement in Pennsylvania
0.0%
100.0%
Cities with the Highest Percentage of Population Employed in Law Enforcement in Pennsylvania
| City | % Employed | vs State | vs National | |
| 1. | Baileyville | 100.0% | 1.00%(+99.0)#1 | 0.96%(+99.0)#1 |
| 2. | Roots | 73.8% | 1.00%(+72.8)#2 | 0.96%(+72.8)#2 |
| 3. | Hublersburg | 33.8% | 1.00%(+32.8)#3 | 0.96%(+32.9)#41 |
| 4. | St Clairsville Borough | 25.6% | 1.00%(+24.6)#4 | 0.96%(+24.7)#85 |
| 5. | Reightown | 22.6% | 1.00%(+21.6)#5 | 0.96%(+21.6)#110 |
| 6. | Foundryville | 22.2% | 1.00%(+21.2)#6 | 0.96%(+21.3)#113 |
| 7. | Upper Exeter | 21.6% | 1.00%(+20.6)#7 | 0.96%(+20.6)#119 |
| 8. | Claysburg | 20.7% | 1.00%(+19.7)#8 | 0.96%(+19.7)#125 |
| 9. | Pocono Mountain Lake Estates | 17.2% | 1.00%(+16.2)#9 | 0.96%(+16.2)#161 |
| 10. | Glen Hope Borough | 16.9% | 1.00%(+15.9)#10 | 0.96%(+15.9)#170 |
| 11. | Heilwood | 16.5% | 1.00%(+15.5)#11 | 0.96%(+15.6)#180 |
| 12. | Brave | 15.0% | 1.00%(+14.0)#12 | 0.96%(+14.0)#210 |
| 13. | Marienville | 14.2% | 1.00%(+13.2)#13 | 0.96%(+13.3)#232 |
| 14. | Milesburg Borough | 13.8% | 1.00%(+12.8)#14 | 0.96%(+12.8)#244 |
| 15. | Salladasburg Borough | 13.7% | 1.00%(+12.7)#15 | 0.96%(+12.7)#248 |
| 16. | Renningers | 13.3% | 1.00%(+12.3)#16 | 0.96%(+12.3)#263 |
| 17. | Greens Landing | 12.8% | 1.00%(+11.8)#17 | 0.96%(+11.8)#287 |
| 18. | Wanamie | 12.2% | 1.00%(+11.2)#18 | 0.96%(+11.2)#316 |
| 19. | Fountain Springs | 12.2% | 1.00%(+11.2)#19 | 0.96%(+11.2)#318 |
| 20. | Grassflat | 11.8% | 1.00%(+10.8)#20 | 0.96%(+10.8)#344 |
| 21. | Unionville | 11.1% | 1.00%(+10.1)#21 | 0.96%(+10.1)#388 |
| 22. | Centre Hall Borough | 10.7% | 1.00%(+9.71)#22 | 0.96%(+9.74)#425 |
| 23. | South Uniontown | 10.5% | 1.00%(+9.55)#23 | 0.96%(+9.58)#437 |
| 24. | Hartstown | 10.3% | 1.00%(+9.30)#24 | 0.96%(+9.33)#456 |
| 25. | Hopewell Borough | 10.2% | 1.00%(+9.21)#25 | 0.96%(+9.24)#461 |
| 26. | Wallenpaupack Lake Estates | 10.2% | 1.00%(+9.19)#26 | 0.96%(+9.23)#462 |
| 27. | Ramey Borough | 9.6% | 1.00%(+8.63)#27 | 0.96%(+8.66)#504 |
| 28. | Eyers Grove | 9.5% | 1.00%(+8.53)#28 | 0.96%(+8.56)#517 |
| 29. | Sweden Valley | 9.4% | 1.00%(+8.38)#29 | 0.96%(+8.41)#538 |
| 30. | Clintonville Borough | 9.2% | 1.00%(+8.23)#30 | 0.96%(+8.26)#555 |
| 31. | Dry Tavern | 9.2% | 1.00%(+8.19)#31 | 0.96%(+8.22)#560 |
| 32. | Shelltown | 9.1% | 1.00%(+8.10)#32 | 0.96%(+8.13)#576 |
| 33. | Callimont Borough | 9.1% | 1.00%(+8.10)#33 | 0.96%(+8.13)#578 |
| 34. | Allenwood | 8.5% | 1.00%(+7.46)#34 | 0.96%(+7.49)#659 |
| 35. | Slabtown | 8.2% | 1.00%(+7.25)#35 | 0.96%(+7.28)#694 |
| 36. | Summerhill Borough | 8.2% | 1.00%(+7.21)#36 | 0.96%(+7.25)#703 |
| 37. | Jermyn Borough | 8.2% | 1.00%(+7.17)#37 | 0.96%(+7.20)#713 |
| 38. | Montgomery Borough | 8.2% | 1.00%(+7.17)#38 | 0.96%(+7.20)#714 |
| 39. | Fairdale | 8.1% | 1.00%(+7.11)#39 | 0.96%(+7.14)#721 |
| 40. | Riverside | 8.0% | 1.00%(+6.98)#40 | 0.96%(+7.01)#742 |
| 41. | Tionesta Borough | 7.9% | 1.00%(+6.94)#41 | 0.96%(+6.97)#744 |
| 42. | Cassville Borough | 7.8% | 1.00%(+6.82)#42 | 0.96%(+6.85)#768 |
| 43. | Chinchilla | 7.8% | 1.00%(+6.82)#43 | 0.96%(+6.85)#769 |
| 44. | Jamison City | 7.8% | 1.00%(+6.76)#44 | 0.96%(+6.79)#774 |
| 45. | Beavertown Borough | 7.6% | 1.00%(+6.57)#45 | 0.96%(+6.60)#805 |
| 46. | Springmont | 7.2% | 1.00%(+6.22)#46 | 0.96%(+6.25)#877 |
| 47. | New Alexandria Borough | 7.1% | 1.00%(+6.09)#47 | 0.96%(+6.12)#916 |
| 48. | Sankertown Borough | 7.0% | 1.00%(+6.05)#48 | 0.96%(+6.08)#927 |
| 49. | Ranshaw | 7.0% | 1.00%(+5.98)#49 | 0.96%(+6.01)#945 |
| 50. | Kenmar | 6.9% | 1.00%(+5.95)#50 | 0.96%(+5.99)#950 |
| 51. | Palmer Heights | 6.9% | 1.00%(+5.91)#51 | 0.96%(+5.95)#958 |
| 52. | Troutville Borough | 6.8% | 1.00%(+5.85)#52 | 0.96%(+5.89)#972 |
| 53. | Oakland Cdp Cambria County | 6.8% | 1.00%(+5.85)#53 | 0.96%(+5.88)#974 |
| 54. | Noblestown | 6.7% | 1.00%(+5.75)#54 | 0.96%(+5.78)#998 |
| 55. | Norvelt | 6.6% | 1.00%(+5.61)#55 | 0.96%(+5.65)#1,044 |
| 56. | Catawissa Borough | 6.5% | 1.00%(+5.53)#56 | 0.96%(+5.57)#1,065 |
| 57. | Hopeland | 6.5% | 1.00%(+5.50)#57 | 0.96%(+5.53)#1,070 |
| 58. | Montandon | 6.5% | 1.00%(+5.48)#58 | 0.96%(+5.51)#1,075 |
| 59. | Moosic Borough | 6.5% | 1.00%(+5.47)#59 | 0.96%(+5.51)#1,076 |
| 60. | Shanor Northvue | 6.4% | 1.00%(+5.44)#60 | 0.96%(+5.47)#1,087 |
| 61. | Moshannon | 6.4% | 1.00%(+5.43)#61 | 0.96%(+5.46)#1,090 |
| 62. | Silkworth | 6.4% | 1.00%(+5.41)#62 | 0.96%(+5.44)#1,096 |
| 63. | Jackson Center Borough | 6.2% | 1.00%(+5.25)#63 | 0.96%(+5.29)#1,143 |
| 64. | Spring Drive Mobile Home Park | 6.2% | 1.00%(+5.18)#64 | 0.96%(+5.21)#1,166 |
| 65. | Blanchard | 6.1% | 1.00%(+5.10)#65 | 0.96%(+5.13)#1,187 |
| 66. | Woodland Heights | 6.1% | 1.00%(+5.08)#66 | 0.96%(+5.11)#1,191 |
| 67. | Allison | 6.0% | 1.00%(+5.02)#67 | 0.96%(+5.05)#1,211 |
| 68. | Trucksville | 6.0% | 1.00%(+5.00)#68 | 0.96%(+5.03)#1,217 |
| 69. | Mcelhattan | 6.0% | 1.00%(+4.97)#69 | 0.96%(+5.00)#1,225 |
| 70. | Templeton | 5.9% | 1.00%(+4.89)#70 | 0.96%(+4.92)#1,263 |
| 71. | Yatesville Borough | 5.9% | 1.00%(+4.87)#71 | 0.96%(+4.90)#1,268 |
| 72. | Cambridge Springs Borough | 5.8% | 1.00%(+4.81)#72 | 0.96%(+4.84)#1,285 |
| 73. | Brisbin Borough | 5.8% | 1.00%(+4.78)#73 | 0.96%(+4.82)#1,294 |
| 74. | Forest City Borough | 5.8% | 1.00%(+4.77)#74 | 0.96%(+4.80)#1,304 |
| 75. | Newton Hamilton Borough | 5.7% | 1.00%(+4.72)#75 | 0.96%(+4.75)#1,322 |
| 76. | Hiller | 5.7% | 1.00%(+4.66)#76 | 0.96%(+4.69)#1,344 |
| 77. | Mapleton Borough | 5.6% | 1.00%(+4.65)#77 | 0.96%(+4.69)#1,346 |
| 78. | Pen Mar | 5.4% | 1.00%(+4.41)#78 | 0.96%(+4.44)#1,448 |
| 79. | Pringle Borough | 5.4% | 1.00%(+4.39)#79 | 0.96%(+4.42)#1,461 |
| 80. | Hudson | 5.4% | 1.00%(+4.36)#80 | 0.96%(+4.39)#1,471 |
| 81. | Fredericksburg Cdp Crawford County | 5.3% | 1.00%(+4.35)#81 | 0.96%(+4.38)#1,478 |
| 82. | Westover Borough | 5.2% | 1.00%(+4.23)#82 | 0.96%(+4.26)#1,536 |
| 83. | East Washington Borough | 5.1% | 1.00%(+4.11)#83 | 0.96%(+4.15)#1,578 |
| 84. | Middleport Borough | 5.1% | 1.00%(+4.09)#84 | 0.96%(+4.12)#1,589 |
| 85. | Sandy Lake Borough | 5.0% | 1.00%(+4.05)#85 | 0.96%(+4.08)#1,611 |
| 86. | Garrett Borough | 5.0% | 1.00%(+4.00)#86 | 0.96%(+4.04)#1,632 |
| 87. | Foxburg Borough | 5.0% | 1.00%(+4.00)#87 | 0.96%(+4.04)#1,634 |
| 88. | Pocono Ranch Lands | 5.0% | 1.00%(+3.98)#88 | 0.96%(+4.01)#1,643 |
| 89. | Lilly Borough | 5.0% | 1.00%(+3.97)#89 | 0.96%(+4.01)#1,647 |
| 90. | Marysville Borough | 4.9% | 1.00%(+3.94)#90 | 0.96%(+3.98)#1,657 |
| 91. | Vinco | 4.9% | 1.00%(+3.90)#91 | 0.96%(+3.93)#1,681 |
| 92. | Elysburg | 4.9% | 1.00%(+3.86)#92 | 0.96%(+3.89)#1,699 |
| 93. | Scotland | 4.8% | 1.00%(+3.78)#93 | 0.96%(+3.81)#1,741 |
| 94. | Lynnwood Pricedale | 4.7% | 1.00%(+3.72)#94 | 0.96%(+3.75)#1,770 |
| 95. | Olyphant Borough | 4.7% | 1.00%(+3.67)#95 | 0.96%(+3.70)#1,803 |
| 96. | Salona | 4.6% | 1.00%(+3.62)#96 | 0.96%(+3.65)#1,829 |
| 97. | Blandburg | 4.6% | 1.00%(+3.62)#97 | 0.96%(+3.65)#1,830 |
| 98. | Alexandria Borough | 4.5% | 1.00%(+3.52)#98 | 0.96%(+3.56)#1,876 |
| 99. | Port Royal Borough | 4.5% | 1.00%(+3.52)#99 | 0.96%(+3.55)#1,882 |
| 100. | Huntingdon Borough | 4.5% | 1.00%(+3.49)#100 | 0.96%(+3.52)#1,906 |
Common Questions
What are the Top 10 Cities with the Highest Percentage of Population Employed in Law Enforcement in Pennsylvania?
Top 10 Cities with the Highest Percentage of Population Employed in Law Enforcement in Pennsylvania are:
#1
100.0%
#2
33.8%
#3
22.2%
#4
21.6%
#5
20.7%
#6
17.2%
#7
16.5%
#8
15.0%
#9
14.2%
#10
13.3%
What city has the Highest Percentage of Population Employed in Law Enforcement in Pennsylvania?
Baileyville has the Highest Percentage of Population Employed in Law Enforcement in Pennsylvania with 100.0%.
What is the Percentage of Population Employed in Law Enforcement in the State of Pennsylvania?
Percentage of Population Employed in Law Enforcement in Pennsylvania is 1.00%.
What is the Percentage of Population Employed in Law Enforcement in the United States?
Percentage of Population Employed in Law Enforcement in the United States is 0.96%.