Mayes County, OK
Mayes County Map
Mayes County Overview
39,324
TOTAL POPULATION
19,757
MALE POPULATION
19,567
FEMALE POPULATION
100.97
MALES / 100 FEMALES
99.04
FEMALES / 100 MALES
40.3
MEDIAN AGE
3.1
AVG FAMILY SIZE
2.6
AVG HOUSEHOLD SIZE
$29,607
PER CAPITA INCOME
$68,826
AVG FAMILY INCOME
$56,552
AVG HOUSEHOLD INCOME
46.3%
WAGE / INCOME GAP [ % ]
53.7¢/ $1
WAGE / INCOME GAP [ $ ]
$10,735
FAMILY INCOME DEFICIT
0.44
INEQUALITY / GINI INDEX
17,680
LABOR FORCE [ PEOPLE ]
56.6%
PERCENT IN LABOR FORCE
5.9%
UNEMPLOYMENT RATE
Mayes County Area Codes
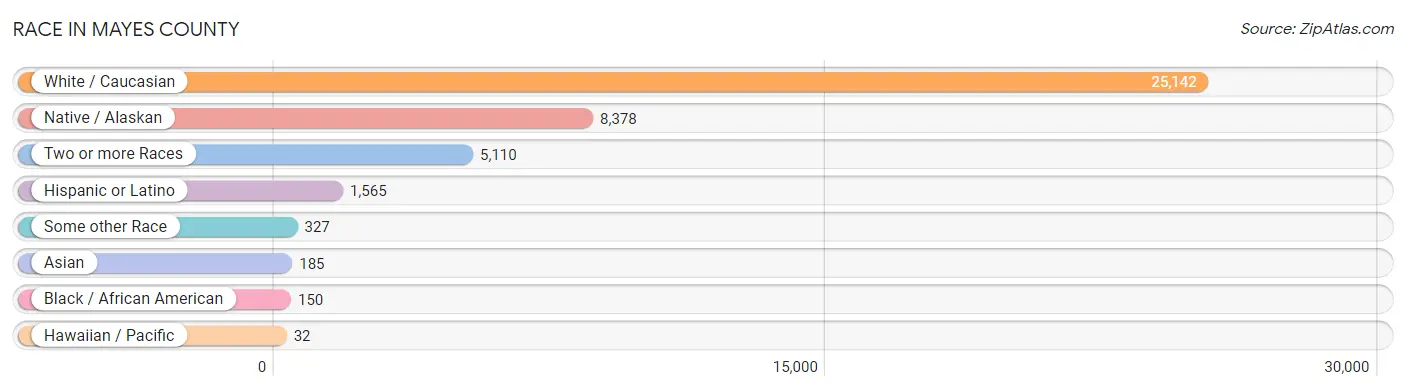
Race in Mayes County
The most populous races in Mayes County are White / Caucasian (25,142 | 63.9%), Native / Alaskan (8,378 | 21.3%), and Two or more Races (5,110 | 13.0%).
| Race | # Population | % Population |
| Asian | 185 | 0.5% |
| Black / African American | 150 | 0.4% |
| Hawaiian / Pacific | 32 | 0.1% |
| Hispanic or Latino | 1,565 | 4.0% |
| Native / Alaskan | 8,378 | 21.3% |
| White / Caucasian | 25,142 | 63.9% |
| Two or more Races | 5,110 | 13.0% |
| Some other Race | 327 | 0.8% |
| Total | 39,324 | 100.0% |
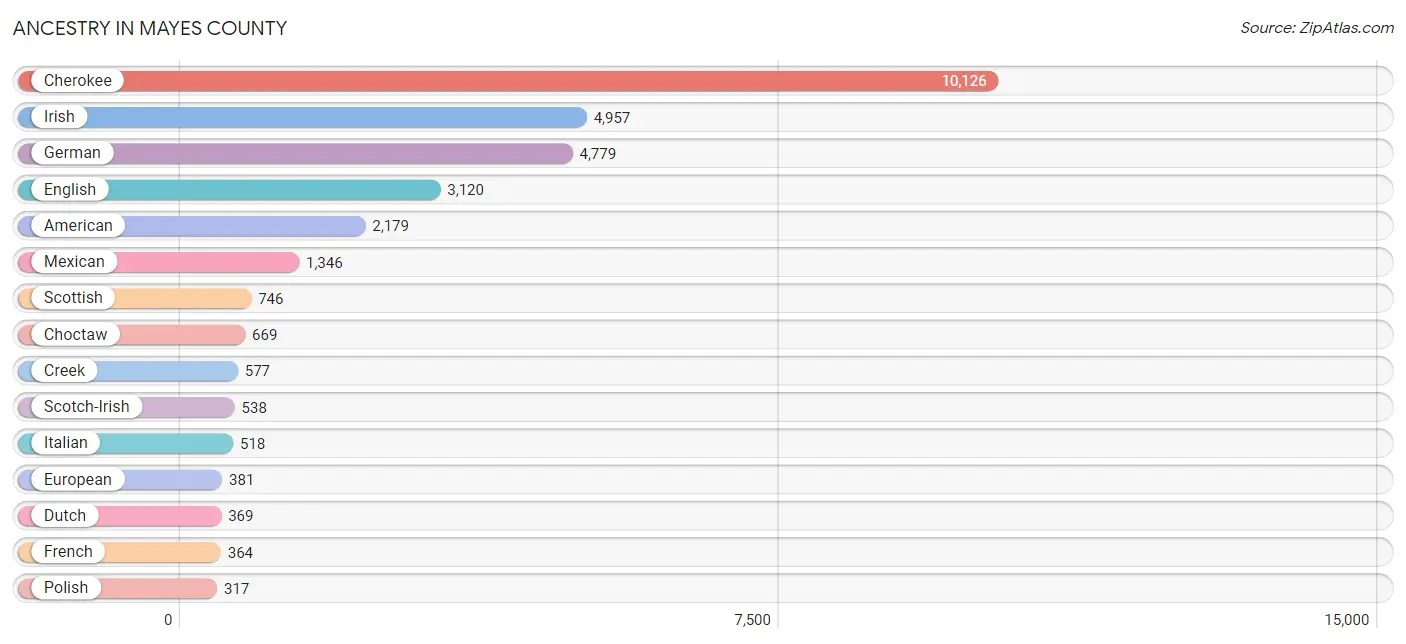
Ancestry in Mayes County
The most populous ancestries reported in Mayes County are Cherokee (10,126 | 25.8%), Irish (4,957 | 12.6%), German (4,779 | 12.1%), English (3,120 | 7.9%), and American (2,179 | 5.5%), together accounting for 64.0% of all Mayes County residents.
| Ancestry | # Population | % Population |
| African | 24 | 0.1% |
| American | 2,179 | 5.5% |
| Apache | 37 | 0.1% |
| Arab | 264 | 0.7% |
| Arapaho | 14 | 0.0% |
| Austrian | 10 | 0.0% |
| Bangladeshi | 95 | 0.2% |
| Belgian | 14 | 0.0% |
| Bhutanese | 55 | 0.1% |
| Blackfeet | 48 | 0.1% |
| British | 190 | 0.5% |
| Burmese | 15 | 0.0% |
| Canadian | 36 | 0.1% |
| Celtic | 1 | 0.0% |
| Central American | 24 | 0.1% |
| Cherokee | 10,126 | 25.8% |
| Cheyenne | 1 | 0.0% |
| Chickasaw | 207 | 0.5% |
| Chippewa | 73 | 0.2% |
| Choctaw | 669 | 1.7% |
| Comanche | 26 | 0.1% |
| Creek | 577 | 1.5% |
| Croatian | 5 | 0.0% |
| Cuban | 1 | 0.0% |
| Czech | 132 | 0.3% |
| Czechoslovakian | 5 | 0.0% |
| Danish | 78 | 0.2% |
| Delaware | 27 | 0.1% |
| Dominican | 15 | 0.0% |
| Dutch | 369 | 0.9% |
| Dutch West Indian | 209 | 0.5% |
| Eastern European | 21 | 0.1% |
| English | 3,120 | 7.9% |
| European | 381 | 1.0% |
| French | 364 | 0.9% |
| French Canadian | 12 | 0.0% |
| German | 4,779 | 12.1% |
| Greek | 36 | 0.1% |
| Guamanian / Chamorro | 14 | 0.0% |
| Guatemalan | 22 | 0.1% |
| Honduran | 2 | 0.0% |
| Hungarian | 23 | 0.1% |
| Icelander | 12 | 0.0% |
| Indian (Asian) | 32 | 0.1% |
| Irish | 4,957 | 12.6% |
| Iroquois | 121 | 0.3% |
| Italian | 518 | 1.3% |
| Kiowa | 35 | 0.1% |
| Korean | 92 | 0.2% |
| Laotian | 8 | 0.0% |
| Lebanese | 55 | 0.1% |
| Lithuanian | 25 | 0.1% |
| Malaysian | 10 | 0.0% |
| Mexican | 1,346 | 3.4% |
| Native Hawaiian | 6 | 0.0% |
| Navajo | 44 | 0.1% |
| New Zealander | 10 | 0.0% |
| Northern European | 13 | 0.0% |
| Norwegian | 117 | 0.3% |
| Osage | 47 | 0.1% |
| Ottawa | 14 | 0.0% |
| Pakistani | 4 | 0.0% |
| Peruvian | 17 | 0.0% |
| Polish | 317 | 0.8% |
| Portuguese | 30 | 0.1% |
| Potawatomi | 121 | 0.3% |
| Pueblo | 9 | 0.0% |
| Puerto Rican | 59 | 0.2% |
| Romanian | 6 | 0.0% |
| Russian | 42 | 0.1% |
| Samoan | 15 | 0.0% |
| Scandinavian | 163 | 0.4% |
| Scotch-Irish | 538 | 1.4% |
| Scottish | 746 | 1.9% |
| Seminole | 74 | 0.2% |
| Sioux | 49 | 0.1% |
| Slavic | 2 | 0.0% |
| South American | 34 | 0.1% |
| Spaniard | 29 | 0.1% |
| Spanish | 30 | 0.1% |
| Sri Lankan | 9 | 0.0% |
| Subsaharan African | 24 | 0.1% |
| Swedish | 161 | 0.4% |
| Swiss | 14 | 0.0% |
| Syrian | 137 | 0.4% |
| Thai | 16 | 0.0% |
| Turkish | 4 | 0.0% |
| Ukrainian | 21 | 0.1% |
| Venezuelan | 17 | 0.0% |
| Welsh | 204 | 0.5% |
| Yugoslavian | 2 | 0.0% | View All 91 Rows |
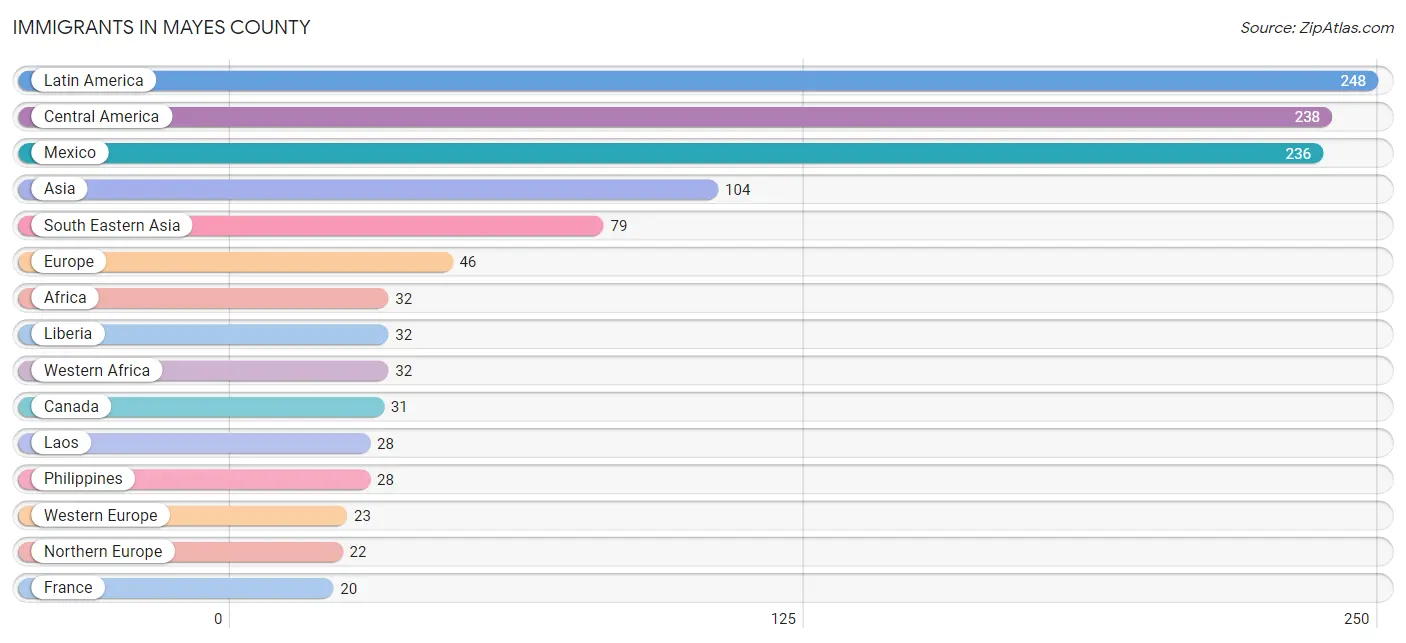
Immigrants in Mayes County
The most numerous immigrant groups reported in Mayes County came from Latin America (248 | 0.6%), Central America (238 | 0.6%), Mexico (236 | 0.6%), Asia (104 | 0.3%), and South Eastern Asia (79 | 0.2%), together accounting for 2.3% of all Mayes County residents.
| Immigration Origin | # Population | % Population |
| Africa | 32 | 0.1% |
| Asia | 104 | 0.3% |
| Bangladesh | 5 | 0.0% |
| Cambodia | 1 | 0.0% |
| Canada | 31 | 0.1% |
| Central America | 238 | 0.6% |
| Denmark | 8 | 0.0% |
| Eastern Asia | 13 | 0.0% |
| Eastern Europe | 1 | 0.0% |
| El Salvador | 2 | 0.0% |
| England | 4 | 0.0% |
| Europe | 46 | 0.1% |
| France | 20 | 0.1% |
| Germany | 3 | 0.0% |
| Indonesia | 8 | 0.0% |
| Japan | 13 | 0.0% |
| Laos | 28 | 0.1% |
| Latin America | 248 | 0.6% |
| Liberia | 32 | 0.1% |
| Mexico | 236 | 0.6% |
| Northern Europe | 22 | 0.1% |
| Oceania | 12 | 0.0% |
| Peru | 3 | 0.0% |
| Philippines | 28 | 0.1% |
| Romania | 1 | 0.0% |
| Scotland | 3 | 0.0% |
| South America | 10 | 0.0% |
| South Central Asia | 12 | 0.0% |
| South Eastern Asia | 79 | 0.2% |
| Sri Lanka | 7 | 0.0% |
| Sweden | 7 | 0.0% |
| Thailand | 7 | 0.0% |
| Venezuela | 7 | 0.0% |
| Vietnam | 7 | 0.0% |
| Western Africa | 32 | 0.1% |
| Western Europe | 23 | 0.1% | View All 36 Rows |
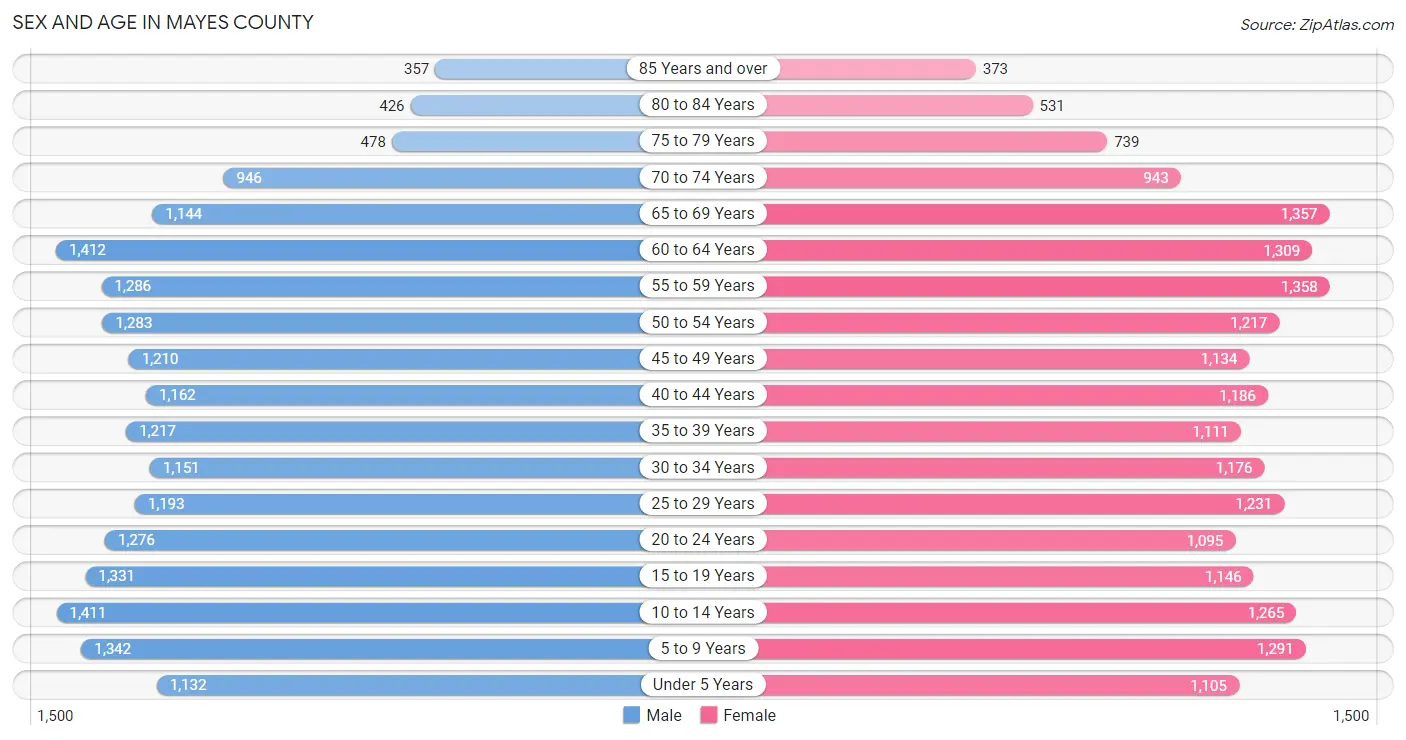
Sex and Age in Mayes County
Sex and Age in Mayes County
The most populous age groups in Mayes County are 60 to 64 Years (1,412 | 7.1%) for men and 55 to 59 Years (1,358 | 6.9%) for women.
| Age Bracket | Male | Female |
| Under 5 Years | 1,132 (5.7%) | 1,105 (5.7%) |
| 5 to 9 Years | 1,342 (6.8%) | 1,291 (6.6%) |
| 10 to 14 Years | 1,411 (7.1%) | 1,265 (6.5%) |
| 15 to 19 Years | 1,331 (6.7%) | 1,146 (5.9%) |
| 20 to 24 Years | 1,276 (6.5%) | 1,095 (5.6%) |
| 25 to 29 Years | 1,193 (6.0%) | 1,231 (6.3%) |
| 30 to 34 Years | 1,151 (5.8%) | 1,176 (6.0%) |
| 35 to 39 Years | 1,217 (6.2%) | 1,111 (5.7%) |
| 40 to 44 Years | 1,162 (5.9%) | 1,186 (6.1%) |
| 45 to 49 Years | 1,210 (6.1%) | 1,134 (5.8%) |
| 50 to 54 Years | 1,283 (6.5%) | 1,217 (6.2%) |
| 55 to 59 Years | 1,286 (6.5%) | 1,358 (6.9%) |
| 60 to 64 Years | 1,412 (7.1%) | 1,309 (6.7%) |
| 65 to 69 Years | 1,144 (5.8%) | 1,357 (6.9%) |
| 70 to 74 Years | 946 (4.8%) | 943 (4.8%) |
| 75 to 79 Years | 478 (2.4%) | 739 (3.8%) |
| 80 to 84 Years | 426 (2.2%) | 531 (2.7%) |
| 85 Years and over | 357 (1.8%) | 373 (1.9%) |
| Total | 19,757 (100.0%) | 19,567 (100.0%) |
Families and Households in Mayes County
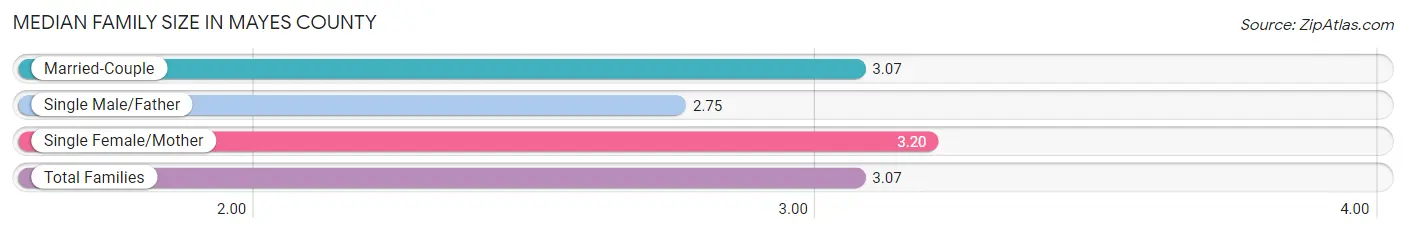
Median Family Size in Mayes County
The median family size in Mayes County is 3.07 persons per family, with single female/mother families (1,834 | 17.5%) accounting for the largest median family size of 3.2 persons per family. On the other hand, single male/father families (842 | 8.0%) represent the smallest median family size with 2.75 persons per family.
| Family Type | # Families | Family Size |
| Married-Couple | 7,824 (74.5%) | 3.07 |
| Single Male/Father | 842 (8.0%) | 2.75 |
| Single Female/Mother | 1,834 (17.5%) | 3.20 |
| Total Families | 10,500 (100.0%) | 3.07 |
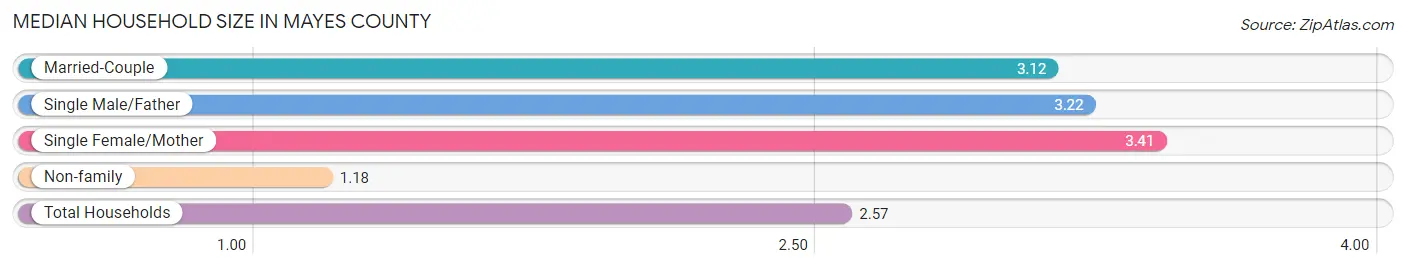
Median Household Size in Mayes County
The median household size in Mayes County is 2.57 persons per household, with single female/mother households (1,834 | 12.1%) accounting for the largest median household size of 3.41 persons per household. non-family households (4,612 | 30.5%) represent the smallest median household size with 1.18 persons per household.
| Household Type | # Households | Household Size |
| Married-Couple | 7,824 (51.8%) | 3.12 |
| Single Male/Father | 842 (5.6%) | 3.22 |
| Single Female/Mother | 1,834 (12.1%) | 3.41 |
| Non-family | 4,612 (30.5%) | 1.18 |
| Total Households | 15,112 (100.0%) | 2.57 |
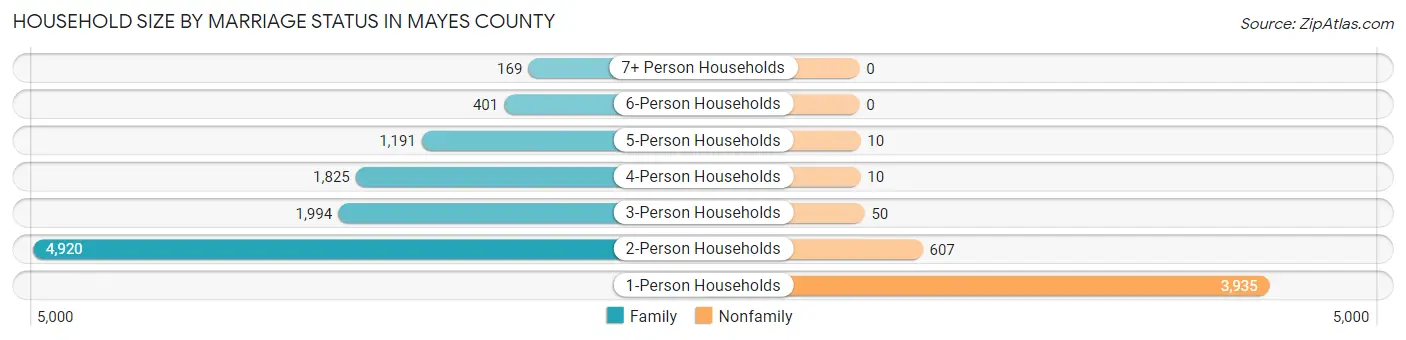
Household Size by Marriage Status in Mayes County
Out of a total of 15,112 households in Mayes County, 10,500 (69.5%) are family households, while 4,612 (30.5%) are nonfamily households. The most numerous type of family households are 2-person households, comprising 4,920, and the most common type of nonfamily households are 1-person households, comprising 3,935.
| Household Size | Family Households | Nonfamily Households |
| 1-Person Households | - | 3,935 (26.0%) |
| 2-Person Households | 4,920 (32.6%) | 607 (4.0%) |
| 3-Person Households | 1,994 (13.2%) | 50 (0.3%) |
| 4-Person Households | 1,825 (12.1%) | 10 (0.1%) |
| 5-Person Households | 1,191 (7.9%) | 10 (0.1%) |
| 6-Person Households | 401 (2.6%) | 0 (0.0%) |
| 7+ Person Households | 169 (1.1%) | 0 (0.0%) |
| Total | 10,500 (69.5%) | 4,612 (30.5%) |
Female Fertility in Mayes County
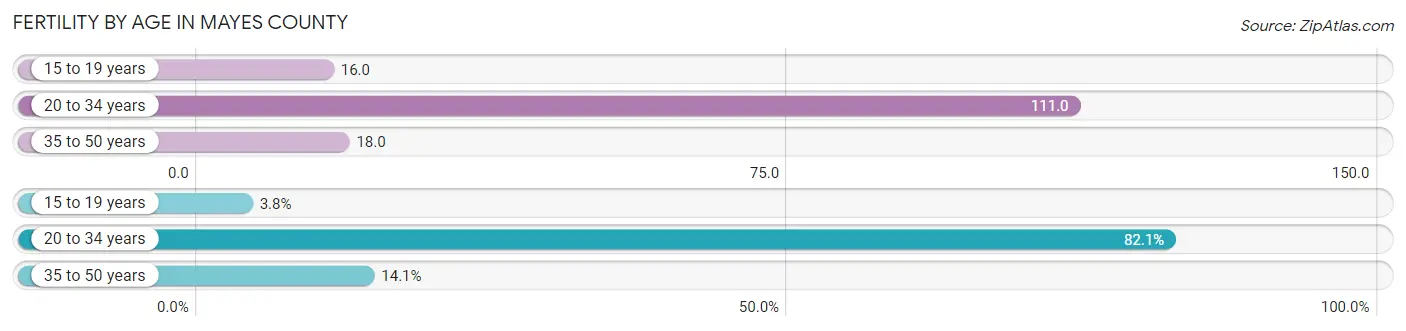
Fertility by Age in Mayes County
Average fertility rate in Mayes County is 57.0 births per 1,000 women. Women in the age bracket of 20 to 34 years have the highest fertility rate with 111.0 births per 1,000 women. Women in the age bracket of 20 to 34 years acount for 82.1% of all women with births.
| Age Bracket | Women with Births | Births / 1,000 Women |
| 15 to 19 years | 18 (3.8%) | 16.0 |
| 20 to 34 years | 390 (82.1%) | 111.0 |
| 35 to 50 years | 67 (14.1%) | 18.0 |
| Total | 475 (100.0%) | 57.0 |
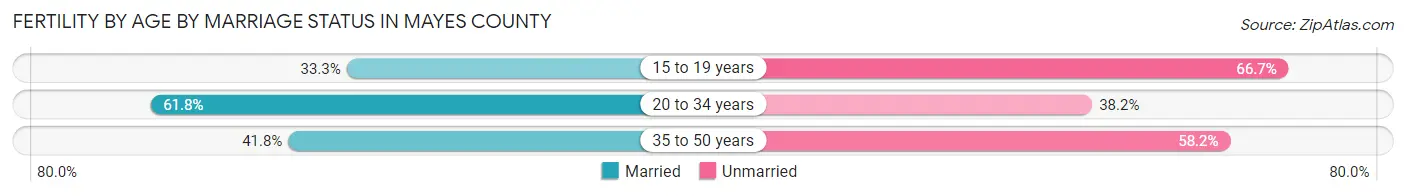
Fertility by Age by Marriage Status in Mayes County
57.9% of women with births (475) in Mayes County are married. The highest percentage of unmarried women with births falls into 15 to 19 years age bracket with 66.7% of them unmarried at the time of birth, while the lowest percentage of unmarried women with births belong to 20 to 34 years age bracket with 38.2% of them unmarried.
| Age Bracket | Married | Unmarried |
| 15 to 19 years | 6 (33.3%) | 12 (66.7%) |
| 20 to 34 years | 241 (61.8%) | 149 (38.2%) |
| 35 to 50 years | 28 (41.8%) | 39 (58.2%) |
| Total | 275 (57.9%) | 200 (42.1%) |
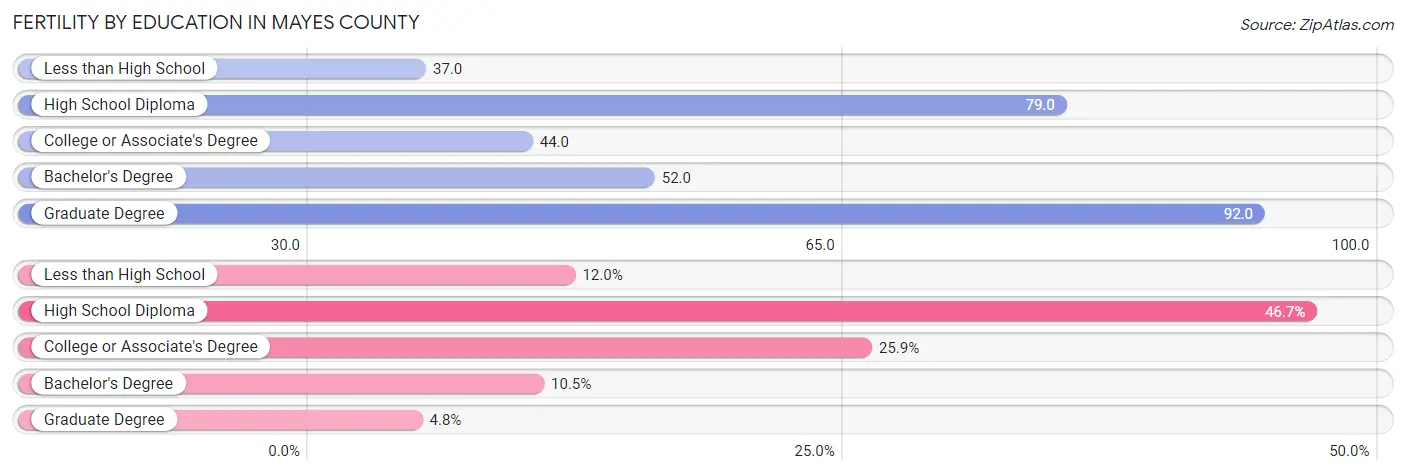
Fertility by Education in Mayes County
Average fertility rate in Mayes County is 57.0 births per 1,000 women. Women with the education attainment of graduate degree have the highest fertility rate of 92.0 births per 1,000 women, while women with the education attainment of less than high school have the lowest fertility at 37.0 births per 1,000 women. Women with the education attainment of high school diploma represent 46.7% of all women with births.
| Educational Attainment | Women with Births | Births / 1,000 Women |
| Less than High School | 57 (12.0%) | 37.0 |
| High School Diploma | 222 (46.7%) | 79.0 |
| College or Associate's Degree | 123 (25.9%) | 44.0 |
| Bachelor's Degree | 50 (10.5%) | 52.0 |
| Graduate Degree | 23 (4.8%) | 92.0 |
| Total | 475 (100.0%) | 57.0 |
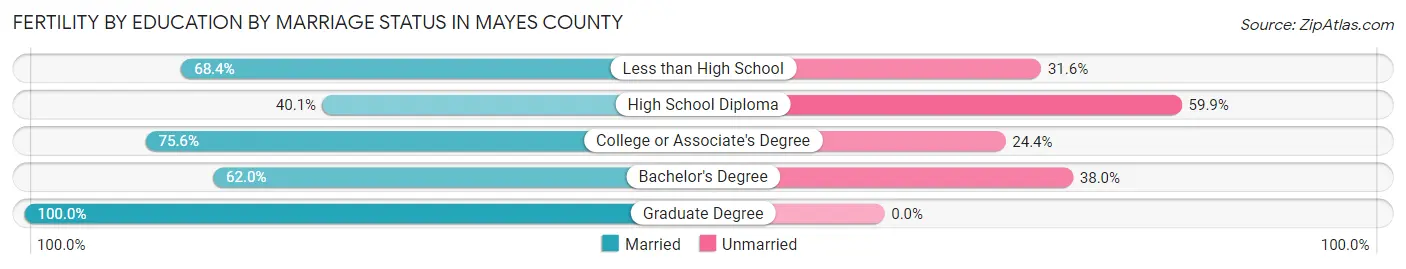
Fertility by Education by Marriage Status in Mayes County
42.1% of women with births in Mayes County are unmarried. Women with the educational attainment of graduate degree are most likely to be married with 100.0% of them married at childbirth, while women with the educational attainment of high school diploma are least likely to be married with 59.9% of them unmarried at childbirth.
| Educational Attainment | Married | Unmarried |
| Less than High School | 39 (68.4%) | 18 (31.6%) |
| High School Diploma | 89 (40.1%) | 133 (59.9%) |
| College or Associate's Degree | 93 (75.6%) | 30 (24.4%) |
| Bachelor's Degree | 31 (62.0%) | 19 (38.0%) |
| Graduate Degree | 23 (100.0%) | 0 (0.0%) |
| Total | 275 (57.9%) | 200 (42.1%) |
Income in Mayes County
Income Overview in Mayes County
Per Capita Income in Mayes County is $29,607, while median incomes of families and households are $68,826 and $56,552 respectively.
| Characteristic | Number | Measure |
| Per Capita Income | 39,324 | $29,607 |
| Median Family Income | 10,500 | $68,826 |
| Mean Family Income | 10,500 | $82,287 |
| Median Household Income | 15,112 | $56,552 |
| Mean Household Income | 15,112 | $73,224 |
| Income Deficit | 10,500 | $10,735 |
| Wage / Income Gap (%) | 39,324 | 46.30% |
| Wage / Income Gap ($) | 39,324 | 53.70¢ per $1 |
| Gini / Inequality Index | 39,324 | 0.44 |
Earnings by Sex in Mayes County
Average Earnings in Mayes County are $35,847, $47,721 for men and $25,627 for women, a difference of 46.3%.
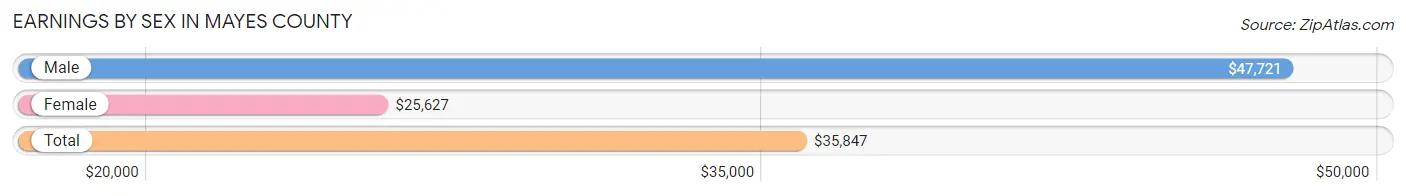
| Sex | Number | Average Earnings |
| Male | 9,940 (53.6%) | $47,721 |
| Female | 8,609 (46.4%) | $25,627 |
| Total | 18,549 (100.0%) | $35,847 |
Earnings by Sex by Income Bracket in Mayes County
The most common earnings brackets in Mayes County are $75,000 to $99,999 for men (1,419 | 14.3%) and $40,000 to $44,999 for women (707 | 8.2%).
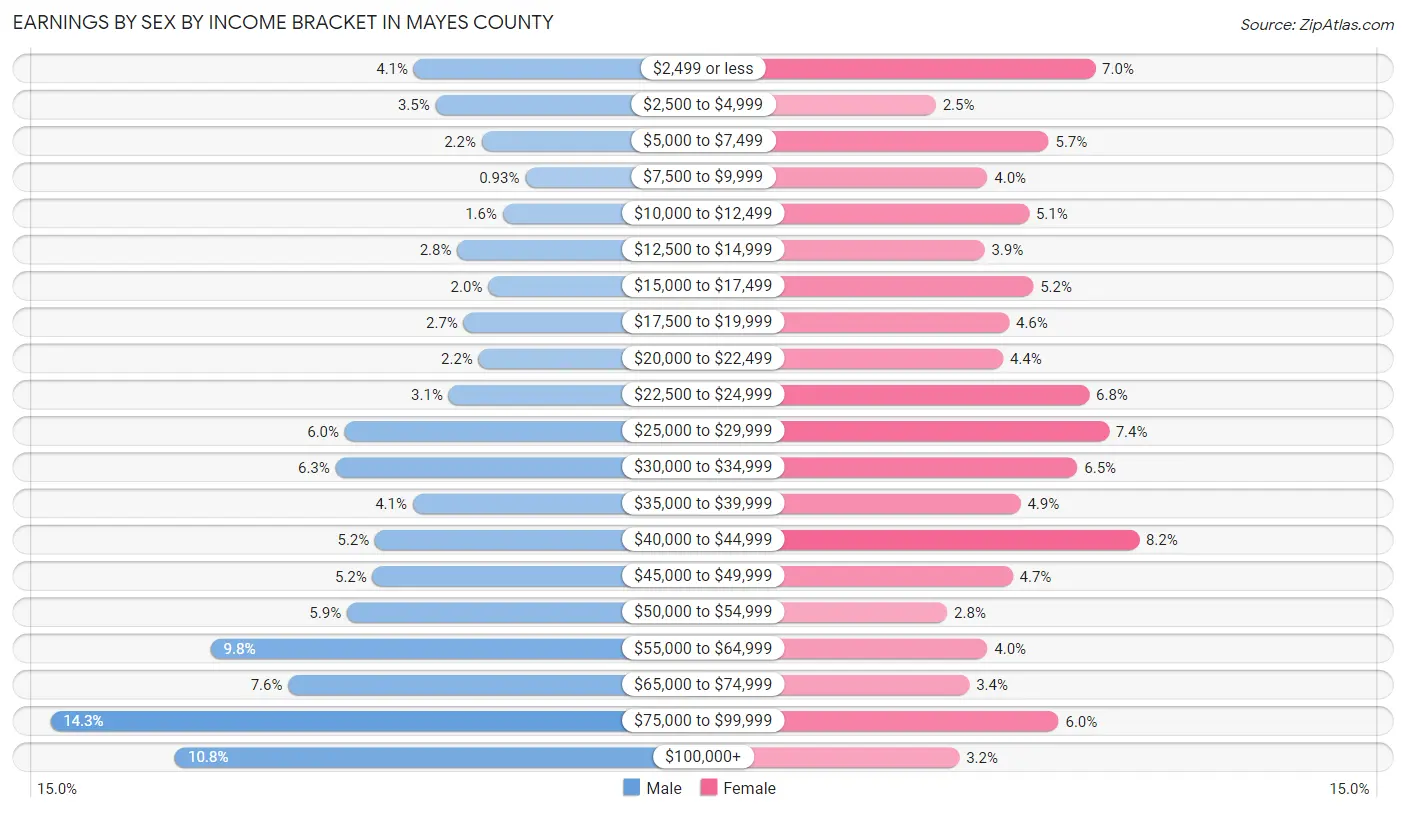
| Income | Male | Female |
| $2,499 or less | 404 (4.1%) | 601 (7.0%) |
| $2,500 to $4,999 | 343 (3.5%) | 215 (2.5%) |
| $5,000 to $7,499 | 214 (2.1%) | 488 (5.7%) |
| $7,500 to $9,999 | 92 (0.9%) | 340 (4.0%) |
| $10,000 to $12,499 | 155 (1.6%) | 441 (5.1%) |
| $12,500 to $14,999 | 282 (2.8%) | 333 (3.9%) |
| $15,000 to $17,499 | 196 (2.0%) | 451 (5.2%) |
| $17,500 to $19,999 | 264 (2.7%) | 393 (4.6%) |
| $20,000 to $22,499 | 223 (2.2%) | 378 (4.4%) |
| $22,500 to $24,999 | 306 (3.1%) | 586 (6.8%) |
| $25,000 to $29,999 | 596 (6.0%) | 634 (7.4%) |
| $30,000 to $34,999 | 622 (6.3%) | 558 (6.5%) |
| $35,000 to $39,999 | 407 (4.1%) | 420 (4.9%) |
| $40,000 to $44,999 | 512 (5.1%) | 707 (8.2%) |
| $45,000 to $49,999 | 519 (5.2%) | 401 (4.7%) |
| $50,000 to $54,999 | 590 (5.9%) | 243 (2.8%) |
| $55,000 to $64,999 | 971 (9.8%) | 340 (4.0%) |
| $65,000 to $74,999 | 754 (7.6%) | 296 (3.4%) |
| $75,000 to $99,999 | 1,419 (14.3%) | 512 (5.9%) |
| $100,000+ | 1,071 (10.8%) | 272 (3.2%) |
| Total | 9,940 (100.0%) | 8,609 (100.0%) |
Earnings by Sex by Educational Attainment in Mayes County
Average earnings in Mayes County are $53,359 for men and $28,816 for women, a difference of 46.0%. Men with an educational attainment of graduate degree enjoy the highest average annual earnings of $84,514, while those with less than high school education earn the least with $40,817. Women with an educational attainment of graduate degree earn the most with the average annual earnings of $51,452, while those with less than high school education have the smallest earnings of $19,804.
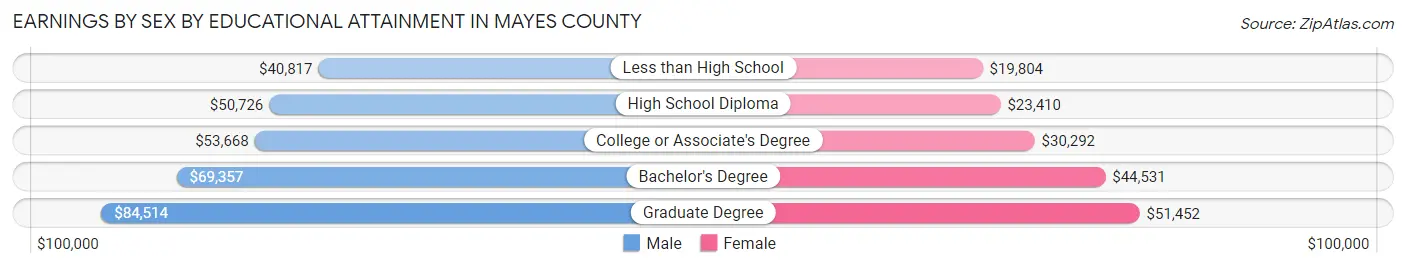
| Educational Attainment | Male Income | Female Income |
| Less than High School | $40,817 | $19,804 |
| High School Diploma | $50,726 | $23,410 |
| College or Associate's Degree | $53,668 | $30,292 |
| Bachelor's Degree | $69,357 | $44,531 |
| Graduate Degree | $84,514 | $51,452 |
| Total | $53,359 | $28,816 |
Family Income in Mayes County
Family Income Brackets in Mayes County
According to the Mayes County family income data, there are 2,184 families falling into the $100,000 to $149,999 income range, which is the most common income bracket and makes up 20.8% of all families. Conversely, the $10,000 to $14,999 income bracket is the least frequent group with only 231 families (2.2%) belonging to this category.
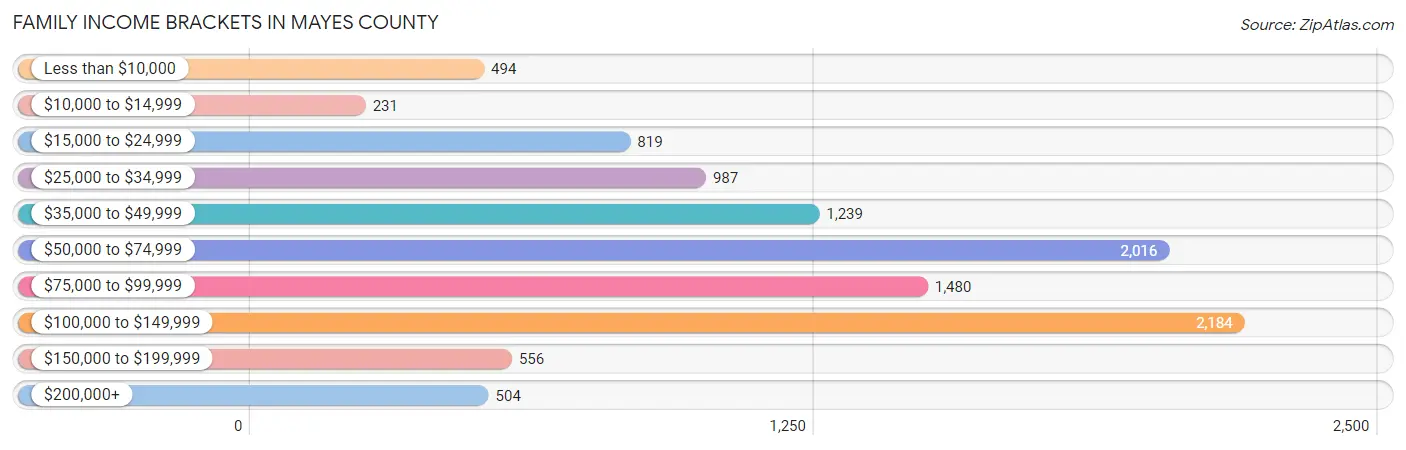
| Income Bracket | # Families | % Families |
| Less than $10,000 | 494 | 4.7% |
| $10,000 to $14,999 | 231 | 2.2% |
| $15,000 to $24,999 | 819 | 7.8% |
| $25,000 to $34,999 | 987 | 9.4% |
| $35,000 to $49,999 | 1,239 | 11.8% |
| $50,000 to $74,999 | 2,016 | 19.2% |
| $75,000 to $99,999 | 1,480 | 14.1% |
| $100,000 to $149,999 | 2,184 | 20.8% |
| $150,000 to $199,999 | 556 | 5.3% |
| $200,000+ | 504 | 4.8% |
Family Income by Famaliy Size in Mayes County
7+ person families (120 | 1.1%) account for the highest median family income in Mayes County with $86,000 per family, while 2-person families (5,222 | 49.7%) have the highest median income of $34,070 per family member.
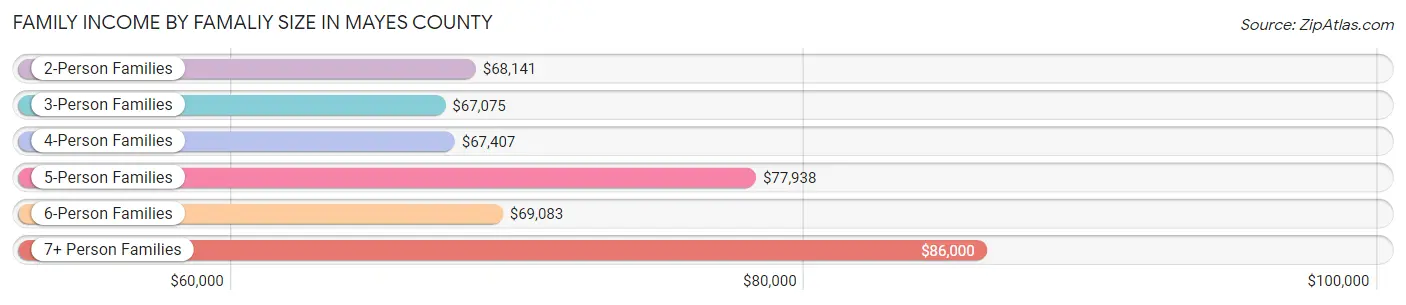
| Income Bracket | # Families | Median Income |
| 2-Person Families | 5,222 (49.7%) | $68,141 |
| 3-Person Families | 2,002 (19.1%) | $67,075 |
| 4-Person Families | 1,799 (17.1%) | $67,407 |
| 5-Person Families | 1,029 (9.8%) | $77,938 |
| 6-Person Families | 328 (3.1%) | $69,083 |
| 7+ Person Families | 120 (1.1%) | $86,000 |
| Total | 10,500 (100.0%) | $68,826 |
Family Income by Number of Earners in Mayes County
The median family income in Mayes County is $68,826, with families comprising 3+ earners (796) having the highest median family income of $114,444, while families with no earners (2,038) have the lowest median family income of $36,786, accounting for 7.6% and 19.4% of families, respectively.
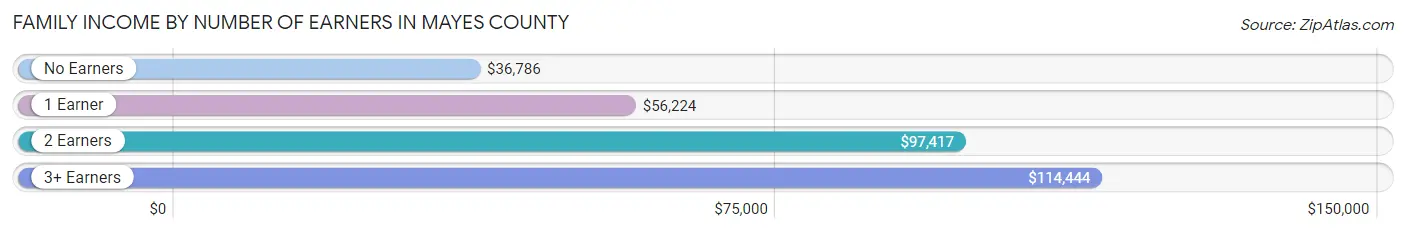
| Number of Earners | # Families | Median Income |
| No Earners | 2,038 (19.4%) | $36,786 |
| 1 Earner | 3,827 (36.4%) | $56,224 |
| 2 Earners | 3,839 (36.6%) | $97,417 |
| 3+ Earners | 796 (7.6%) | $114,444 |
| Total | 10,500 (100.0%) | $68,826 |
Household Income in Mayes County
Household Income Brackets in Mayes County
With 2,599 households falling in the category, the $50,000 to $74,999 income range is the most frequent in Mayes County, accounting for 17.2% of all households. In contrast, only 574 households (3.8%) fall into the $200,000+ income bracket, making it the least populous group.
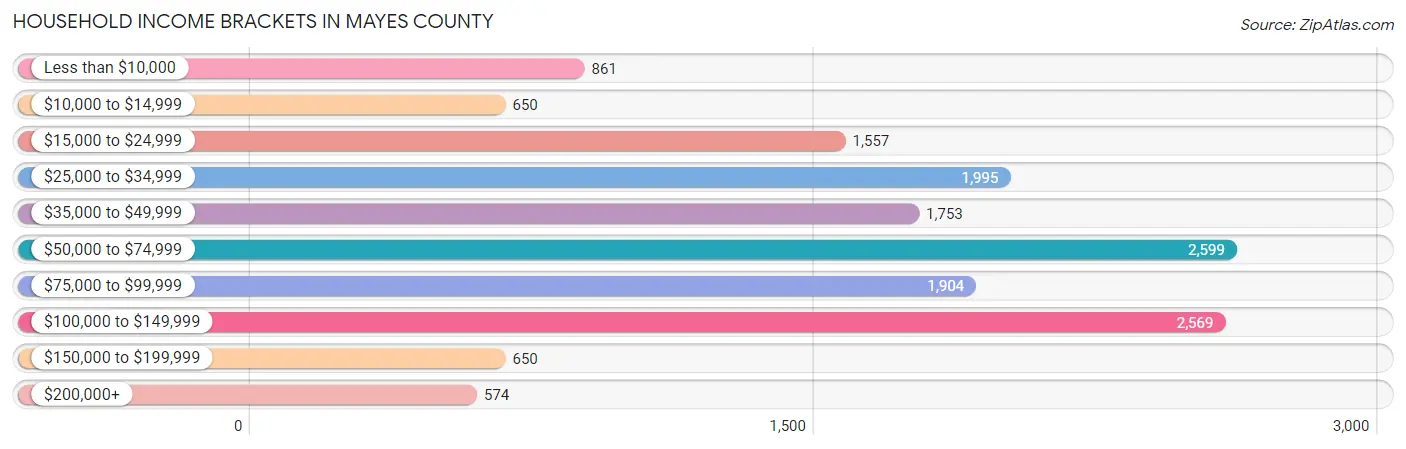
| Income Bracket | # Households | % Households |
| Less than $10,000 | 861 | 5.7% |
| $10,000 to $14,999 | 650 | 4.3% |
| $15,000 to $24,999 | 1,557 | 10.3% |
| $25,000 to $34,999 | 1,995 | 13.2% |
| $35,000 to $49,999 | 1,753 | 11.6% |
| $50,000 to $74,999 | 2,599 | 17.2% |
| $75,000 to $99,999 | 1,904 | 12.6% |
| $100,000 to $149,999 | 2,569 | 17.0% |
| $150,000 to $199,999 | 650 | 4.3% |
| $200,000+ | 574 | 3.8% |
Household Income by Householder Age in Mayes County
The median household income in Mayes County is $56,552, with the highest median household income of $73,077 found in the 45 to 64 years age bracket for the primary householder. A total of 5,592 households (37.0%) fall into this category. Meanwhile, the 65+ years age bracket for the primary householder has the lowest median household income of $40,426, with 4,511 households (29.8%) in this group.
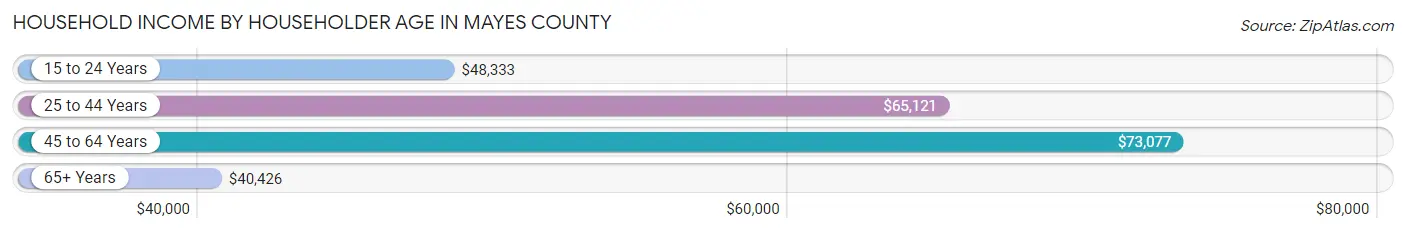
| Income Bracket | # Households | Median Income |
| 15 to 24 Years | 504 (3.3%) | $48,333 |
| 25 to 44 Years | 4,505 (29.8%) | $65,121 |
| 45 to 64 Years | 5,592 (37.0%) | $73,077 |
| 65+ Years | 4,511 (29.8%) | $40,426 |
| Total | 15,112 (100.0%) | $56,552 |
Poverty in Mayes County
Income Below Poverty by Sex and Age in Mayes County
With 14.3% poverty level for males and 19.8% for females among the residents of Mayes County, 15 year old males and under 5 year old females are the most vulnerable to poverty, with 77 males (32.5%) and 327 females (31.8%) in their respective age groups living below the poverty level.
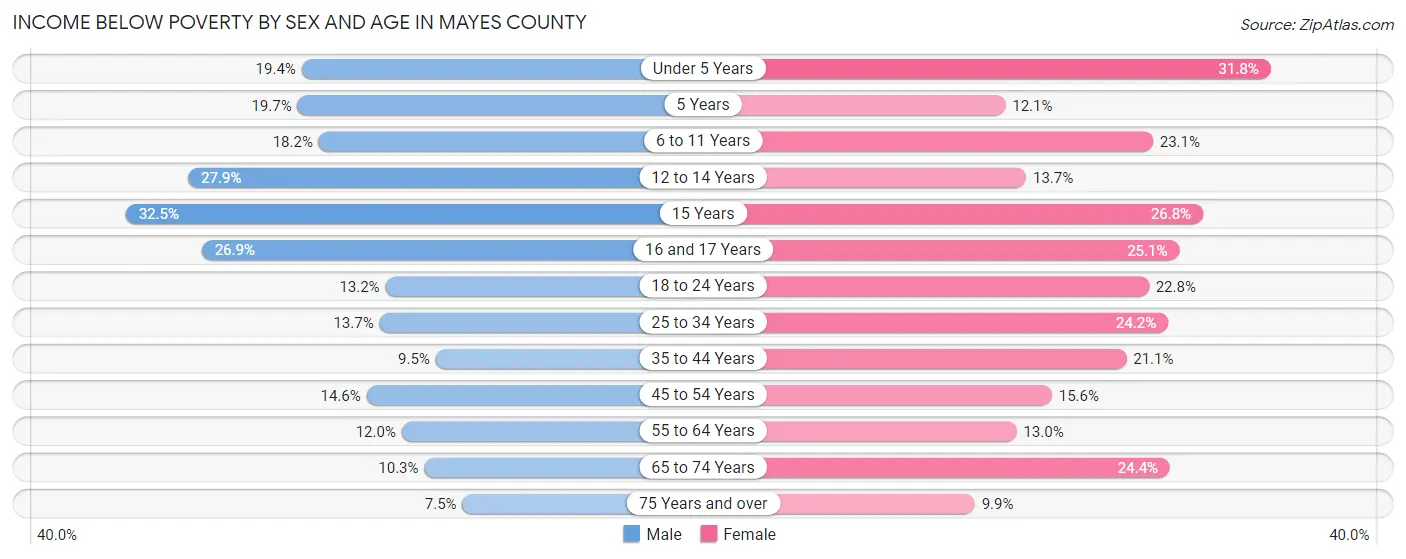
| Age Bracket | Male | Female |
| Under 5 Years | 204 (19.4%) | 327 (31.8%) |
| 5 Years | 60 (19.7%) | 34 (12.1%) |
| 6 to 11 Years | 278 (18.2%) | 362 (23.1%) |
| 12 to 14 Years | 236 (27.9%) | 87 (13.7%) |
| 15 Years | 77 (32.5%) | 74 (26.8%) |
| 16 and 17 Years | 156 (26.9%) | 115 (25.1%) |
| 18 to 24 Years | 231 (13.2%) | 343 (22.8%) |
| 25 to 34 Years | 317 (13.7%) | 583 (24.2%) |
| 35 to 44 Years | 221 (9.5%) | 484 (21.1%) |
| 45 to 54 Years | 364 (14.6%) | 366 (15.6%) |
| 55 to 64 Years | 322 (12.0%) | 346 (13.0%) |
| 65 to 74 Years | 210 (10.3%) | 556 (24.4%) |
| 75 Years and over | 91 (7.5%) | 155 (9.9%) |
| Total | 2,767 (14.3%) | 3,832 (19.8%) |
Income Above Poverty by Sex and Age in Mayes County
According to the poverty statistics in Mayes County, males aged 75 years and over and females aged 75 years and over are the age groups that are most secure financially, with 92.5% of males and 90.1% of females in these age groups living above the poverty line.
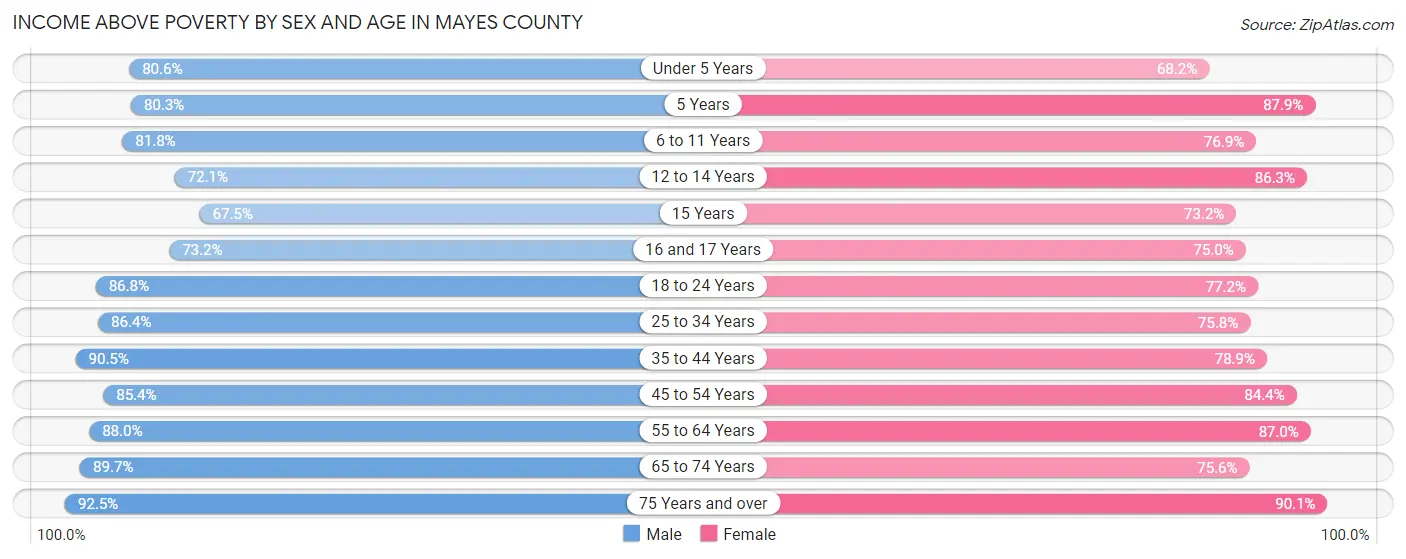
| Age Bracket | Male | Female |
| Under 5 Years | 846 (80.6%) | 700 (68.2%) |
| 5 Years | 244 (80.3%) | 246 (87.9%) |
| 6 to 11 Years | 1,253 (81.8%) | 1,206 (76.9%) |
| 12 to 14 Years | 611 (72.1%) | 549 (86.3%) |
| 15 Years | 160 (67.5%) | 202 (73.2%) |
| 16 and 17 Years | 425 (73.2%) | 344 (75.0%) |
| 18 to 24 Years | 1,518 (86.8%) | 1,162 (77.2%) |
| 25 to 34 Years | 2,005 (86.4%) | 1,824 (75.8%) |
| 35 to 44 Years | 2,111 (90.5%) | 1,808 (78.9%) |
| 45 to 54 Years | 2,128 (85.4%) | 1,981 (84.4%) |
| 55 to 64 Years | 2,361 (88.0%) | 2,321 (87.0%) |
| 65 to 74 Years | 1,825 (89.7%) | 1,726 (75.6%) |
| 75 Years and over | 1,124 (92.5%) | 1,415 (90.1%) |
| Total | 16,611 (85.7%) | 15,484 (80.2%) |
Income Below Poverty Among Married-Couple Families in Mayes County
The poverty statistics for married-couple families in Mayes County show that 9.3% or 727 of the total 7,824 families live below the poverty line. Families with 3 or 4 children have the highest poverty rate of 16.0%, comprising of 127 families. On the other hand, families with 5 or more children have the lowest poverty rate of 0.0%, which includes 0 families.
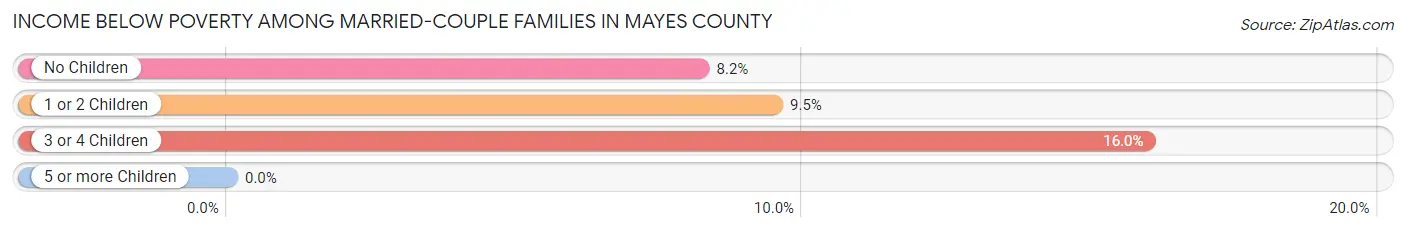
| Children | Above Poverty | Below Poverty |
| No Children | 4,374 (91.8%) | 391 (8.2%) |
| 1 or 2 Children | 1,994 (90.5%) | 209 (9.5%) |
| 3 or 4 Children | 668 (84.0%) | 127 (16.0%) |
| 5 or more Children | 61 (100.0%) | 0 (0.0%) |
| Total | 7,097 (90.7%) | 727 (9.3%) |
Income Below Poverty Among Single-Parent Households in Mayes County
According to the poverty data in Mayes County, 11.6% or 98 single-father households and 33.9% or 621 single-mother households are living below the poverty line. Among single-father households, those with no children have the highest poverty rate, with 42 households (13.1%) experiencing poverty. Likewise, among single-mother households, those with 3 or 4 children have the highest poverty rate, with 242 households (77.1%) falling below the poverty line.
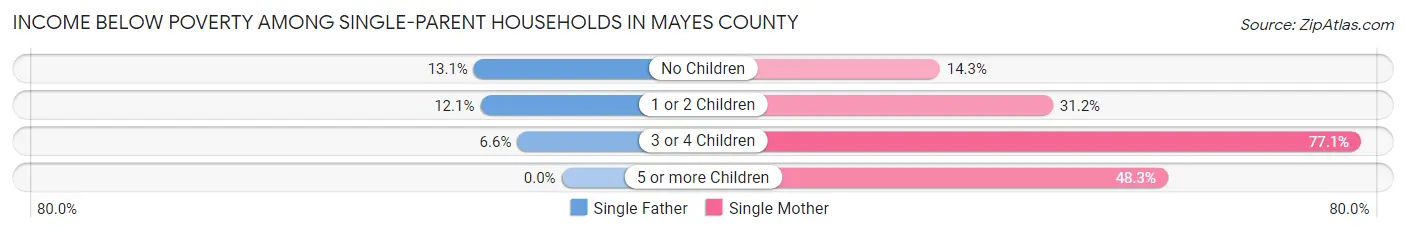
| Children | Single Father | Single Mother |
| No Children | 42 (13.1%) | 85 (14.3%) |
| 1 or 2 Children | 50 (12.1%) | 280 (31.2%) |
| 3 or 4 Children | 6 (6.6%) | 242 (77.1%) |
| 5 or more Children | 0 (0.0%) | 14 (48.3%) |
| Total | 98 (11.6%) | 621 (33.9%) |
Income Below Poverty Among Married-Couple vs Single-Parent Households in Mayes County
The poverty data for Mayes County shows that 727 of the married-couple family households (9.3%) and 719 of the single-parent households (26.9%) are living below the poverty level. Within the married-couple family households, those with 3 or 4 children have the highest poverty rate, with 127 households (16.0%) falling below the poverty line. Among the single-parent households, those with 3 or 4 children have the highest poverty rate, with 248 household (61.2%) living below poverty.
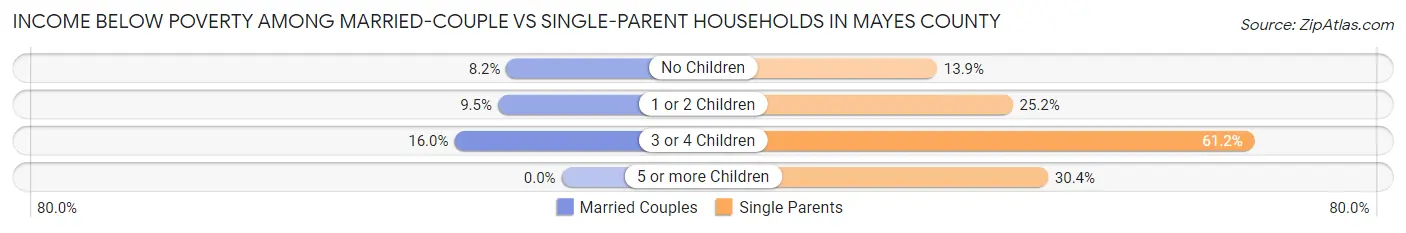
| Children | Married-Couple Families | Single-Parent Households |
| No Children | 391 (8.2%) | 127 (13.9%) |
| 1 or 2 Children | 209 (9.5%) | 330 (25.2%) |
| 3 or 4 Children | 127 (16.0%) | 248 (61.2%) |
| 5 or more Children | 0 (0.0%) | 14 (30.4%) |
| Total | 727 (9.3%) | 719 (26.9%) |
Employment Characteristics in Mayes County
Employment by Class of Employer in Mayes County
Among the 16,439 employed individuals in Mayes County, private company employees (11,572 | 70.4%), self-employed (not incorporated) (1,365 | 8.3%), and state government employees (933 | 5.7%) make up the most common classes of employment.
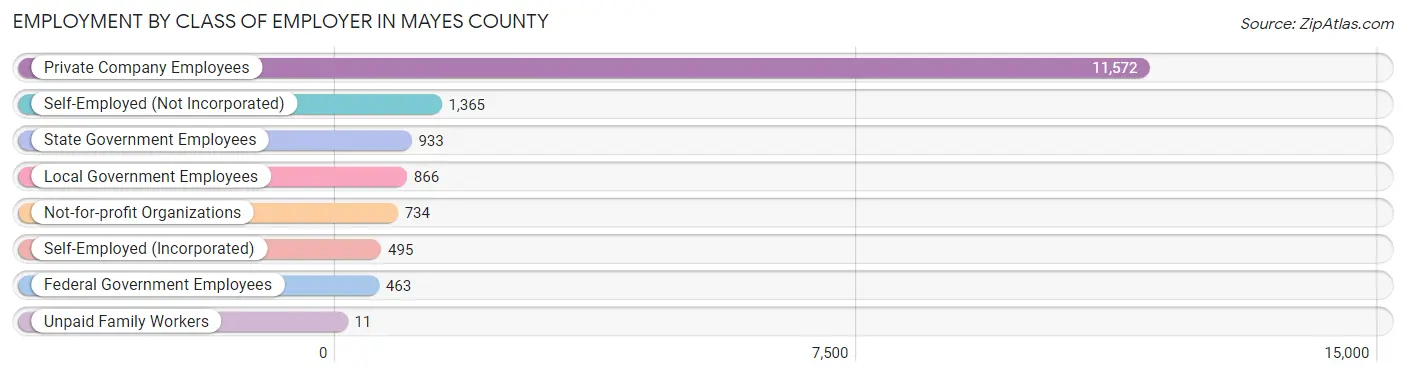
| Employer Class | # Employees | % Employees |
| Private Company Employees | 11,572 | 70.4% |
| Self-Employed (Incorporated) | 495 | 3.0% |
| Self-Employed (Not Incorporated) | 1,365 | 8.3% |
| Not-for-profit Organizations | 734 | 4.5% |
| Local Government Employees | 866 | 5.3% |
| State Government Employees | 933 | 5.7% |
| Federal Government Employees | 463 | 2.8% |
| Unpaid Family Workers | 11 | 0.1% |
| Total | 16,439 | 100.0% |
Employment Status by Age in Mayes County
According to the labor force statistics for Mayes County, out of the total population over 16 years of age (31,237), 56.6% or 17,680 individuals are in the labor force, with 5.9% or 1,043 of them unemployed. The age group with the highest labor force participation rate is 35 to 44 years, with 79.2% or 3,703 individuals in the labor force. Within the labor force, the 16 to 19 years age range has the highest percentage of unemployed individuals, with 17.2% or 116 of them being unemployed.
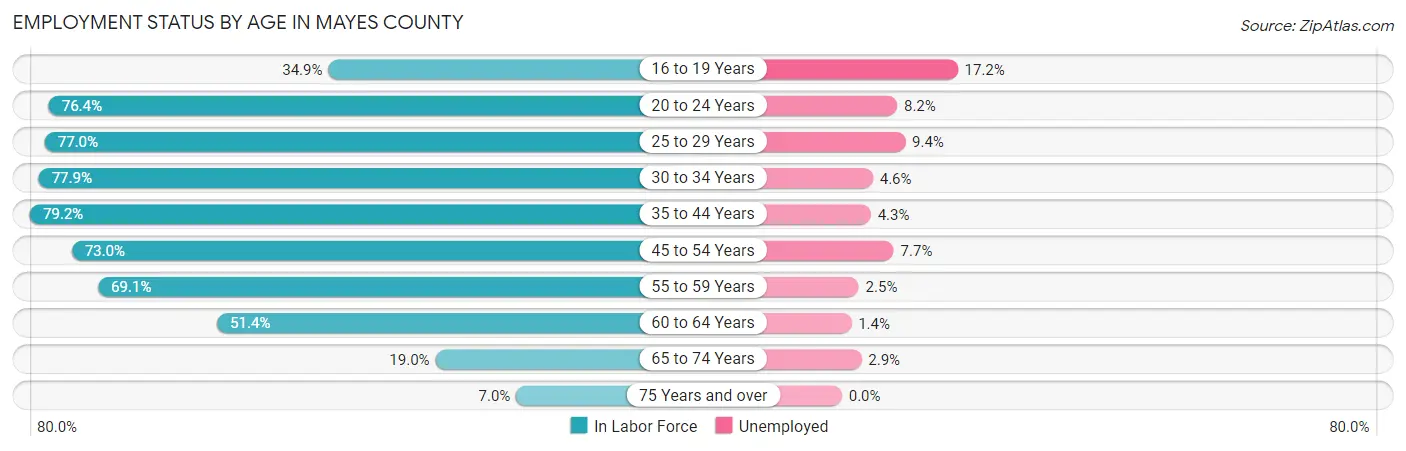
| Age Bracket | In Labor Force | Unemployed |
| 16 to 19 Years | 676 (34.9%) | 116 (17.2%) |
| 20 to 24 Years | 1,811 (76.4%) | 149 (8.2%) |
| 25 to 29 Years | 1,866 (77.0%) | 175 (9.4%) |
| 30 to 34 Years | 1,813 (77.9%) | 83 (4.6%) |
| 35 to 44 Years | 3,703 (79.2%) | 159 (4.3%) |
| 45 to 54 Years | 3,536 (73.0%) | 272 (7.7%) |
| 55 to 59 Years | 1,827 (69.1%) | 46 (2.5%) |
| 60 to 64 Years | 1,399 (51.4%) | 20 (1.4%) |
| 65 to 74 Years | 834 (19.0%) | 24 (2.9%) |
| 75 Years and over | 203 (7.0%) | 0 (0.0%) |
| Total | 17,680 (56.6%) | 1,043 (5.9%) |
Employment Status by Educational Attainment in Mayes County
According to labor force statistics for Mayes County, 72.0% of individuals (14,138) out of the total population between 25 and 64 years of age (19,636) are in the labor force, with 5.3% or 749 of them being unemployed. The group with the highest labor force participation rate are those with the educational attainment of bachelor's degree or higher, with 86.1% or 2,772 individuals in the labor force. Within the labor force, individuals with less than high school education have the highest percentage of unemployment, with 11.6% or 121 of them being unemployed.
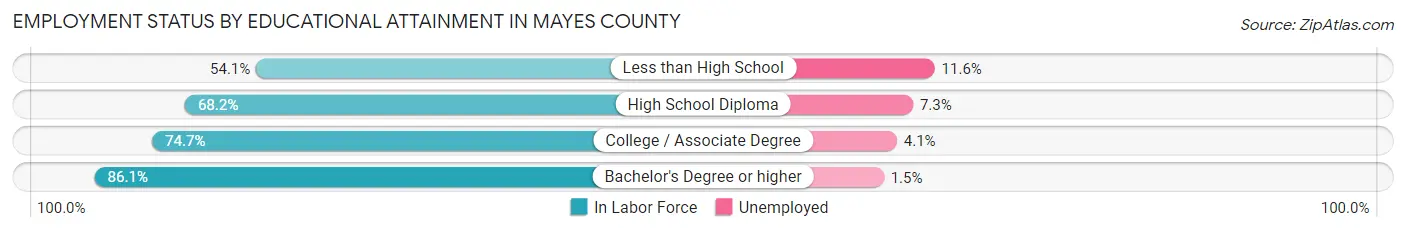
| Educational Attainment | In Labor Force | Unemployed |
| Less than High School | 1,047 (54.1%) | 224 (11.6%) |
| High School Diploma | 5,187 (68.2%) | 555 (7.3%) |
| College / Associate Degree | 5,136 (74.7%) | 282 (4.1%) |
| Bachelor's Degree or higher | 2,772 (86.1%) | 48 (1.5%) |
| Total | 14,138 (72.0%) | 1,041 (5.3%) |
Employment Occupations by Sex in Mayes County
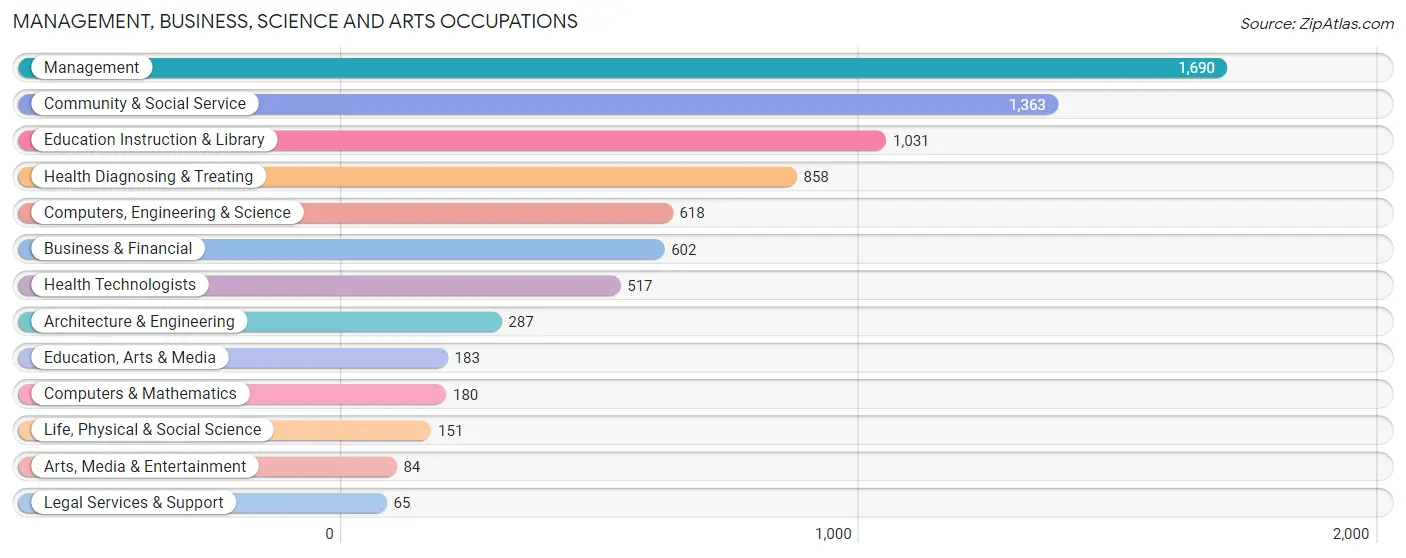
Management, Business, Science and Arts Occupations
The most common Management, Business, Science and Arts occupations in Mayes County are Management (1,690 | 10.2%), Community & Social Service (1,363 | 8.2%), Education Instruction & Library (1,031 | 6.2%), Health Diagnosing & Treating (858 | 5.2%), and Computers, Engineering & Science (618 | 3.7%).
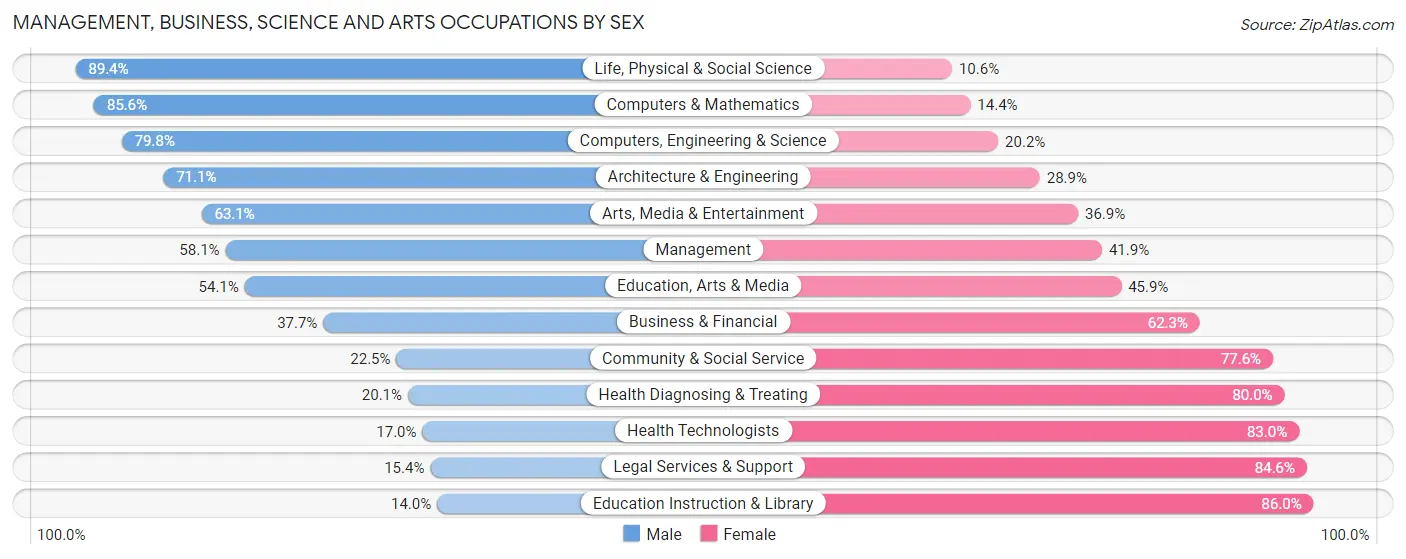
Management, Business, Science and Arts Occupations by Sex
Within the Management, Business, Science and Arts occupations in Mayes County, the most male-oriented occupations are Life, Physical & Social Science (89.4%), Computers & Mathematics (85.6%), and Computers, Engineering & Science (79.8%), while the most female-oriented occupations are Education Instruction & Library (86.0%), Legal Services & Support (84.6%), and Health Technologists (83.0%).
| Occupation | Male | Female |
| Management | 982 (58.1%) | 708 (41.9%) |
| Business & Financial | 227 (37.7%) | 375 (62.3%) |
| Computers, Engineering & Science | 493 (79.8%) | 125 (20.2%) |
| Computers & Mathematics | 154 (85.6%) | 26 (14.4%) |
| Architecture & Engineering | 204 (71.1%) | 83 (28.9%) |
| Life, Physical & Social Science | 135 (89.4%) | 16 (10.6%) |
| Community & Social Service | 306 (22.5%) | 1,057 (77.5%) |
| Education, Arts & Media | 99 (54.1%) | 84 (45.9%) |
| Legal Services & Support | 10 (15.4%) | 55 (84.6%) |
| Education Instruction & Library | 144 (14.0%) | 887 (86.0%) |
| Arts, Media & Entertainment | 53 (63.1%) | 31 (36.9%) |
| Health Diagnosing & Treating | 172 (20.1%) | 686 (79.9%) |
| Health Technologists | 88 (17.0%) | 429 (83.0%) |
| Total (Category) | 2,180 (42.5%) | 2,951 (57.5%) |
| Total (Overall) | 9,001 (54.1%) | 7,620 (45.9%) |
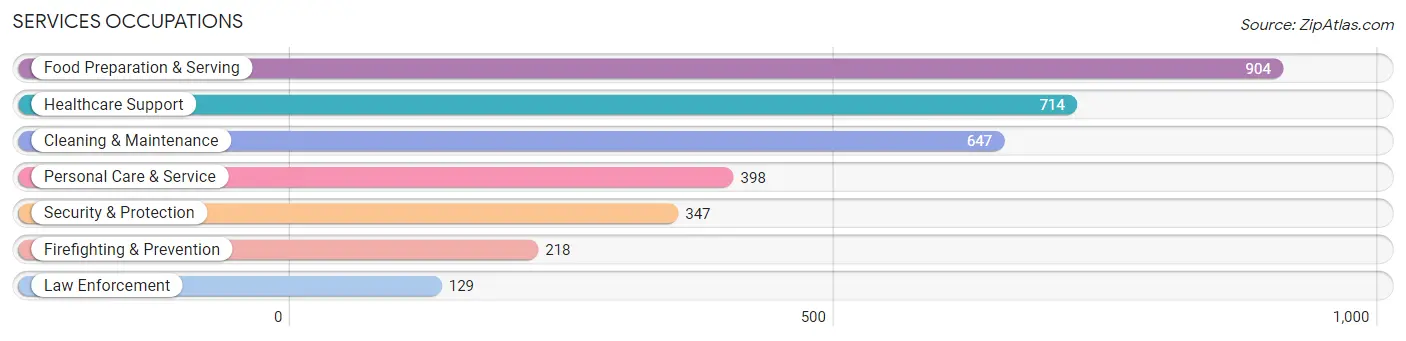
Services Occupations
The most common Services occupations in Mayes County are Food Preparation & Serving (904 | 5.4%), Healthcare Support (714 | 4.3%), Cleaning & Maintenance (647 | 3.9%), Personal Care & Service (398 | 2.4%), and Security & Protection (347 | 2.1%).
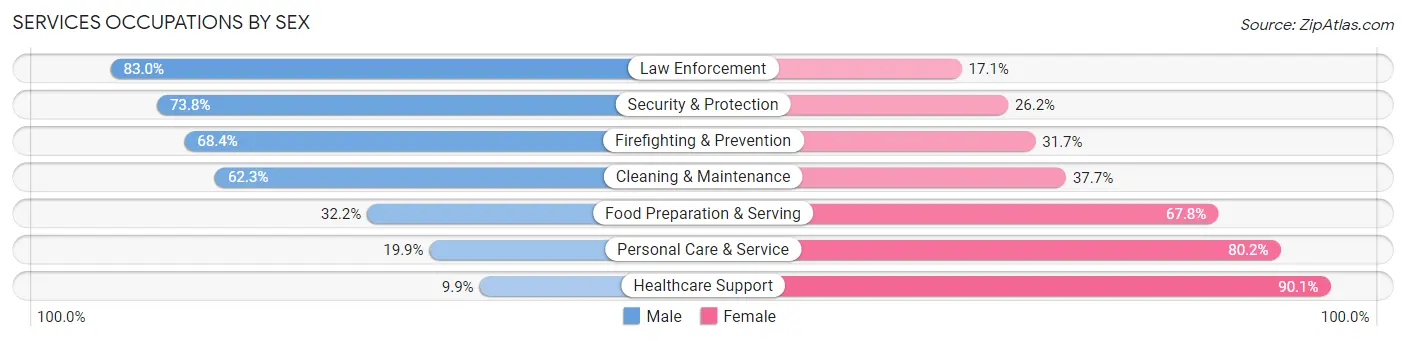
Services Occupations by Sex
Within the Services occupations in Mayes County, the most male-oriented occupations are Law Enforcement (83.0%), Security & Protection (73.8%), and Firefighting & Prevention (68.3%), while the most female-oriented occupations are Healthcare Support (90.1%), Personal Care & Service (80.1%), and Food Preparation & Serving (67.8%).
| Occupation | Male | Female |
| Healthcare Support | 71 (9.9%) | 643 (90.1%) |
| Security & Protection | 256 (73.8%) | 91 (26.2%) |
| Firefighting & Prevention | 149 (68.3%) | 69 (31.7%) |
| Law Enforcement | 107 (83.0%) | 22 (17.1%) |
| Food Preparation & Serving | 291 (32.2%) | 613 (67.8%) |
| Cleaning & Maintenance | 403 (62.3%) | 244 (37.7%) |
| Personal Care & Service | 79 (19.9%) | 319 (80.1%) |
| Total (Category) | 1,100 (36.5%) | 1,910 (63.5%) |
| Total (Overall) | 9,001 (54.1%) | 7,620 (45.9%) |
Sales and Office Occupations
The most common Sales and Office occupations in Mayes County are Office & Administration (1,528 | 9.2%), and Sales & Related (1,481 | 8.9%).

Sales and Office Occupations by Sex

| Occupation | Male | Female |
| Sales & Related | 517 (34.9%) | 964 (65.1%) |
| Office & Administration | 270 (17.7%) | 1,258 (82.3%) |
| Total (Category) | 787 (26.2%) | 2,222 (73.9%) |
| Total (Overall) | 9,001 (54.1%) | 7,620 (45.9%) |
Natural Resources, Construction and Maintenance Occupations
The most common Natural Resources, Construction and Maintenance occupations in Mayes County are Construction & Extraction (1,098 | 6.6%), Installation, Maintenance & Repair (939 | 5.7%), and Farming, Fishing & Forestry (188 | 1.1%).
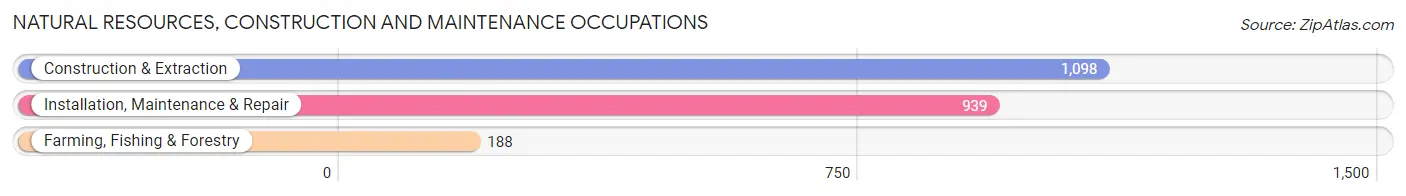
Natural Resources, Construction and Maintenance Occupations by Sex
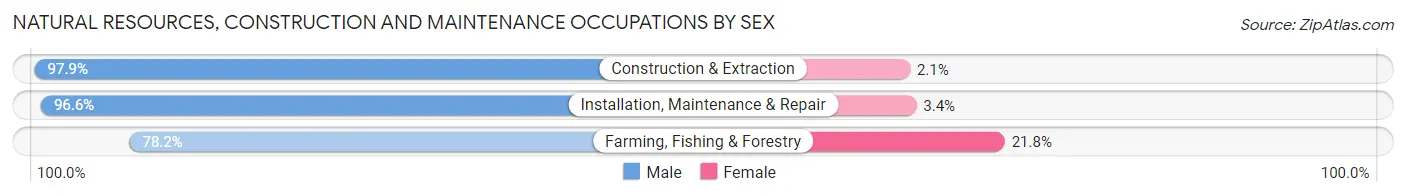
| Occupation | Male | Female |
| Farming, Fishing & Forestry | 147 (78.2%) | 41 (21.8%) |
| Construction & Extraction | 1,075 (97.9%) | 23 (2.1%) |
| Installation, Maintenance & Repair | 907 (96.6%) | 32 (3.4%) |
| Total (Category) | 2,129 (95.7%) | 96 (4.3%) |
| Total (Overall) | 9,001 (54.1%) | 7,620 (45.9%) |
Production, Transportation and Moving Occupations
The most common Production, Transportation and Moving occupations in Mayes County are Production (1,651 | 9.9%), Material Moving (894 | 5.4%), and Transportation (701 | 4.2%).
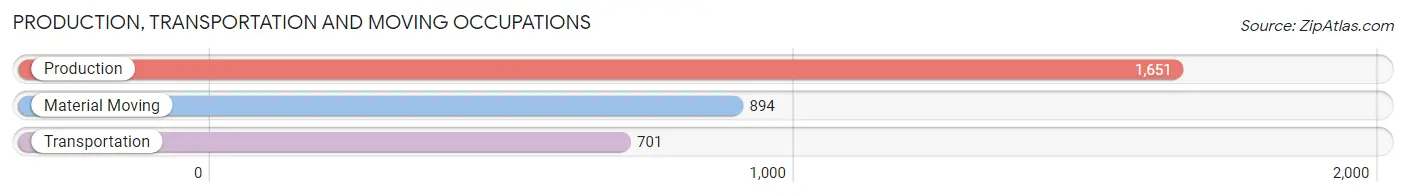
Production, Transportation and Moving Occupations by Sex
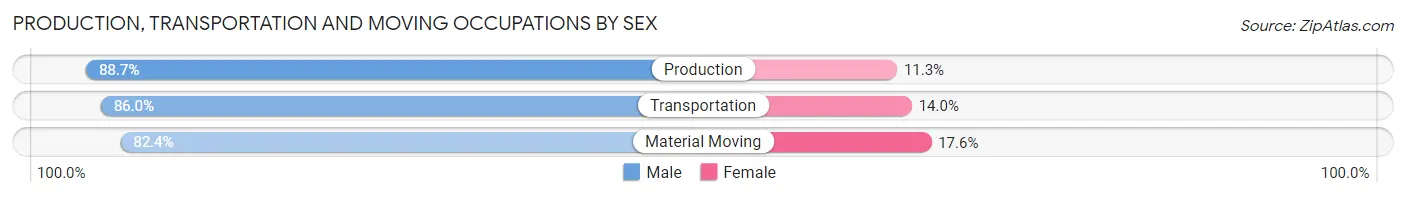
| Occupation | Male | Female |
| Production | 1,465 (88.7%) | 186 (11.3%) |
| Transportation | 603 (86.0%) | 98 (14.0%) |
| Material Moving | 737 (82.4%) | 157 (17.6%) |
| Total (Category) | 2,805 (86.4%) | 441 (13.6%) |
| Total (Overall) | 9,001 (54.1%) | 7,620 (45.9%) |
Employment Industries by Sex in Mayes County
Employment Industries in Mayes County
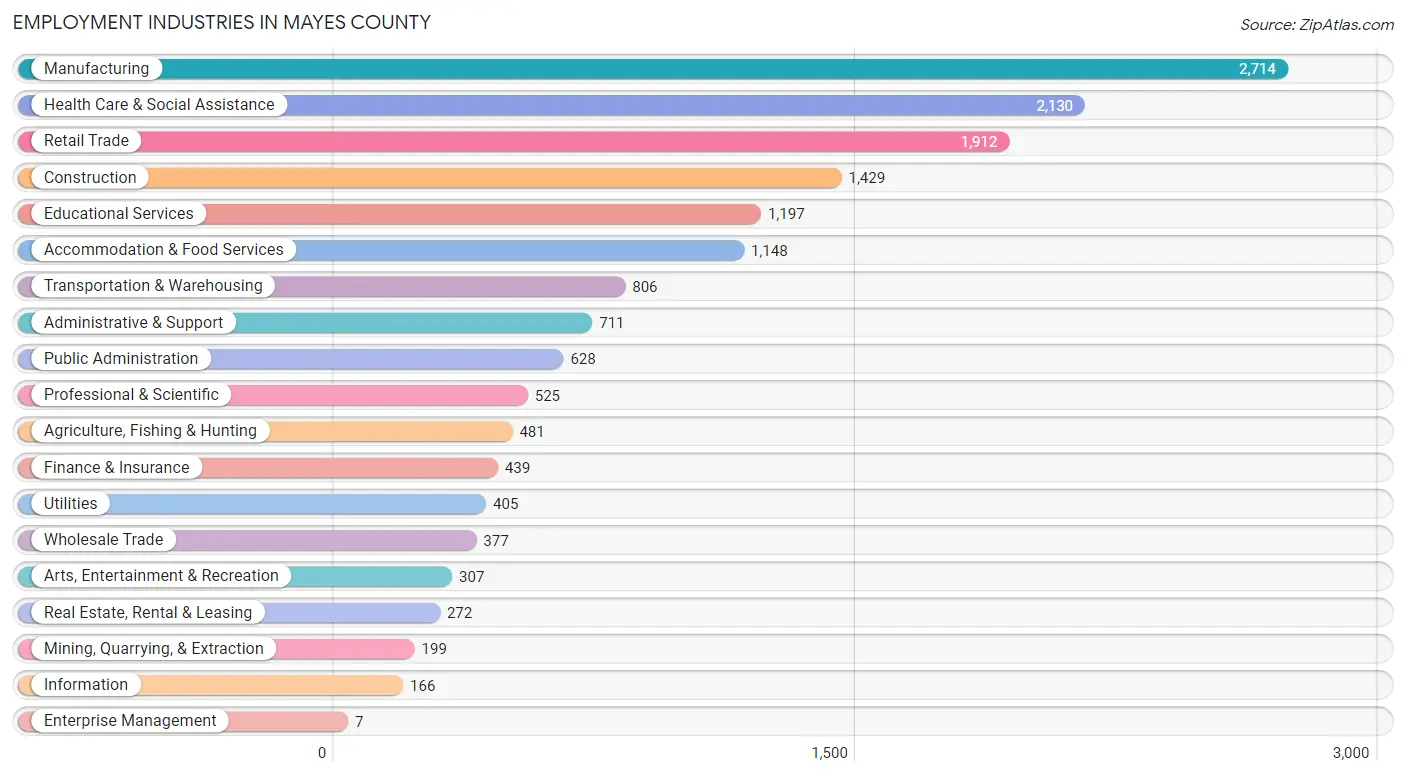
The major employment industries in Mayes County include Manufacturing (2,714 | 16.3%), Health Care & Social Assistance (2,130 | 12.8%), Retail Trade (1,912 | 11.5%), Construction (1,429 | 8.6%), and Educational Services (1,197 | 7.2%).
Employment Industries by Sex in Mayes County
The Mayes County industries that see more men than women are Enterprise Management (100.0%), Mining, Quarrying, & Extraction (94.0%), and Construction (89.1%), whereas the industries that tend to have a higher number of women are Health Care & Social Assistance (87.3%), Educational Services (82.5%), and Finance & Insurance (77.0%).
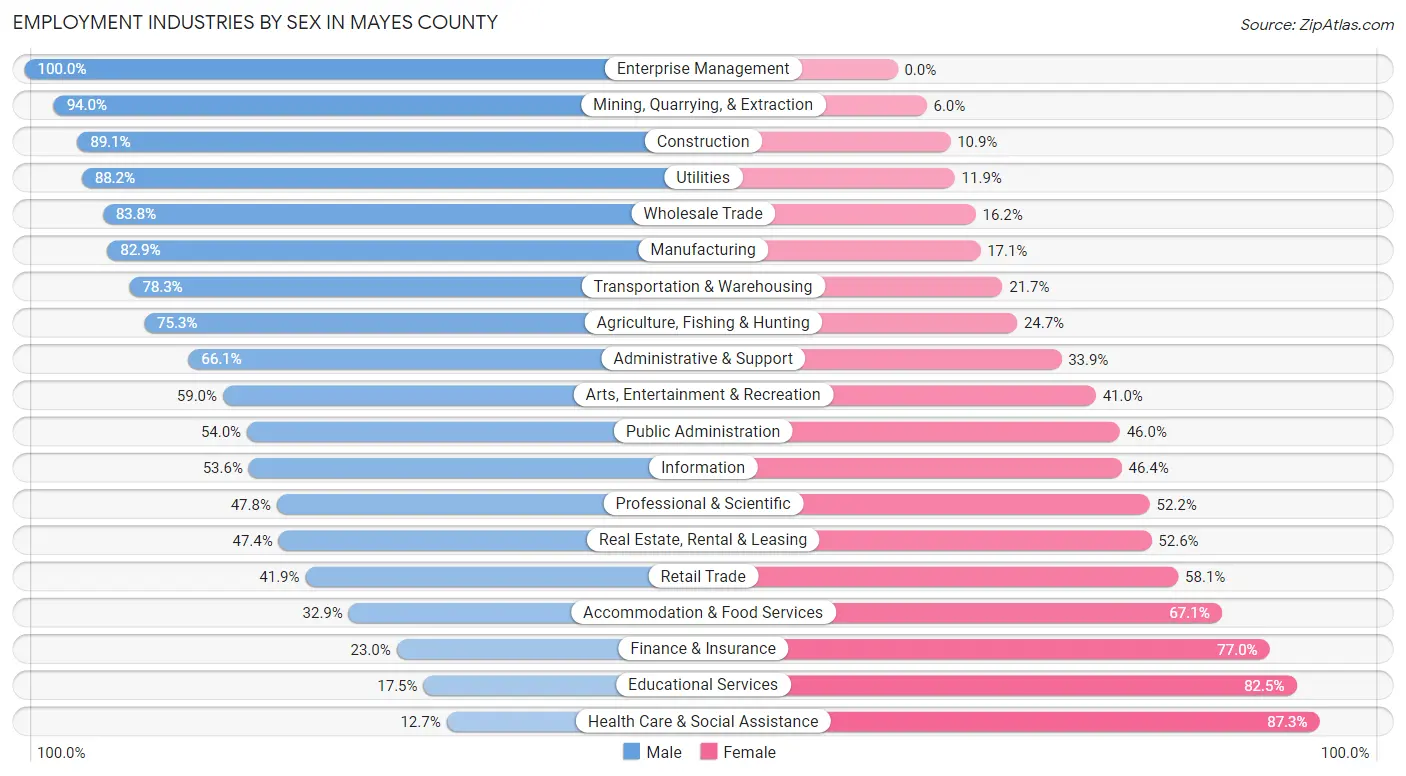
| Industry | Male | Female |
| Agriculture, Fishing & Hunting | 362 (75.3%) | 119 (24.7%) |
| Mining, Quarrying, & Extraction | 187 (94.0%) | 12 (6.0%) |
| Construction | 1,273 (89.1%) | 156 (10.9%) |
| Manufacturing | 2,249 (82.9%) | 465 (17.1%) |
| Wholesale Trade | 316 (83.8%) | 61 (16.2%) |
| Retail Trade | 801 (41.9%) | 1,111 (58.1%) |
| Transportation & Warehousing | 631 (78.3%) | 175 (21.7%) |
| Utilities | 357 (88.1%) | 48 (11.8%) |
| Information | 89 (53.6%) | 77 (46.4%) |
| Finance & Insurance | 101 (23.0%) | 338 (77.0%) |
| Real Estate, Rental & Leasing | 129 (47.4%) | 143 (52.6%) |
| Professional & Scientific | 251 (47.8%) | 274 (52.2%) |
| Enterprise Management | 7 (100.0%) | 0 (0.0%) |
| Administrative & Support | 470 (66.1%) | 241 (33.9%) |
| Educational Services | 209 (17.5%) | 988 (82.5%) |
| Health Care & Social Assistance | 270 (12.7%) | 1,860 (87.3%) |
| Arts, Entertainment & Recreation | 181 (59.0%) | 126 (41.0%) |
| Accommodation & Food Services | 378 (32.9%) | 770 (67.1%) |
| Public Administration | 339 (54.0%) | 289 (46.0%) |
| Total | 9,001 (54.1%) | 7,620 (45.9%) |
Education in Mayes County
School Enrollment in Mayes County
The most common levels of schooling among the 8,644 students in Mayes County are middle school (2,277 | 26.3%), elementary school (1,892 | 21.9%), and high school (1,890 | 21.9%).
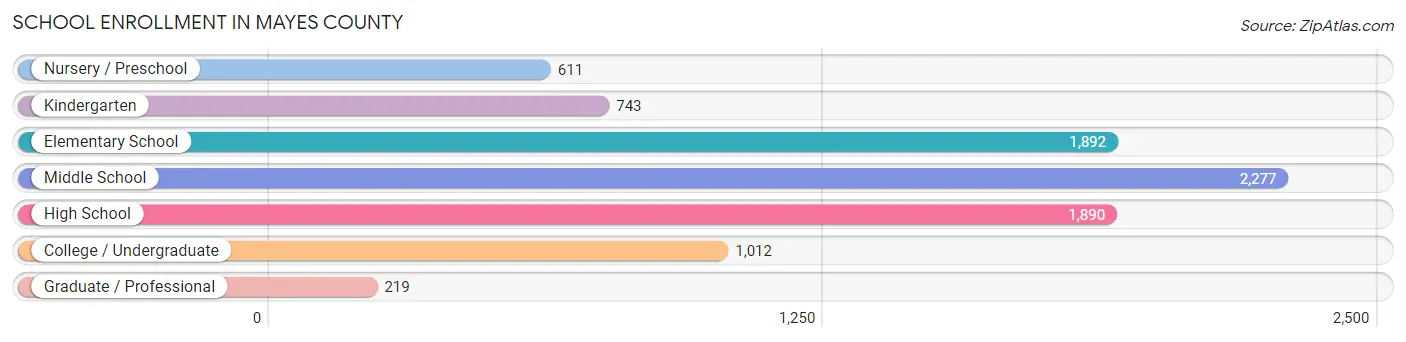
| School Level | # Students | % Students |
| Nursery / Preschool | 611 | 7.1% |
| Kindergarten | 743 | 8.6% |
| Elementary School | 1,892 | 21.9% |
| Middle School | 2,277 | 26.3% |
| High School | 1,890 | 21.9% |
| College / Undergraduate | 1,012 | 11.7% |
| Graduate / Professional | 219 | 2.5% |
| Total | 8,644 | 100.0% |
School Enrollment by Age by Funding Source in Mayes County
Out of a total of 8,644 students who are enrolled in schools in Mayes County, 968 (11.2%) attend a private institution, while the remaining 7,676 (88.8%) are enrolled in public schools. The age group of 3 to 4 year olds has the highest likelihood of being enrolled in private schools, with 101 (24.2% in the age bracket) enrolled. Conversely, the age group of 20 to 24 year olds has the lowest likelihood of being enrolled in a private school, with 477 (93.2% in the age bracket) attending a public institution.
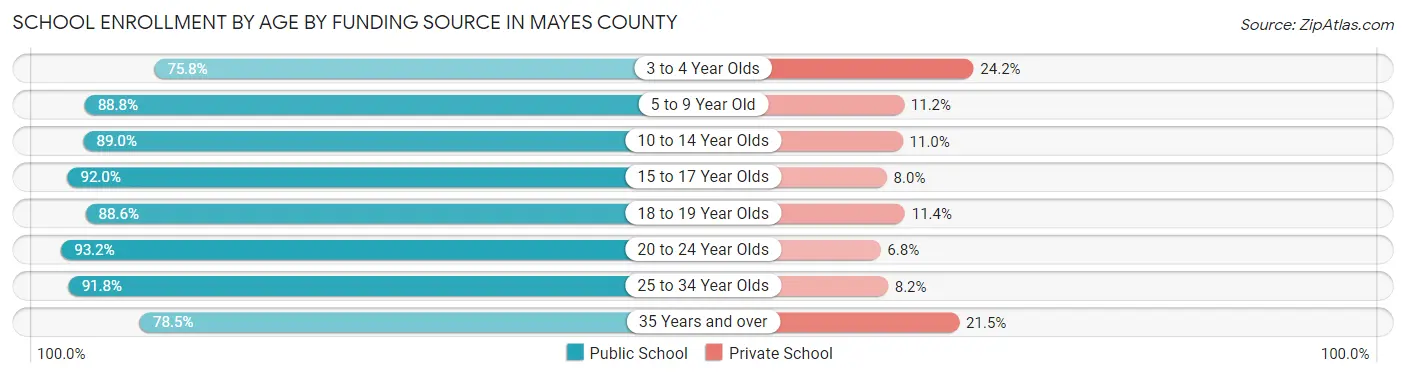
| Age Bracket | Public School | Private School |
| 3 to 4 Year Olds | 317 (75.8%) | 101 (24.2%) |
| 5 to 9 Year Old | 2,225 (88.8%) | 281 (11.2%) |
| 10 to 14 Year Olds | 2,368 (89.0%) | 292 (11.0%) |
| 15 to 17 Year Olds | 1,366 (92.0%) | 119 (8.0%) |
| 18 to 19 Year Olds | 436 (88.6%) | 56 (11.4%) |
| 20 to 24 Year Olds | 477 (93.2%) | 35 (6.8%) |
| 25 to 34 Year Olds | 268 (91.8%) | 24 (8.2%) |
| 35 Years and over | 219 (78.5%) | 60 (21.5%) |
| Total | 7,676 (88.8%) | 968 (11.2%) |
Educational Attainment by Field of Study in Mayes County
Education (986 | 22.0%), business (855 | 19.1%), arts & humanities (526 | 11.7%), science & technology (463 | 10.3%), and bio, nature & agricultural (367 | 8.2%) are the most common fields of study among 4,487 individuals in Mayes County who have obtained a bachelor's degree or higher.
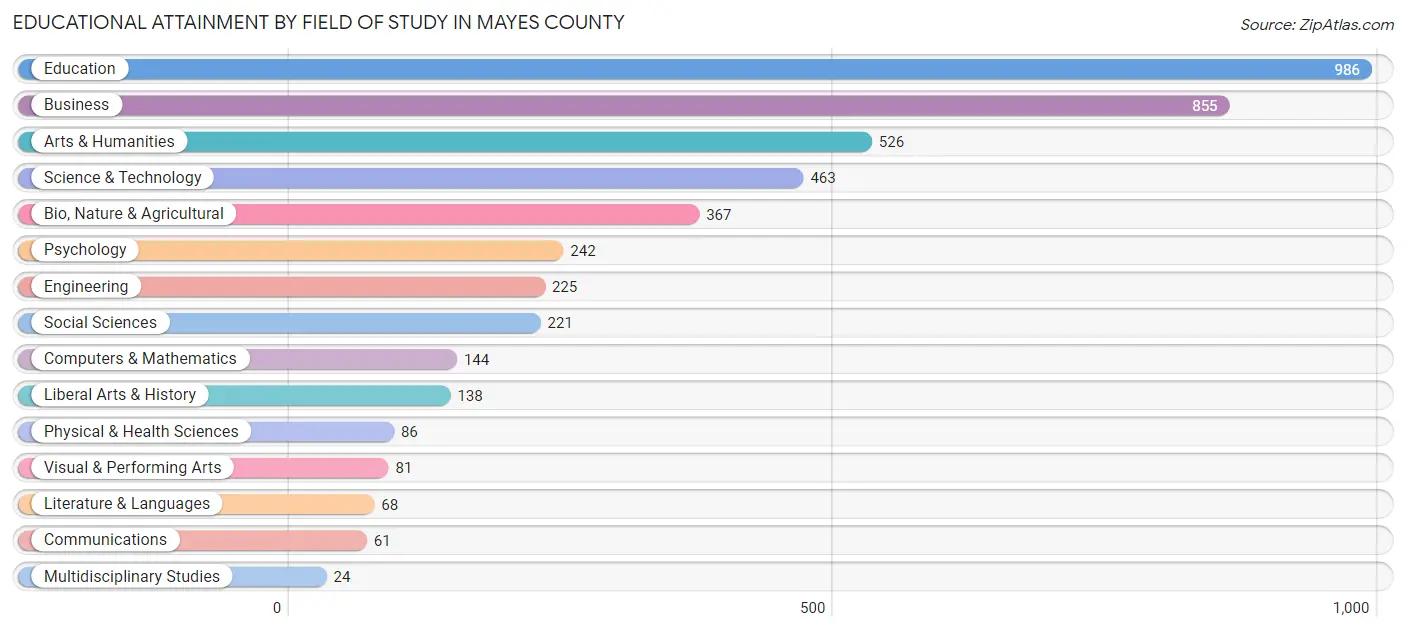
| Field of Study | # Graduates | % Graduates |
| Computers & Mathematics | 144 | 3.2% |
| Bio, Nature & Agricultural | 367 | 8.2% |
| Physical & Health Sciences | 86 | 1.9% |
| Psychology | 242 | 5.4% |
| Social Sciences | 221 | 4.9% |
| Engineering | 225 | 5.0% |
| Multidisciplinary Studies | 24 | 0.5% |
| Science & Technology | 463 | 10.3% |
| Business | 855 | 19.1% |
| Education | 986 | 22.0% |
| Literature & Languages | 68 | 1.5% |
| Liberal Arts & History | 138 | 3.1% |
| Visual & Performing Arts | 81 | 1.8% |
| Communications | 61 | 1.4% |
| Arts & Humanities | 526 | 11.7% |
| Total | 4,487 | 100.0% |
Transportation & Commute in Mayes County
Vehicle Availability by Sex in Mayes County
The most prevalent vehicle ownership categories in Mayes County are males with 2 vehicles (3,507, accounting for 39.5%) and females with 2 vehicles (2,539, making up 46.6%).
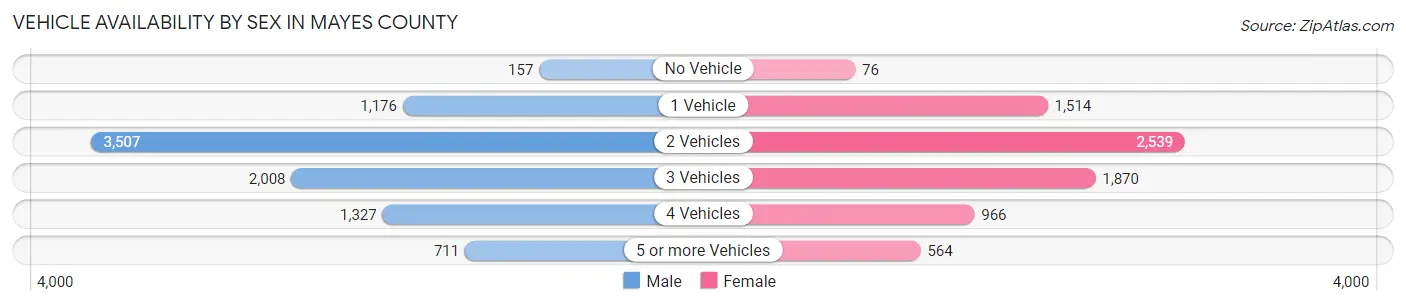
| Vehicles Available | Male | Female |
| No Vehicle | 157 (1.8%) | 76 (1.0%) |
| 1 Vehicle | 1,176 (13.2%) | 1,514 (20.1%) |
| 2 Vehicles | 3,507 (39.5%) | 2,539 (33.7%) |
| 3 Vehicles | 2,008 (22.6%) | 1,870 (24.8%) |
| 4 Vehicles | 1,327 (14.9%) | 966 (12.8%) |
| 5 or more Vehicles | 711 (8.0%) | 564 (7.5%) |
| Total | 8,886 (100.0%) | 7,529 (100.0%) |
Commute Time in Mayes County
The most frequently occuring commute durations in Mayes County are 10 to 14 minutes (2,454 commuters, 16.0%), 15 to 19 minutes (2,166 commuters, 14.1%), and 45 to 59 minutes (1,875 commuters, 12.2%).
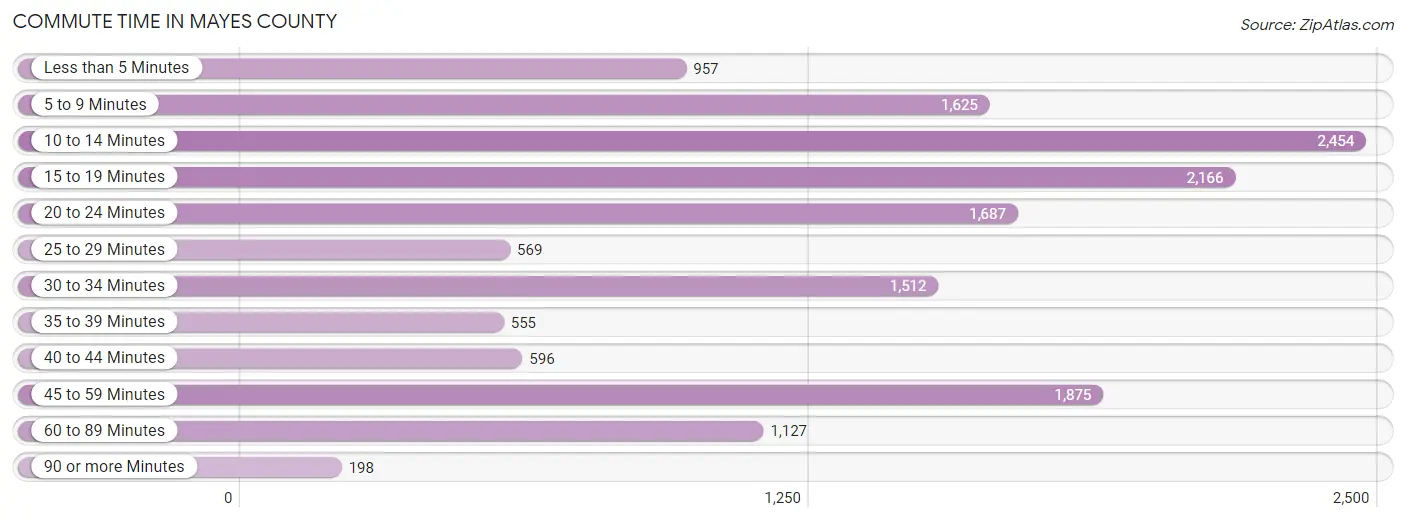
| Commute Time | # Commuters | % Commuters |
| Less than 5 Minutes | 957 | 6.2% |
| 5 to 9 Minutes | 1,625 | 10.6% |
| 10 to 14 Minutes | 2,454 | 16.0% |
| 15 to 19 Minutes | 2,166 | 14.1% |
| 20 to 24 Minutes | 1,687 | 11.0% |
| 25 to 29 Minutes | 569 | 3.7% |
| 30 to 34 Minutes | 1,512 | 9.9% |
| 35 to 39 Minutes | 555 | 3.6% |
| 40 to 44 Minutes | 596 | 3.9% |
| 45 to 59 Minutes | 1,875 | 12.2% |
| 60 to 89 Minutes | 1,127 | 7.4% |
| 90 or more Minutes | 198 | 1.3% |
Commute Time by Sex in Mayes County
The most common commute times in Mayes County are 15 to 19 minutes (1,208 commuters, 14.3%) for males and 10 to 14 minutes (1,357 commuters, 19.7%) for females.
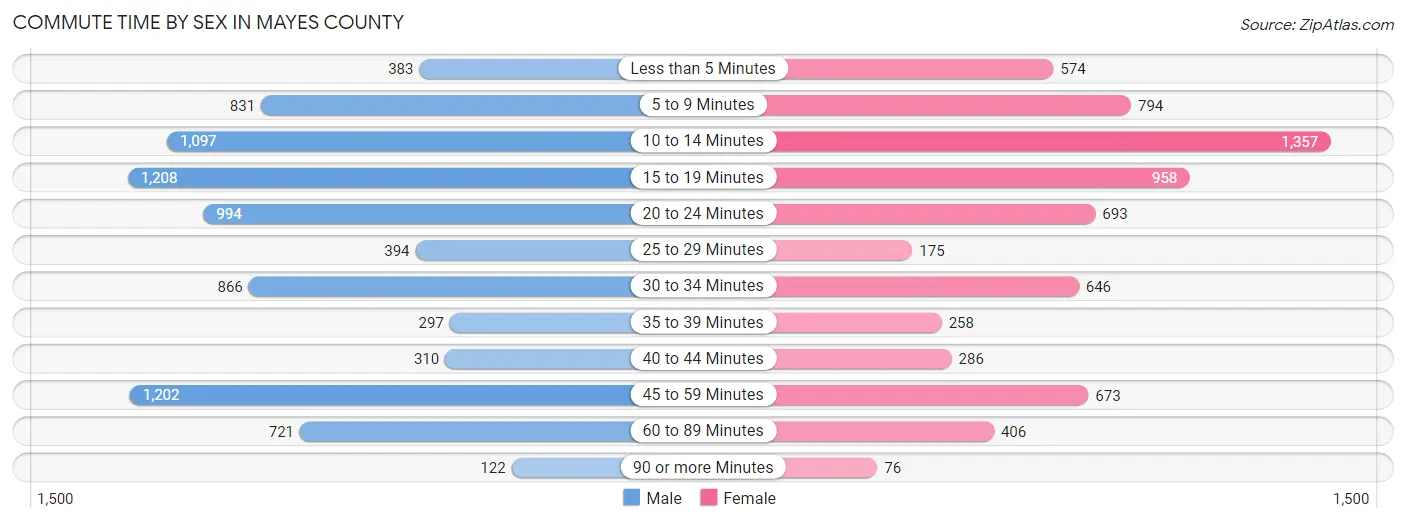
| Commute Time | Male | Female |
| Less than 5 Minutes | 383 (4.5%) | 574 (8.3%) |
| 5 to 9 Minutes | 831 (9.9%) | 794 (11.5%) |
| 10 to 14 Minutes | 1,097 (13.0%) | 1,357 (19.7%) |
| 15 to 19 Minutes | 1,208 (14.3%) | 958 (13.9%) |
| 20 to 24 Minutes | 994 (11.8%) | 693 (10.1%) |
| 25 to 29 Minutes | 394 (4.7%) | 175 (2.5%) |
| 30 to 34 Minutes | 866 (10.3%) | 646 (9.4%) |
| 35 to 39 Minutes | 297 (3.5%) | 258 (3.7%) |
| 40 to 44 Minutes | 310 (3.7%) | 286 (4.2%) |
| 45 to 59 Minutes | 1,202 (14.3%) | 673 (9.8%) |
| 60 to 89 Minutes | 721 (8.6%) | 406 (5.9%) |
| 90 or more Minutes | 122 (1.5%) | 76 (1.1%) |
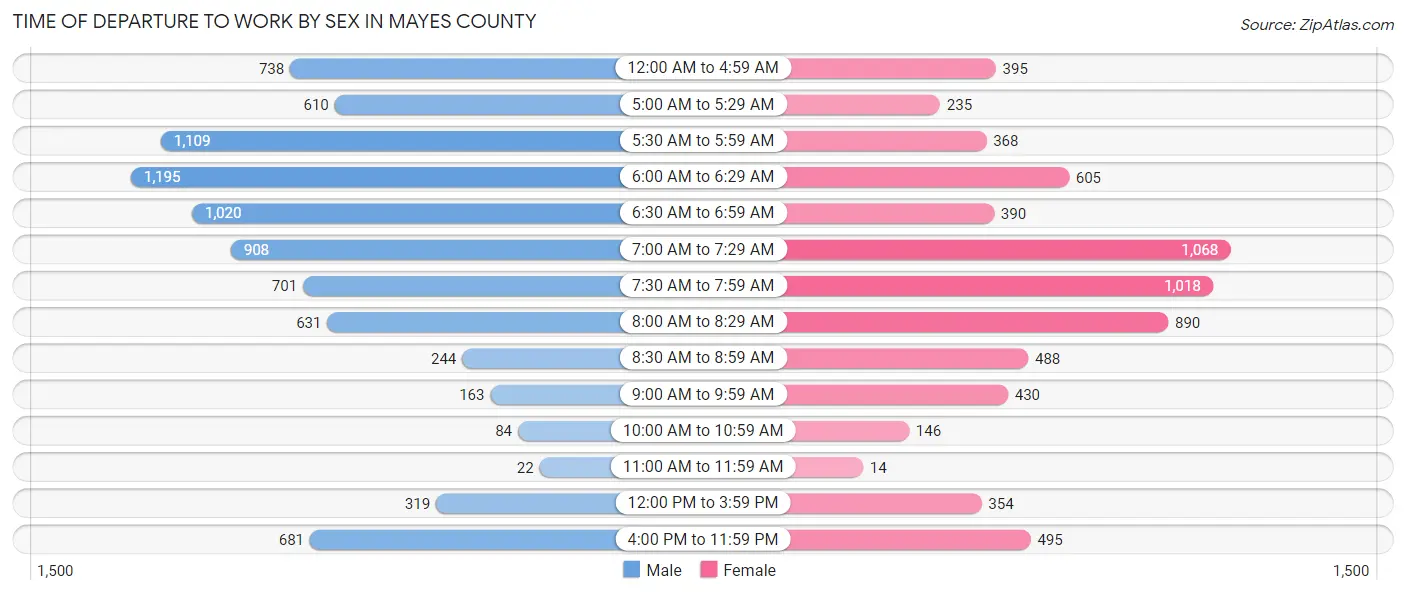
Time of Departure to Work by Sex in Mayes County
The most frequent times of departure to work in Mayes County are 6:00 AM to 6:29 AM (1,195, 14.2%) for males and 7:00 AM to 7:29 AM (1,068, 15.5%) for females.
| Time of Departure | Male | Female |
| 12:00 AM to 4:59 AM | 738 (8.8%) | 395 (5.7%) |
| 5:00 AM to 5:29 AM | 610 (7.2%) | 235 (3.4%) |
| 5:30 AM to 5:59 AM | 1,109 (13.2%) | 368 (5.3%) |
| 6:00 AM to 6:29 AM | 1,195 (14.2%) | 605 (8.8%) |
| 6:30 AM to 6:59 AM | 1,020 (12.1%) | 390 (5.7%) |
| 7:00 AM to 7:29 AM | 908 (10.8%) | 1,068 (15.5%) |
| 7:30 AM to 7:59 AM | 701 (8.3%) | 1,018 (14.8%) |
| 8:00 AM to 8:29 AM | 631 (7.5%) | 890 (12.9%) |
| 8:30 AM to 8:59 AM | 244 (2.9%) | 488 (7.1%) |
| 9:00 AM to 9:59 AM | 163 (1.9%) | 430 (6.2%) |
| 10:00 AM to 10:59 AM | 84 (1.0%) | 146 (2.1%) |
| 11:00 AM to 11:59 AM | 22 (0.3%) | 14 (0.2%) |
| 12:00 PM to 3:59 PM | 319 (3.8%) | 354 (5.1%) |
| 4:00 PM to 11:59 PM | 681 (8.1%) | 495 (7.2%) |
| Total | 8,425 (100.0%) | 6,896 (100.0%) |
Housing Occupancy in Mayes County
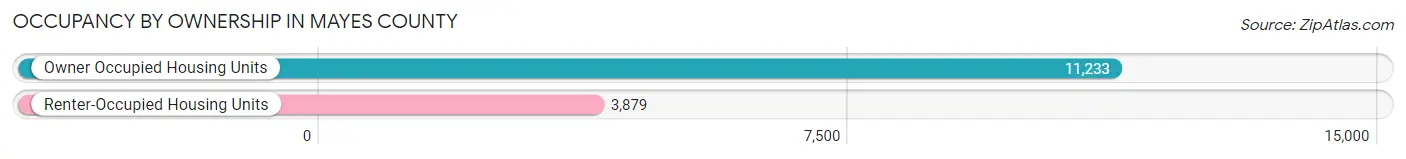
Occupancy by Ownership in Mayes County
Of the total 15,112 dwellings in Mayes County, owner-occupied units account for 11,233 (74.3%), while renter-occupied units make up 3,879 (25.7%).
| Occupancy | # Housing Units | % Housing Units |
| Owner Occupied Housing Units | 11,233 | 74.3% |
| Renter-Occupied Housing Units | 3,879 | 25.7% |
| Total Occupied Housing Units | 15,112 | 100.0% |
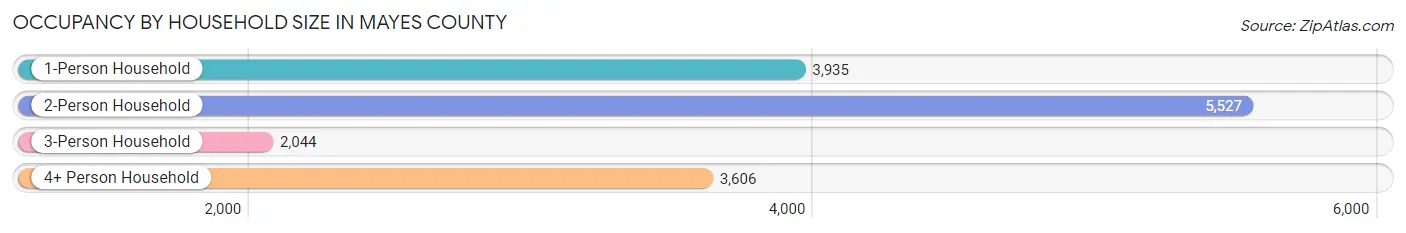
Occupancy by Household Size in Mayes County
| Household Size | # Housing Units | % Housing Units |
| 1-Person Household | 3,935 | 26.0% |
| 2-Person Household | 5,527 | 36.6% |
| 3-Person Household | 2,044 | 13.5% |
| 4+ Person Household | 3,606 | 23.9% |
| Total Housing Units | 15,112 | 100.0% |
Occupancy by Ownership by Household Size in Mayes County
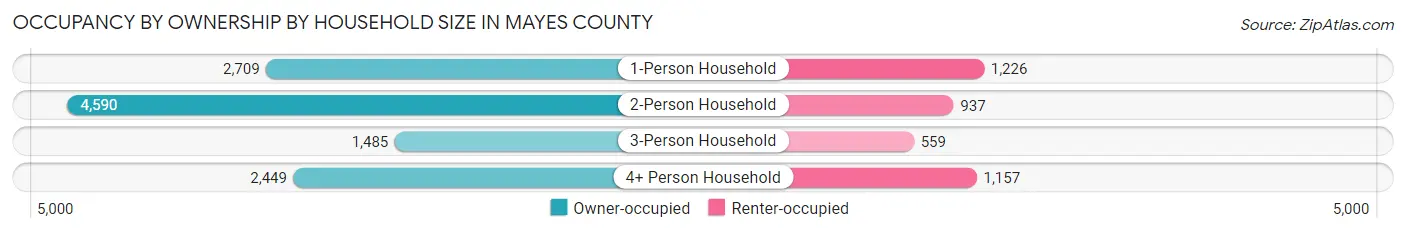
| Household Size | Owner-occupied | Renter-occupied |
| 1-Person Household | 2,709 (68.8%) | 1,226 (31.2%) |
| 2-Person Household | 4,590 (83.1%) | 937 (17.0%) |
| 3-Person Household | 1,485 (72.7%) | 559 (27.4%) |
| 4+ Person Household | 2,449 (67.9%) | 1,157 (32.1%) |
| Total Housing Units | 11,233 (74.3%) | 3,879 (25.7%) |
Occupancy by Educational Attainment in Mayes County
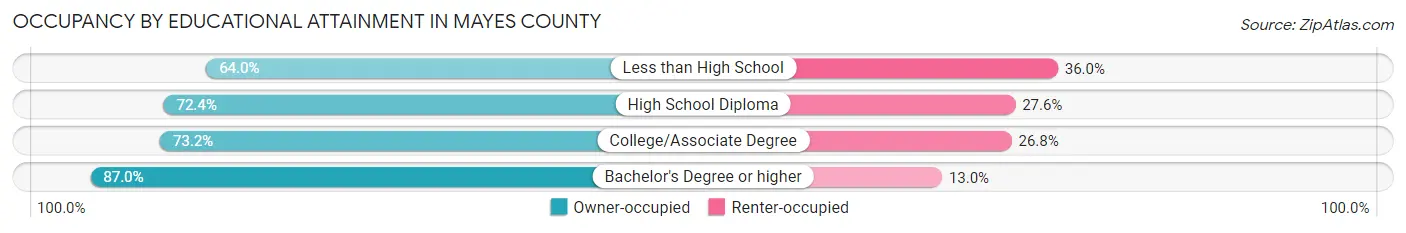
| Household Size | Owner-occupied | Renter-occupied |
| Less than High School | 789 (64.0%) | 444 (36.0%) |
| High School Diploma | 4,376 (72.4%) | 1,665 (27.6%) |
| College/Associate Degree | 3,967 (73.2%) | 1,455 (26.8%) |
| Bachelor's Degree or higher | 2,101 (87.0%) | 315 (13.0%) |
Occupancy by Age of Householder in Mayes County
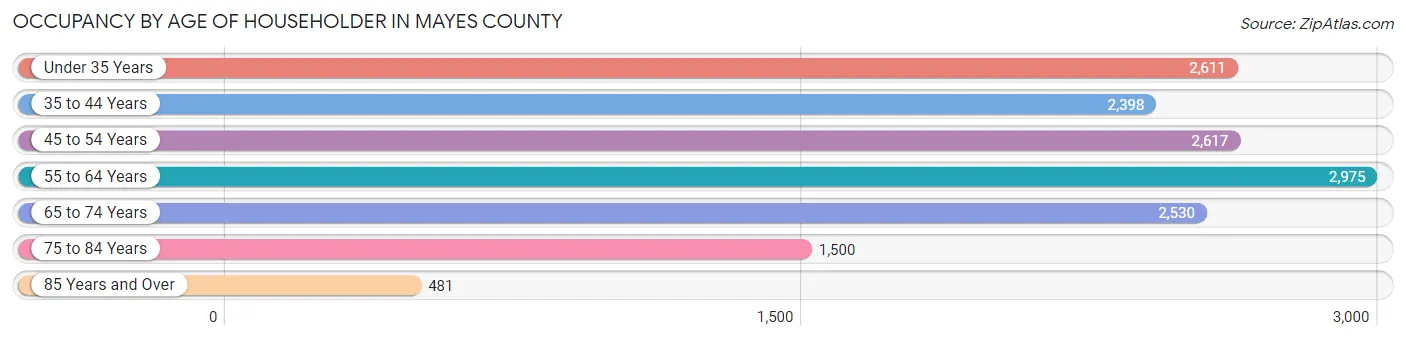
| Age Bracket | # Households | % Households |
| Under 35 Years | 2,611 | 17.3% |
| 35 to 44 Years | 2,398 | 15.9% |
| 45 to 54 Years | 2,617 | 17.3% |
| 55 to 64 Years | 2,975 | 19.7% |
| 65 to 74 Years | 2,530 | 16.7% |
| 75 to 84 Years | 1,500 | 9.9% |
| 85 Years and Over | 481 | 3.2% |
| Total | 15,112 | 100.0% |
Housing Finances in Mayes County
Median Income by Occupancy in Mayes County
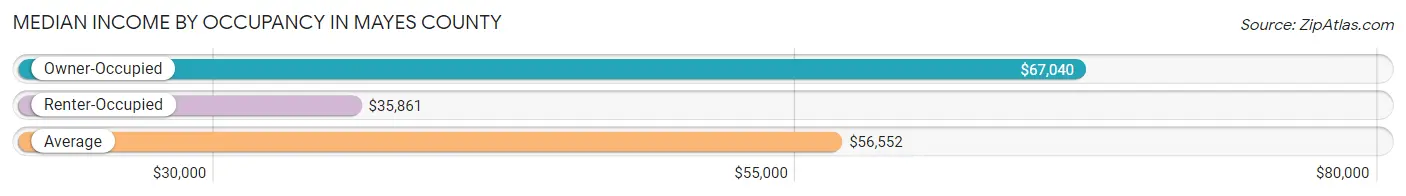
| Occupancy Type | # Households | Median Income |
| Owner-Occupied | 11,233 (74.3%) | $67,040 |
| Renter-Occupied | 3,879 (25.7%) | $35,861 |
| Average | 15,112 (100.0%) | $56,552 |
Occupancy by Householder Income Bracket in Mayes County
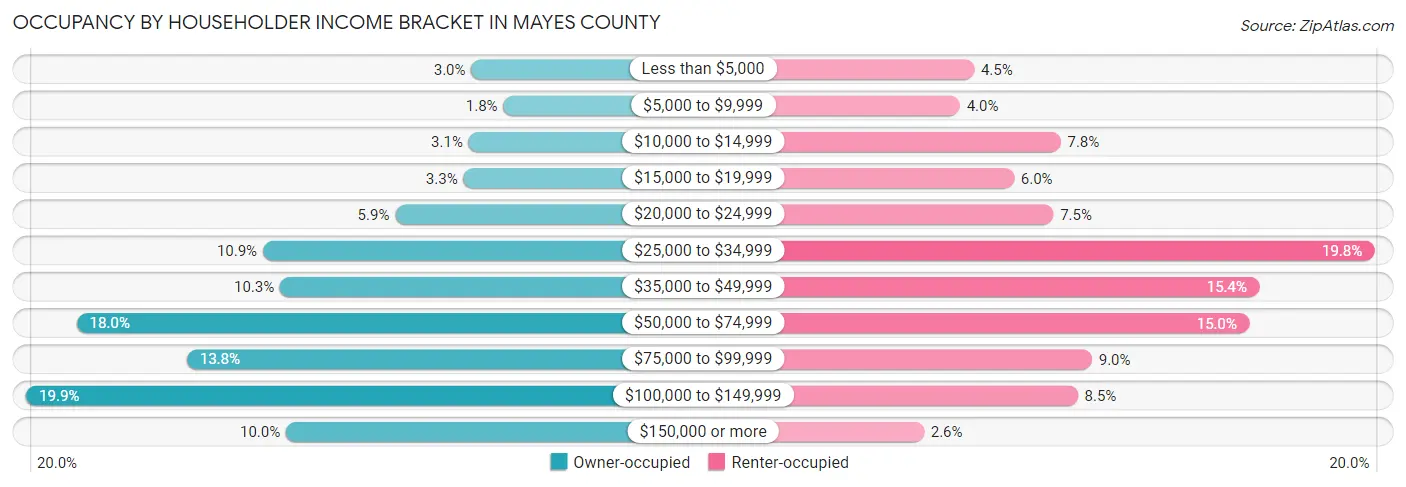
| Income Bracket | Owner-occupied | Renter-occupied |
| Less than $5,000 | 335 (3.0%) | 175 (4.5%) |
| $5,000 to $9,999 | 198 (1.8%) | 154 (4.0%) |
| $10,000 to $14,999 | 346 (3.1%) | 303 (7.8%) |
| $15,000 to $19,999 | 368 (3.3%) | 234 (6.0%) |
| $20,000 to $24,999 | 661 (5.9%) | 292 (7.5%) |
| $25,000 to $34,999 | 1,227 (10.9%) | 766 (19.8%) |
| $35,000 to $49,999 | 1,154 (10.3%) | 596 (15.4%) |
| $50,000 to $74,999 | 2,024 (18.0%) | 581 (15.0%) |
| $75,000 to $99,999 | 1,552 (13.8%) | 349 (9.0%) |
| $100,000 to $149,999 | 2,240 (19.9%) | 328 (8.5%) |
| $150,000 or more | 1,128 (10.0%) | 101 (2.6%) |
| Total | 11,233 (100.0%) | 3,879 (100.0%) |
Monthly Housing Cost Tiers in Mayes County
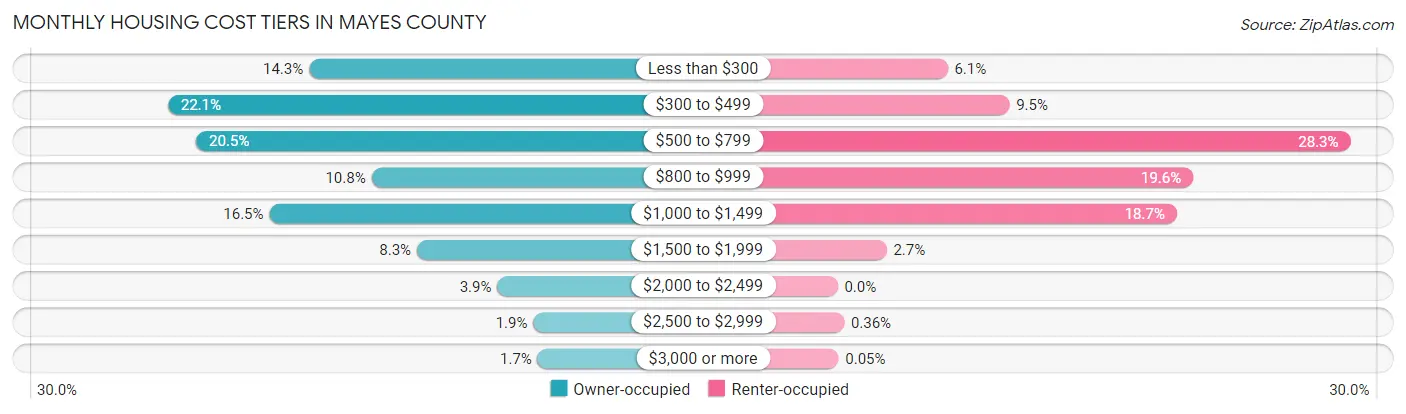
| Monthly Cost | Owner-occupied | Renter-occupied |
| Less than $300 | 1,605 (14.3%) | 236 (6.1%) |
| $300 to $499 | 2,481 (22.1%) | 368 (9.5%) |
| $500 to $799 | 2,306 (20.5%) | 1,099 (28.3%) |
| $800 to $999 | 1,218 (10.8%) | 762 (19.6%) |
| $1,000 to $1,499 | 1,851 (16.5%) | 727 (18.7%) |
| $1,500 to $1,999 | 936 (8.3%) | 105 (2.7%) |
| $2,000 to $2,499 | 437 (3.9%) | 0 (0.0%) |
| $2,500 to $2,999 | 213 (1.9%) | 14 (0.4%) |
| $3,000 or more | 186 (1.7%) | 2 (0.1%) |
| Total | 11,233 (100.0%) | 3,879 (100.0%) |
Physical Housing Characteristics in Mayes County
Housing Structures in Mayes County
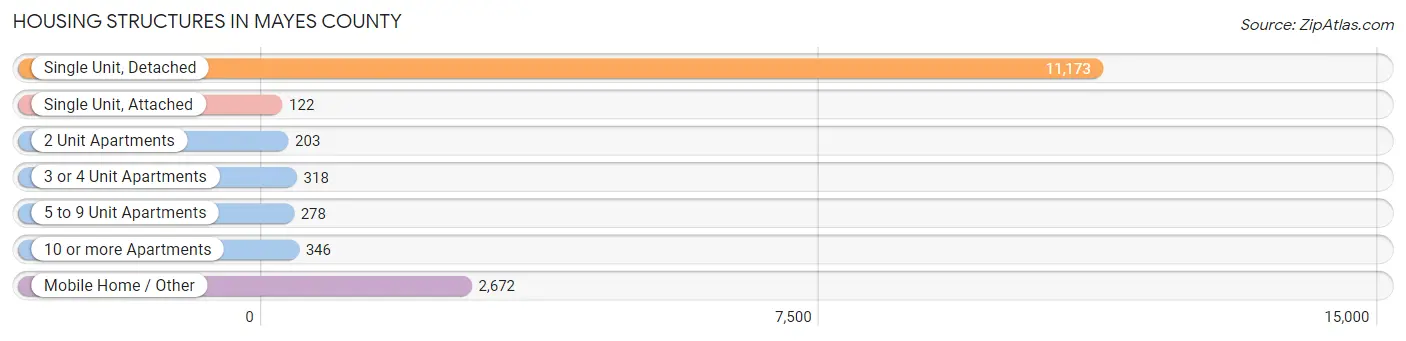
| Structure Type | # Housing Units | % Housing Units |
| Single Unit, Detached | 11,173 | 73.9% |
| Single Unit, Attached | 122 | 0.8% |
| 2 Unit Apartments | 203 | 1.3% |
| 3 or 4 Unit Apartments | 318 | 2.1% |
| 5 to 9 Unit Apartments | 278 | 1.8% |
| 10 or more Apartments | 346 | 2.3% |
| Mobile Home / Other | 2,672 | 17.7% |
| Total | 15,112 | 100.0% |
Housing Structures by Occupancy in Mayes County
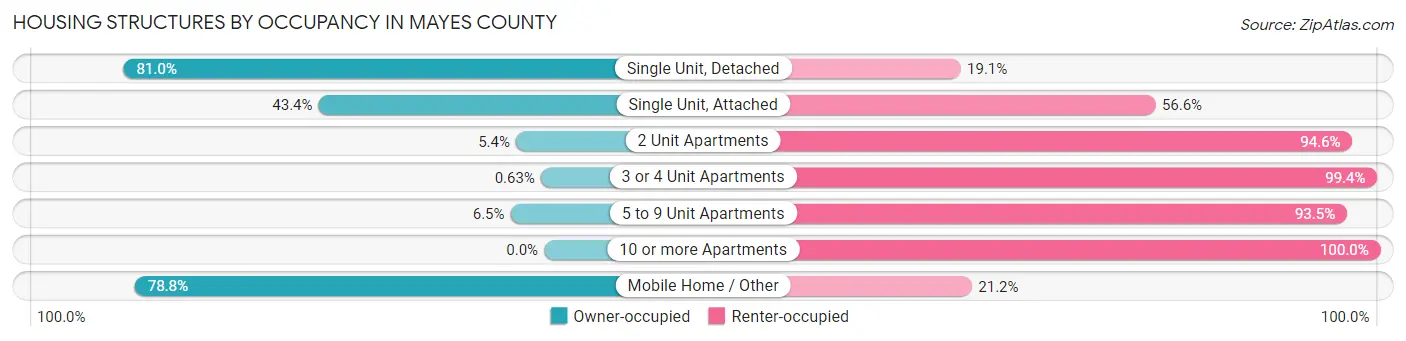
| Structure Type | Owner-occupied | Renter-occupied |
| Single Unit, Detached | 9,044 (80.9%) | 2,129 (19.1%) |
| Single Unit, Attached | 53 (43.4%) | 69 (56.6%) |
| 2 Unit Apartments | 11 (5.4%) | 192 (94.6%) |
| 3 or 4 Unit Apartments | 2 (0.6%) | 316 (99.4%) |
| 5 to 9 Unit Apartments | 18 (6.5%) | 260 (93.5%) |
| 10 or more Apartments | 0 (0.0%) | 346 (100.0%) |
| Mobile Home / Other | 2,105 (78.8%) | 567 (21.2%) |
| Total | 11,233 (74.3%) | 3,879 (25.7%) |
Housing Structures by Number of Rooms in Mayes County
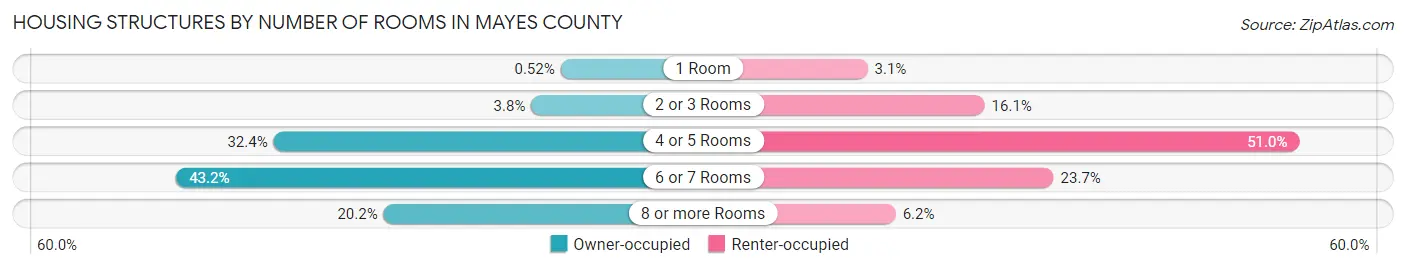
| Number of Rooms | Owner-occupied | Renter-occupied |
| 1 Room | 58 (0.5%) | 119 (3.1%) |
| 2 or 3 Rooms | 423 (3.8%) | 623 (16.1%) |
| 4 or 5 Rooms | 3,637 (32.4%) | 1,977 (51.0%) |
| 6 or 7 Rooms | 4,849 (43.2%) | 920 (23.7%) |
| 8 or more Rooms | 2,266 (20.2%) | 240 (6.2%) |
| Total | 11,233 (100.0%) | 3,879 (100.0%) |
Housing Structure by Heating Type in Mayes County
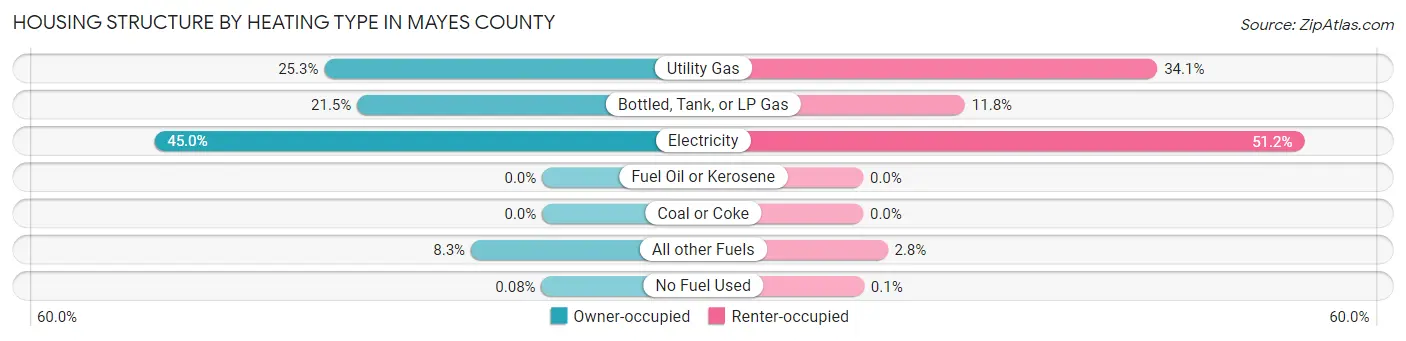
| Heating Type | Owner-occupied | Renter-occupied |
| Utility Gas | 2,837 (25.3%) | 1,323 (34.1%) |
| Bottled, Tank, or LP Gas | 2,410 (21.4%) | 458 (11.8%) |
| Electricity | 5,050 (45.0%) | 1,984 (51.1%) |
| Fuel Oil or Kerosene | 0 (0.0%) | 0 (0.0%) |
| Coal or Coke | 0 (0.0%) | 0 (0.0%) |
| All other Fuels | 927 (8.3%) | 110 (2.8%) |
| No Fuel Used | 9 (0.1%) | 4 (0.1%) |
| Total | 11,233 (100.0%) | 3,879 (100.0%) |
Household Vehicle Usage in Mayes County
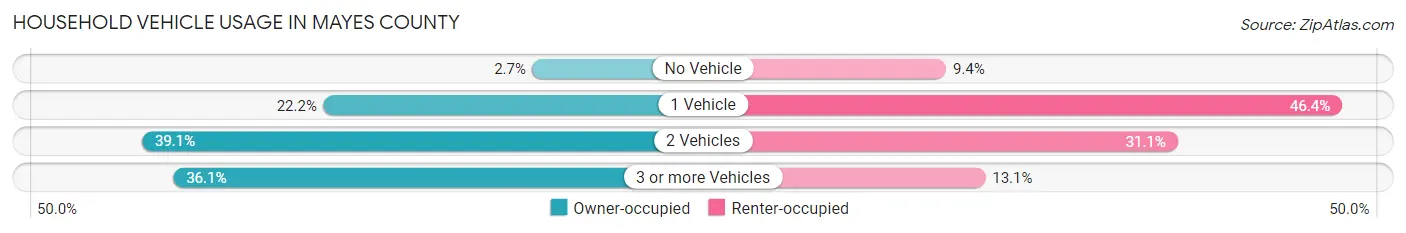
| Vehicles per Household | Owner-occupied | Renter-occupied |
| No Vehicle | 298 (2.6%) | 366 (9.4%) |
| 1 Vehicle | 2,490 (22.2%) | 1,800 (46.4%) |
| 2 Vehicles | 4,388 (39.1%) | 1,205 (31.1%) |
| 3 or more Vehicles | 4,057 (36.1%) | 508 (13.1%) |
| Total | 11,233 (100.0%) | 3,879 (100.0%) |
Real Estate & Mortgages in Mayes County
Real Estate and Mortgage Overview in Mayes County
| Characteristic | Without Mortgage | With Mortgage |
| Housing Units | 6,015 | 5,218 |
| Median Property Value | $126,800 | $177,500 |
| Median Household Income | $51,705 | $682 |
| Monthly Housing Costs | $399 | $186 |
| Real Estate Taxes | $814 | $273 |
Property Value by Mortgage Status in Mayes County
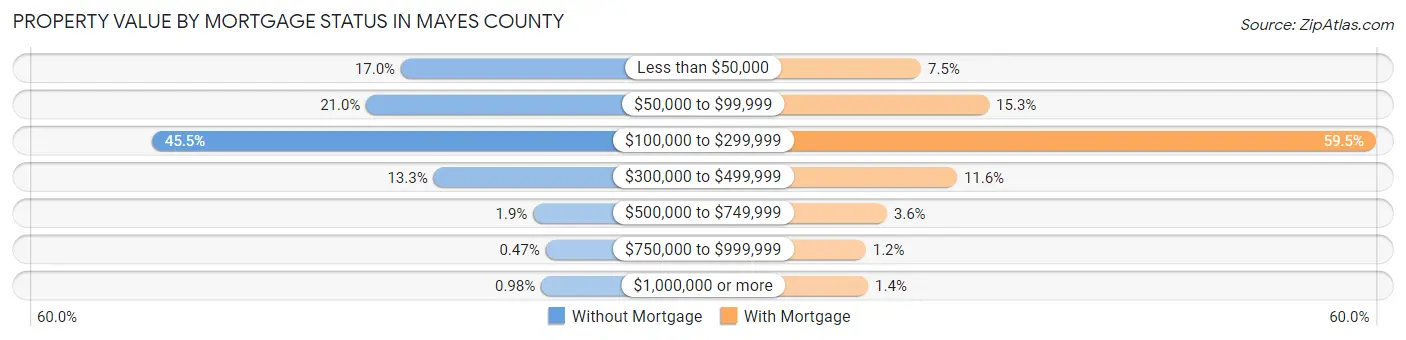
| Property Value | Without Mortgage | With Mortgage |
| Less than $50,000 | 1,022 (17.0%) | 391 (7.5%) |
| $50,000 to $99,999 | 1,261 (21.0%) | 797 (15.3%) |
| $100,000 to $299,999 | 2,734 (45.5%) | 3,102 (59.5%) |
| $300,000 to $499,999 | 798 (13.3%) | 605 (11.6%) |
| $500,000 to $749,999 | 113 (1.9%) | 187 (3.6%) |
| $750,000 to $999,999 | 28 (0.5%) | 61 (1.2%) |
| $1,000,000 or more | 59 (1.0%) | 75 (1.4%) |
| Total | 6,015 (100.0%) | 5,218 (100.0%) |
Household Income by Mortgage Status in Mayes County
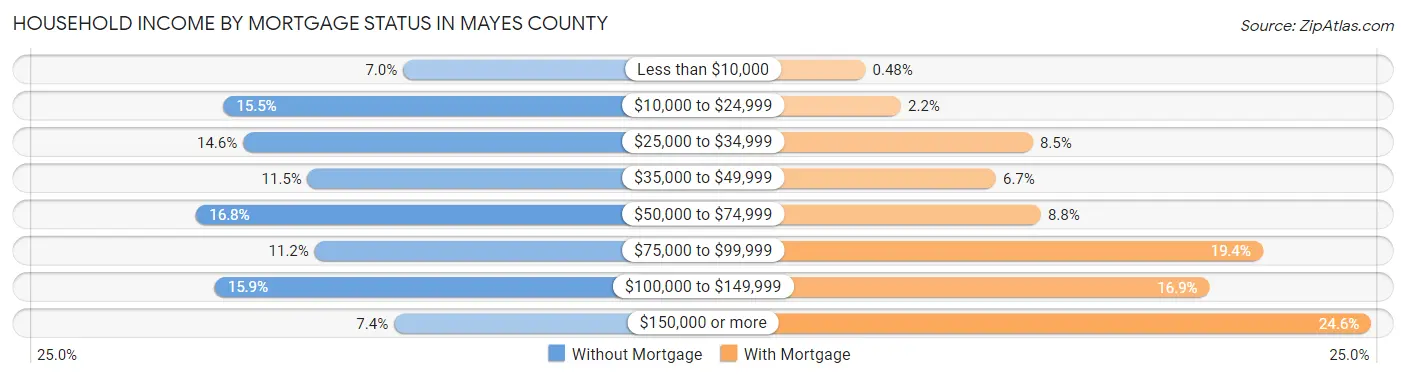
| Household Income | Without Mortgage | With Mortgage |
| Less than $10,000 | 420 (7.0%) | 25 (0.5%) |
| $10,000 to $24,999 | 934 (15.5%) | 113 (2.2%) |
| $25,000 to $34,999 | 878 (14.6%) | 441 (8.5%) |
| $35,000 to $49,999 | 693 (11.5%) | 349 (6.7%) |
| $50,000 to $74,999 | 1,012 (16.8%) | 461 (8.8%) |
| $75,000 to $99,999 | 673 (11.2%) | 1,012 (19.4%) |
| $100,000 to $149,999 | 959 (15.9%) | 879 (16.9%) |
| $150,000 or more | 446 (7.4%) | 1,281 (24.5%) |
| Total | 6,015 (100.0%) | 5,218 (100.0%) |
Property Value to Household Income Ratio in Mayes County
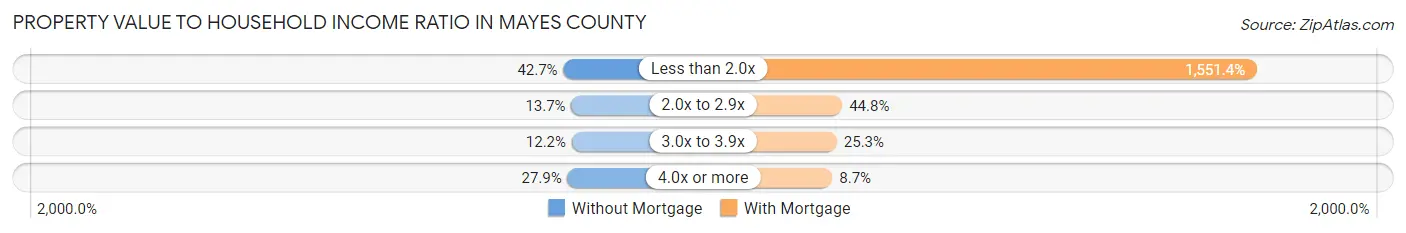
| Value-to-Income Ratio | Without Mortgage | With Mortgage |
| Less than 2.0x | 2,571 (42.7%) | 80,951 (1,551.4%) |
| 2.0x to 2.9x | 825 (13.7%) | 2,337 (44.8%) |
| 3.0x to 3.9x | 732 (12.2%) | 1,318 (25.3%) |
| 4.0x or more | 1,680 (27.9%) | 454 (8.7%) |
| Total | 6,015 (100.0%) | 5,218 (100.0%) |
Real Estate Taxes by Mortgage Status in Mayes County
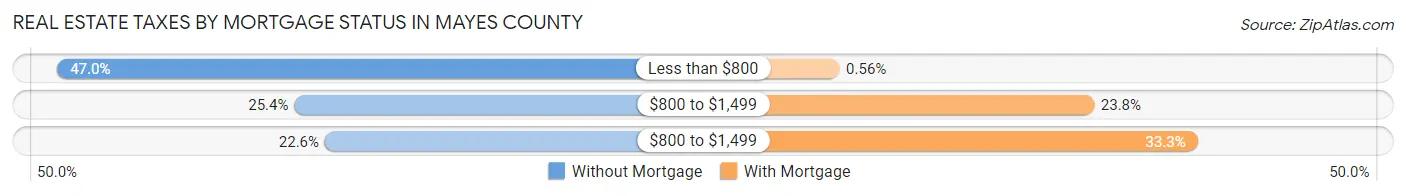
| Property Taxes | Without Mortgage | With Mortgage |
| Less than $800 | 2,828 (47.0%) | 29 (0.6%) |
| $800 to $1,499 | 1,526 (25.4%) | 1,243 (23.8%) |
| $800 to $1,499 | 1,358 (22.6%) | 1,737 (33.3%) |
| Total | 6,015 (100.0%) | 5,218 (100.0%) |
Health & Disability in Mayes County
Health Insurance Coverage by Age in Mayes County
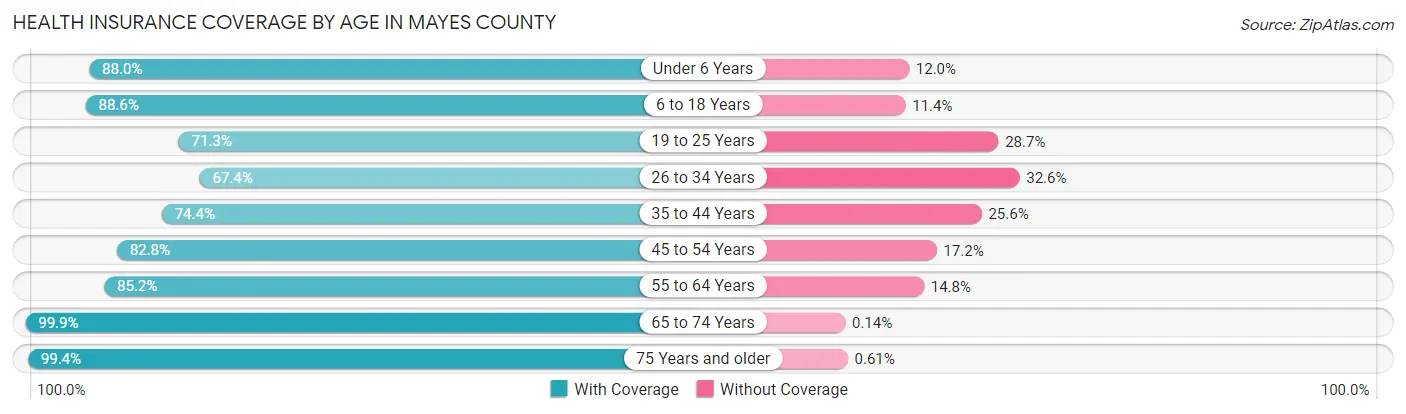
| Age Bracket | With Coverage | Without Coverage |
| Under 6 Years | 2,505 (88.0%) | 343 (12.0%) |
| 6 to 18 Years | 5,958 (88.6%) | 764 (11.4%) |
| 19 to 25 Years | 2,319 (71.3%) | 934 (28.7%) |
| 26 to 34 Years | 2,845 (67.4%) | 1,378 (32.6%) |
| 35 to 44 Years | 3,441 (74.4%) | 1,183 (25.6%) |
| 45 to 54 Years | 4,007 (82.8%) | 832 (17.2%) |
| 55 to 64 Years | 4,557 (85.2%) | 793 (14.8%) |
| 65 to 74 Years | 4,311 (99.9%) | 6 (0.1%) |
| 75 Years and older | 2,768 (99.4%) | 17 (0.6%) |
| Total | 32,711 (84.0%) | 6,250 (16.0%) |
Health Insurance Coverage by Citizenship Status in Mayes County
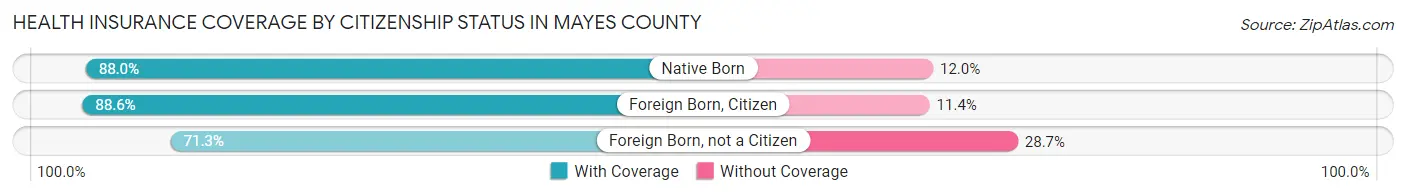
| Citizenship Status | With Coverage | Without Coverage |
| Native Born | 2,505 (88.0%) | 343 (12.0%) |
| Foreign Born, Citizen | 5,958 (88.6%) | 764 (11.4%) |
| Foreign Born, not a Citizen | 2,319 (71.3%) | 934 (28.7%) |
Health Insurance Coverage by Household Income in Mayes County
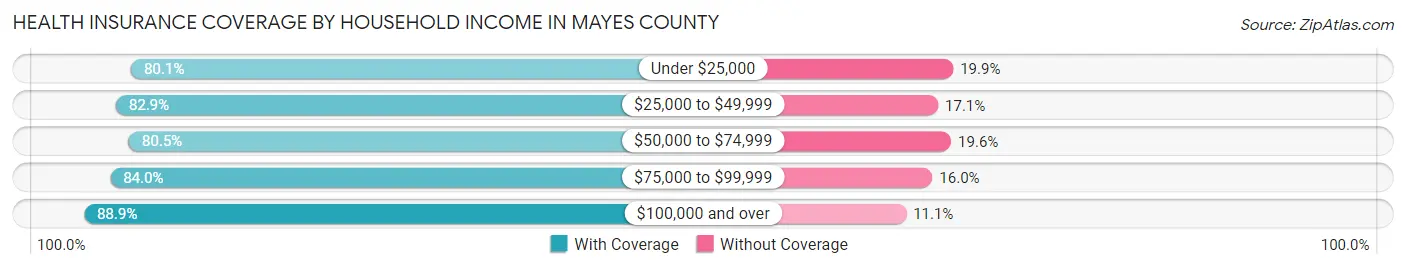
| Household Income | With Coverage | Without Coverage |
| Under $25,000 | 4,685 (80.1%) | 1,167 (19.9%) |
| $25,000 to $49,999 | 7,091 (82.9%) | 1,464 (17.1%) |
| $50,000 to $74,999 | 5,869 (80.4%) | 1,426 (19.6%) |
| $75,000 to $99,999 | 4,464 (84.0%) | 853 (16.0%) |
| $100,000 and over | 10,496 (88.9%) | 1,315 (11.1%) |
Public vs Private Health Insurance Coverage by Age in Mayes County
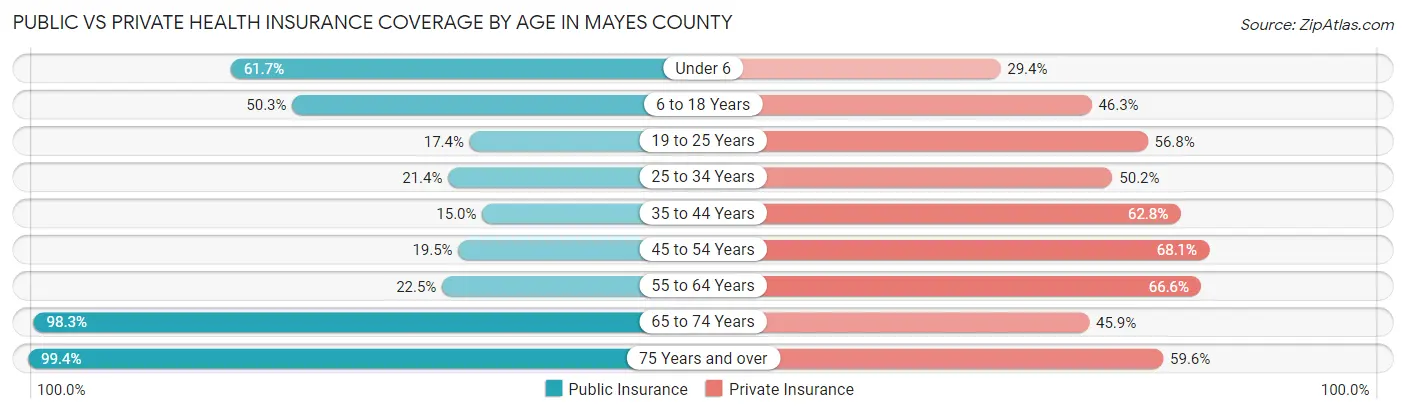
| Age Bracket | Public Insurance | Private Insurance |
| Under 6 | 1,758 (61.7%) | 838 (29.4%) |
| 6 to 18 Years | 3,381 (50.3%) | 3,115 (46.3%) |
| 19 to 25 Years | 565 (17.4%) | 1,846 (56.8%) |
| 25 to 34 Years | 902 (21.4%) | 2,121 (50.2%) |
| 35 to 44 Years | 695 (15.0%) | 2,903 (62.8%) |
| 45 to 54 Years | 942 (19.5%) | 3,297 (68.1%) |
| 55 to 64 Years | 1,203 (22.5%) | 3,565 (66.6%) |
| 65 to 74 Years | 4,244 (98.3%) | 1,981 (45.9%) |
| 75 Years and over | 2,767 (99.4%) | 1,661 (59.6%) |
| Total | 16,457 (42.2%) | 21,327 (54.7%) |
Disability Status by Sex by Age in Mayes County
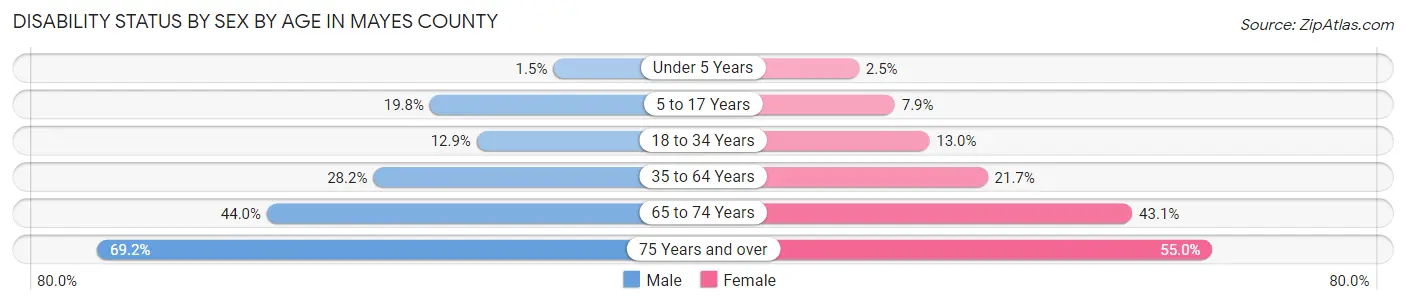
| Age Bracket | Male | Female |
| Under 5 Years | 17 (1.5%) | 28 (2.5%) |
| 5 to 17 Years | 705 (19.8%) | 258 (7.9%) |
| 18 to 34 Years | 523 (12.9%) | 508 (13.0%) |
| 35 to 64 Years | 2,119 (28.2%) | 1,582 (21.6%) |
| 65 to 74 Years | 896 (44.0%) | 984 (43.1%) |
| 75 Years and over | 841 (69.2%) | 864 (55.0%) |
Disability Class by Sex by Age in Mayes County
Disability Class: Hearing Difficulty
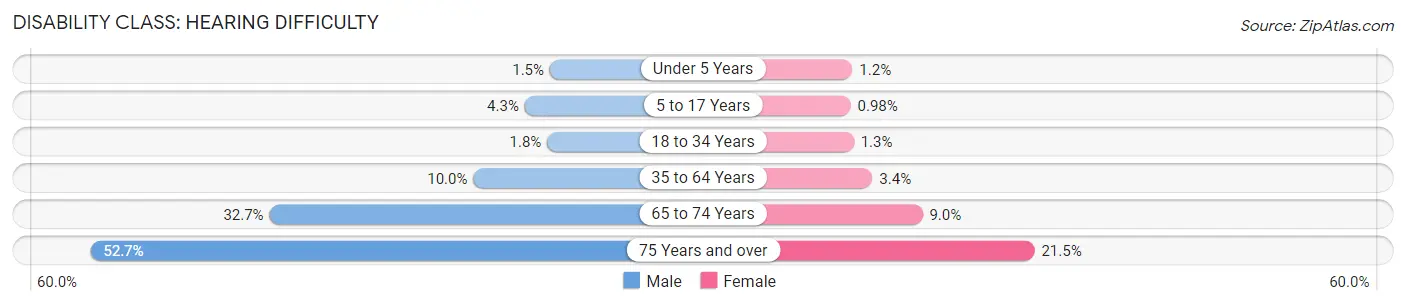
| Age Bracket | Male | Female |
| Under 5 Years | 17 (1.5%) | 13 (1.2%) |
| 5 to 17 Years | 153 (4.3%) | 32 (1.0%) |
| 18 to 34 Years | 73 (1.8%) | 52 (1.3%) |
| 35 to 64 Years | 753 (10.0%) | 249 (3.4%) |
| 65 to 74 Years | 666 (32.7%) | 205 (9.0%) |
| 75 Years and over | 640 (52.7%) | 337 (21.5%) |
Disability Class: Vision Difficulty
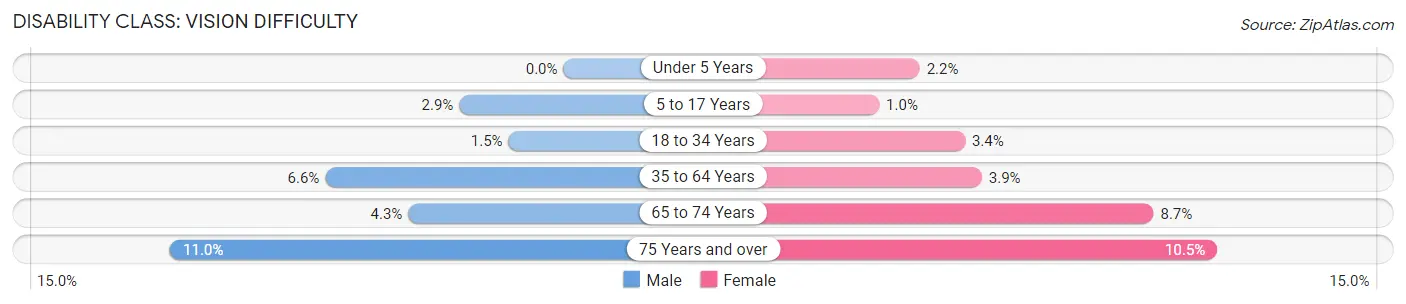
| Age Bracket | Male | Female |
| Under 5 Years | 0 (0.0%) | 24 (2.2%) |
| 5 to 17 Years | 103 (2.9%) | 34 (1.0%) |
| 18 to 34 Years | 62 (1.5%) | 134 (3.4%) |
| 35 to 64 Years | 498 (6.6%) | 285 (3.9%) |
| 65 to 74 Years | 88 (4.3%) | 198 (8.7%) |
| 75 Years and over | 133 (11.0%) | 164 (10.4%) |
Disability Class: Cognitive Difficulty
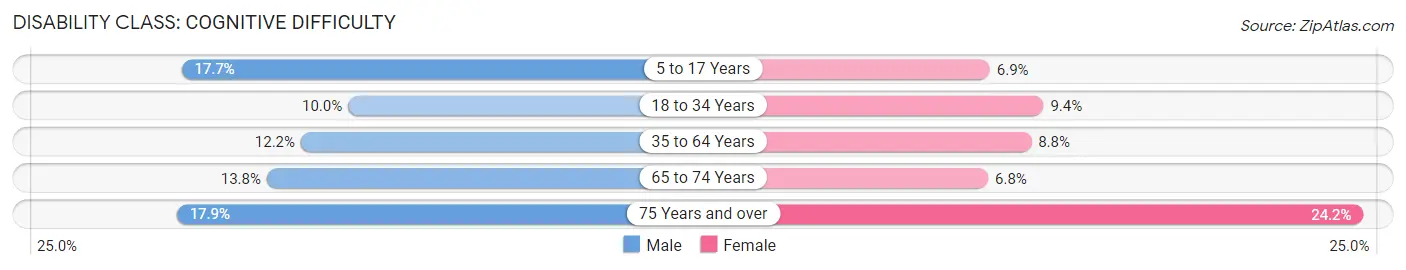
| Age Bracket | Male | Female |
| 5 to 17 Years | 630 (17.7%) | 225 (6.9%) |
| 18 to 34 Years | 406 (10.0%) | 366 (9.4%) |
| 35 to 64 Years | 914 (12.2%) | 642 (8.8%) |
| 65 to 74 Years | 280 (13.8%) | 155 (6.8%) |
| 75 Years and over | 218 (17.9%) | 380 (24.2%) |
Disability Class: Ambulatory Difficulty
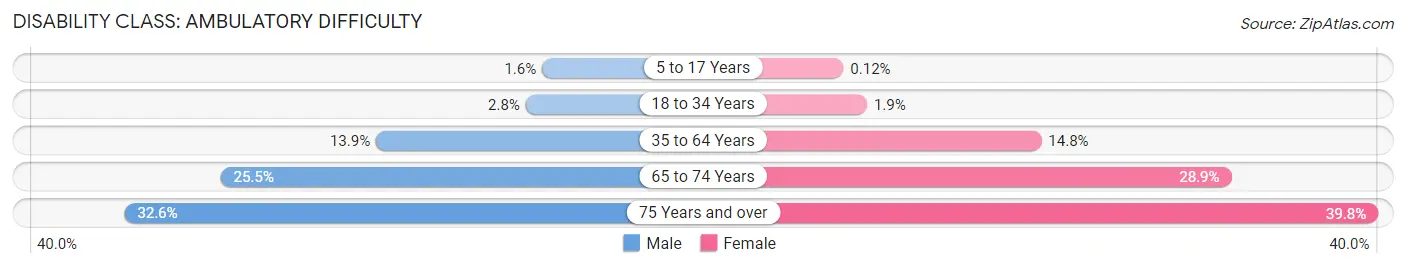
| Age Bracket | Male | Female |
| 5 to 17 Years | 56 (1.6%) | 4 (0.1%) |
| 18 to 34 Years | 114 (2.8%) | 73 (1.9%) |
| 35 to 64 Years | 1,044 (13.9%) | 1,083 (14.8%) |
| 65 to 74 Years | 518 (25.5%) | 660 (28.9%) |
| 75 Years and over | 396 (32.6%) | 625 (39.8%) |
Disability Class: Self-Care Difficulty
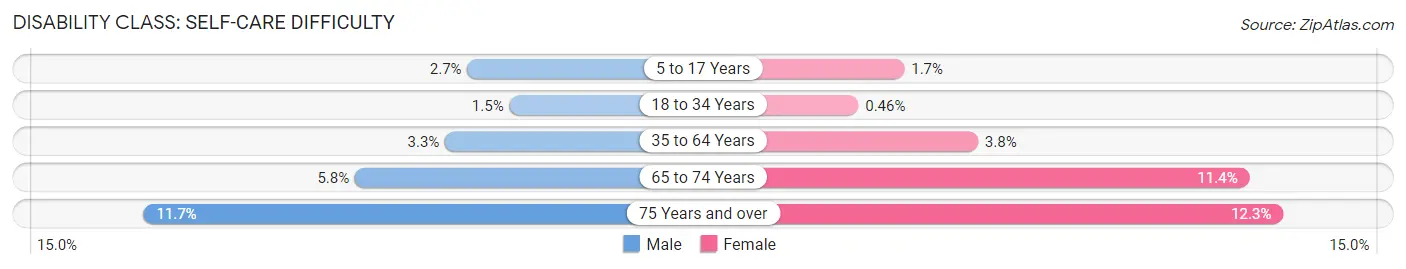
| Age Bracket | Male | Female |
| 5 to 17 Years | 95 (2.7%) | 57 (1.7%) |
| 18 to 34 Years | 61 (1.5%) | 18 (0.5%) |
| 35 to 64 Years | 247 (3.3%) | 277 (3.8%) |
| 65 to 74 Years | 118 (5.8%) | 259 (11.4%) |
| 75 Years and over | 142 (11.7%) | 193 (12.3%) |
Technology Access in Mayes County
Computing Device Access in Mayes County
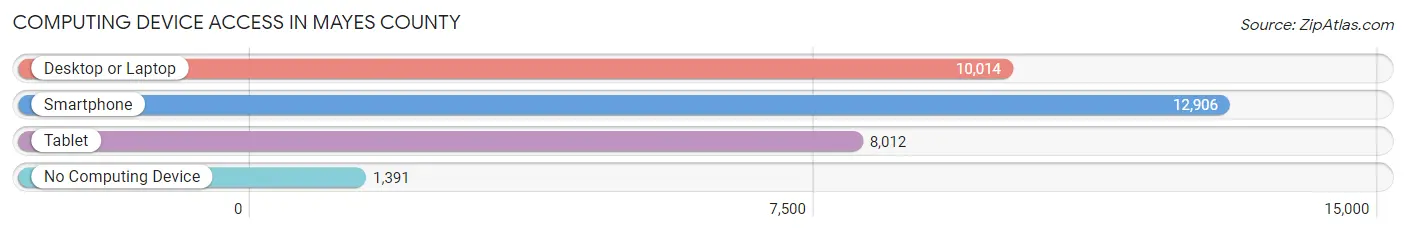
| Device Type | # Households | % Households |
| Desktop or Laptop | 10,014 | 66.3% |
| Smartphone | 12,906 | 85.4% |
| Tablet | 8,012 | 53.0% |
| No Computing Device | 1,391 | 9.2% |
| Total | 15,112 | 100.0% |
Internet Access in Mayes County
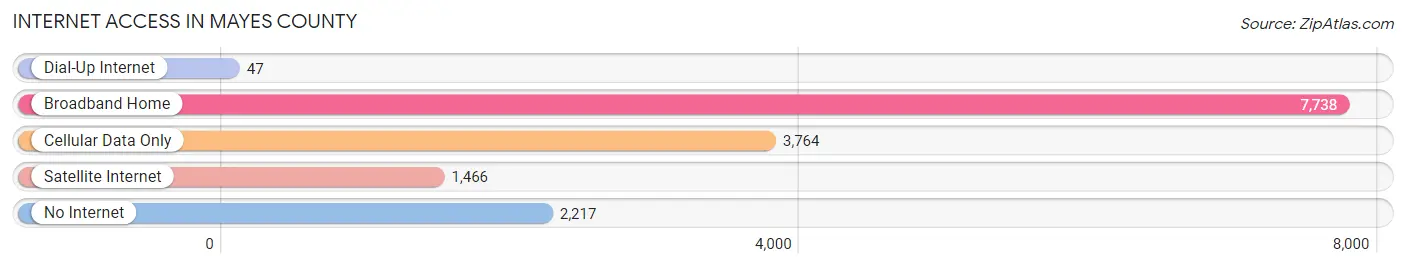
| Internet Type | # Households | % Households |
| Dial-Up Internet | 47 | 0.3% |
| Broadband Home | 7,738 | 51.2% |
| Cellular Data Only | 3,764 | 24.9% |
| Satellite Internet | 1,466 | 9.7% |
| No Internet | 2,217 | 14.7% |
| Total | 15,112 | 100.0% |
Mayes County Summary
Mayes County is located in the northeastern corner of Oklahoma and is part of the Green Country region. It is bordered by Rogers County to the north, Delaware County to the east, Wagoner County to the south, and Adair County to the west. The county seat is Pryor, and the largest city is Pryor Creek. The county was named for Samuel Houston Mayes, a prominent Cherokee leader.
Geography
Mayes County covers an area of 590 square miles and is located in the Ozark Plateau region of Oklahoma. The terrain is mostly rolling hills and wooded areas, with some flat areas in the northern part of the county. The Grand River runs through the county, and there are several small lakes and reservoirs. The climate is humid subtropical, with hot summers and mild winters.
Demographics
As of the 2010 census, the population of Mayes County was 41,259, making it the 33rd most populous county in Oklahoma. The population density was 70 people per square mile. The racial makeup of the county was 79.2% White, 8.2% African American, 8.3% Native American, 0.6% Asian, 0.1% Pacific Islander, and 2.6% from other races. Hispanic or Latino of any race were 3.3% of the population.
The median income for a household in the county was $37,845, and the median income for a family was $45,845. The per capita income for the county was $19,845. About 13.2% of families and 16.2% of the population were below the poverty line, including 22.2% of those under age 18 and 11.2% of those age 65 or over.
Economy
The economy of Mayes County is largely based on agriculture and manufacturing. The county is home to several large farms, and the main crops grown are corn, soybeans, wheat, and hay. The county is also home to several manufacturing companies, including a large poultry processing plant and a large paper mill.
The county is also home to several tourist attractions, including the Pryor Creek Golf Course, the Pryor Creek Music Festival, and the Pryor Creek Wildlife Refuge. The county is also home to several state parks, including the Grand River State Park and the Pryor Creek State Park.
Mayes County is served by two school districts, Pryor Public Schools and Mayes County Public Schools. The county is also home to several higher education institutions, including Northeastern State University, Rogers State University, and the University of Oklahoma.
Mayes County is served by several major highways, including Interstate 44, U.S. Route 69, and U.S. Route 412. The county is also served by several airports, including the Pryor Creek Regional Airport and the Tulsa International Airport.
Mayes County is a great place to live, work, and play. With its diverse economy, beautiful scenery, and friendly people, it is a great place to call home.
Common Questions
What is the Total Population of Mayes County?
Total Population of Mayes County is 39,324.
What is the Total Male Population of Mayes County?
Total Male Population of Mayes County is 19,757.
What is the Total Female Population of Mayes County?
Total Female Population of Mayes County is 19,567.
What is the Ratio of Males per 100 Females in Mayes County?
There are 100.97 Males per 100 Females in Mayes County.
What is the Ratio of Females per 100 Males in Mayes County?
There are 99.04 Females per 100 Males in Mayes County.
What is the Median Population Age in Mayes County?
Median Population Age in Mayes County is 40.3 Years.
What is the Average Family Size in Mayes County
Average Family Size in Mayes County is 3.1 People.
What is the Average Household Size in Mayes County
Average Household Size in Mayes County is 2.6 People.
What is Per Capita Income in Mayes County?
Per Capita income in Mayes County is $29,607.
What is the Median Family Income in Mayes County?
Median Family Income in Mayes County is $68,826.
What is the Median Household income in Mayes County?
Median Household Income in Mayes County is $56,552.
What is Income or Wage Gap in Mayes County?
Income or Wage Gap in Mayes County is 46.3%.
Women in Mayes County earn 53.7 cents for every dollar earned by a man.
What is Family Income Deficit in Mayes County?
Family Income Deficit in Mayes County is $10,735.
Families that are below poverty line in Mayes County earn $10,735 less on average than the poverty threshold level.
What is Inequality or Gini Index in Mayes County?
Inequality or Gini Index in Mayes County is 0.44.
How Large is the Labor Force in Mayes County?
There are 17,680 People in the Labor Forcein in Mayes County.
What is the Percentage of People in the Labor Force in Mayes County?
56.6% of People are in the Labor Force in Mayes County.
What is the Unemployment Rate in Mayes County?
Unemployment Rate in Mayes County is 5.9%.