Scotts Bluff County, NE
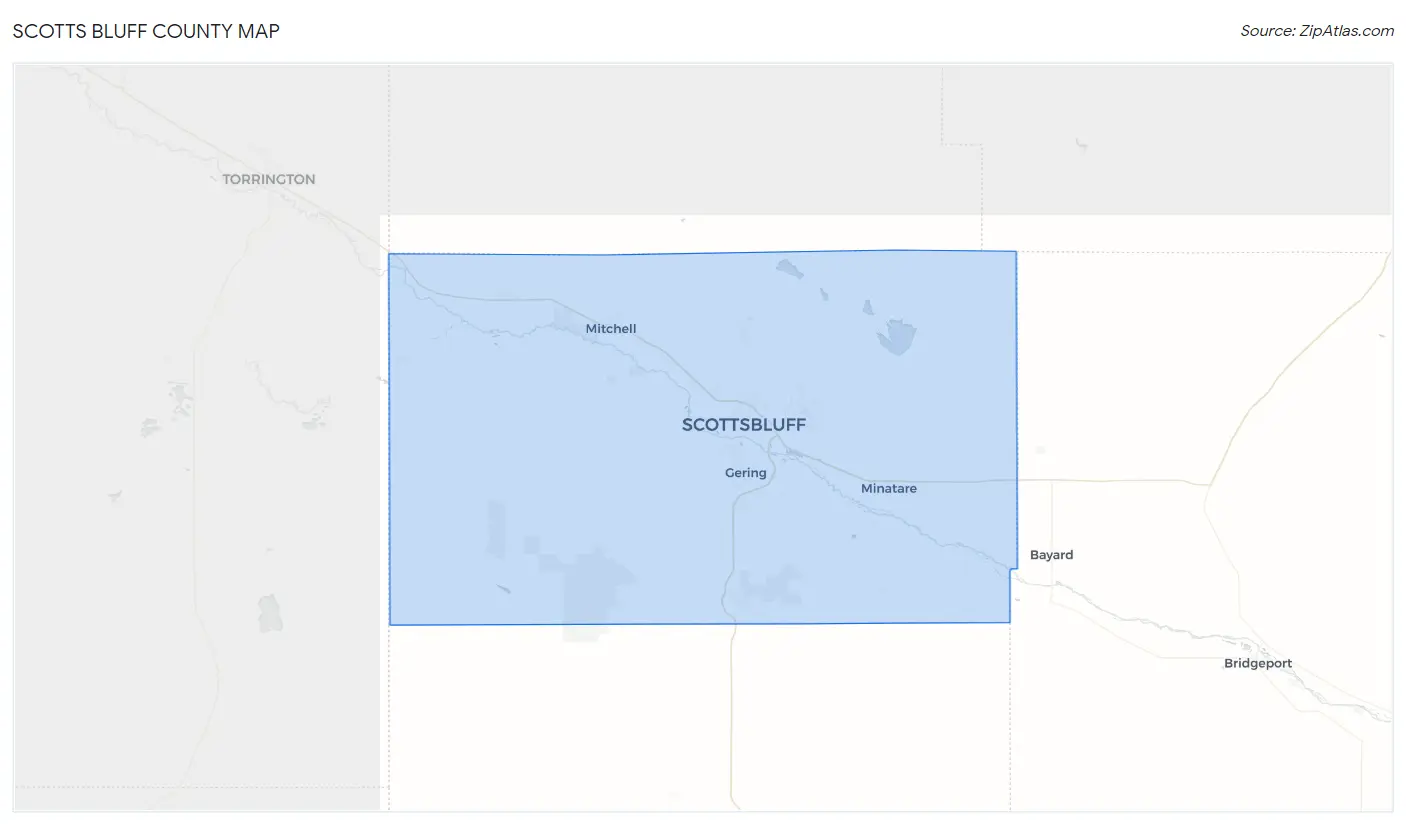
Scotts Bluff County Map
Scotts Bluff County Overview
36,048
TOTAL POPULATION
17,521
MALE POPULATION
18,527
FEMALE POPULATION
94.57
MALES / 100 FEMALES
105.74
FEMALES / 100 MALES
39.2
MEDIAN AGE
3.0
AVG FAMILY SIZE
2.3
AVG HOUSEHOLD SIZE
$33,158
PER CAPITA INCOME
$78,472
AVG FAMILY INCOME
$60,137
AVG HOUSEHOLD INCOME
29.4%
WAGE / INCOME GAP [ % ]
70.6¢/ $1
WAGE / INCOME GAP [ $ ]
$9,804
FAMILY INCOME DEFICIT
0.44
INEQUALITY / GINI INDEX
18,060
LABOR FORCE [ PEOPLE ]
64.0%
PERCENT IN LABOR FORCE
3.5%
UNEMPLOYMENT RATE
Scotts Bluff County Area Codes
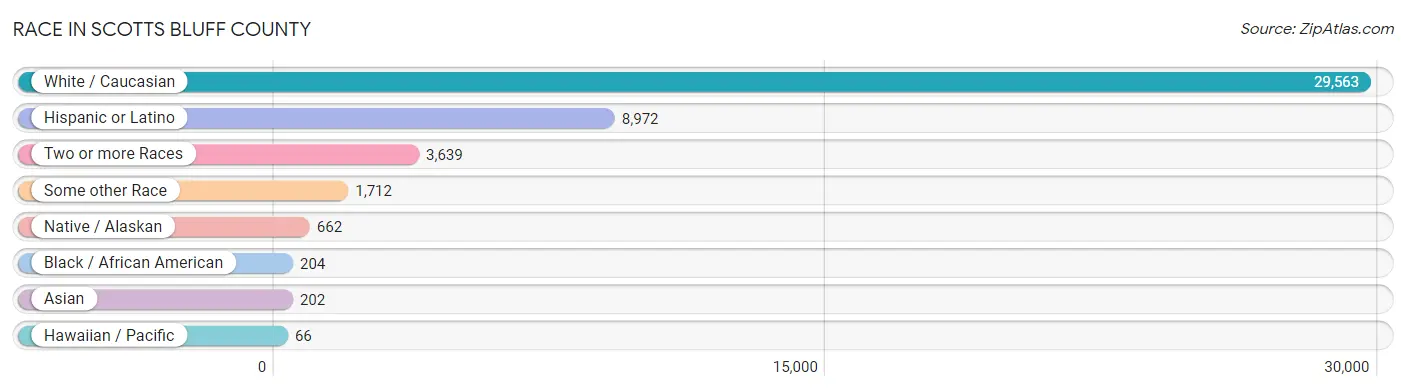
Race in Scotts Bluff County
The most populous races in Scotts Bluff County are White / Caucasian (29,563 | 82.0%), Hispanic or Latino (8,972 | 24.9%), and Two or more Races (3,639 | 10.1%).
| Race | # Population | % Population |
| Asian | 202 | 0.6% |
| Black / African American | 204 | 0.6% |
| Hawaiian / Pacific | 66 | 0.2% |
| Hispanic or Latino | 8,972 | 24.9% |
| Native / Alaskan | 662 | 1.8% |
| White / Caucasian | 29,563 | 82.0% |
| Two or more Races | 3,639 | 10.1% |
| Some other Race | 1,712 | 4.8% |
| Total | 36,048 | 100.0% |
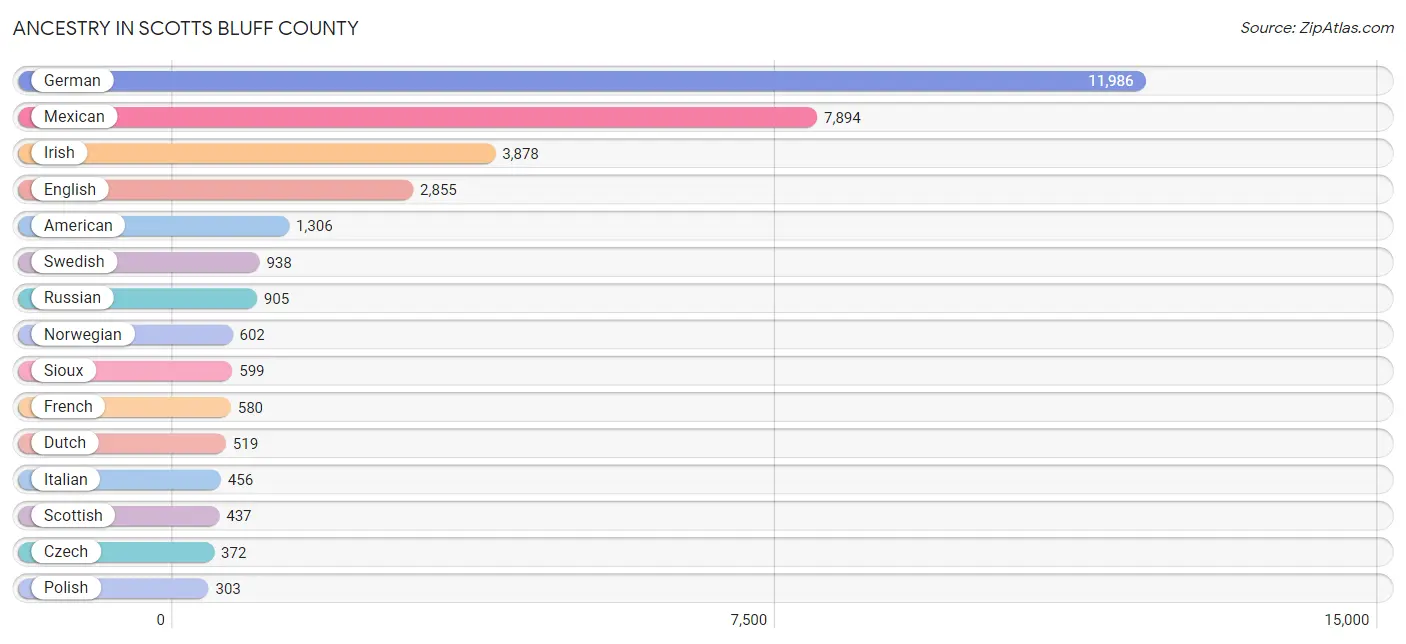
Ancestry in Scotts Bluff County
The most populous ancestries reported in Scotts Bluff County are German (11,986 | 33.3%), Mexican (7,894 | 21.9%), Irish (3,878 | 10.8%), English (2,855 | 7.9%), and American (1,306 | 3.6%), together accounting for 77.5% of all Scotts Bluff County residents.
| Ancestry | # Population | % Population |
| American | 1,306 | 3.6% |
| Arab | 9 | 0.0% |
| Australian | 6 | 0.0% |
| Austrian | 16 | 0.0% |
| Belgian | 15 | 0.0% |
| Bhutanese | 128 | 0.4% |
| British | 176 | 0.5% |
| Cajun | 24 | 0.1% |
| Canadian | 144 | 0.4% |
| Central American | 178 | 0.5% |
| Central American Indian | 50 | 0.1% |
| Cherokee | 135 | 0.4% |
| Chilean | 8 | 0.0% |
| Choctaw | 61 | 0.2% |
| Colombian | 42 | 0.1% |
| Croatian | 195 | 0.5% |
| Crow | 93 | 0.3% |
| Cuban | 12 | 0.0% |
| Czech | 372 | 1.0% |
| Czechoslovakian | 78 | 0.2% |
| Danish | 146 | 0.4% |
| Dutch | 519 | 1.4% |
| English | 2,855 | 7.9% |
| European | 299 | 0.8% |
| Filipino | 11 | 0.0% |
| French | 580 | 1.6% |
| French Canadian | 50 | 0.1% |
| German | 11,986 | 33.3% |
| German Russian | 105 | 0.3% |
| Greek | 300 | 0.8% |
| Guamanian / Chamorro | 63 | 0.2% |
| Guatemalan | 108 | 0.3% |
| Hungarian | 67 | 0.2% |
| Indian (Asian) | 82 | 0.2% |
| Indonesian | 6 | 0.0% |
| Irish | 3,878 | 10.8% |
| Italian | 456 | 1.3% |
| Korean | 31 | 0.1% |
| Latvian | 2 | 0.0% |
| Lithuanian | 11 | 0.0% |
| Malaysian | 63 | 0.2% |
| Mexican | 7,894 | 21.9% |
| Mexican American Indian | 40 | 0.1% |
| Native Hawaiian | 35 | 0.1% |
| Navajo | 38 | 0.1% |
| Nigerian | 4 | 0.0% |
| Northern European | 51 | 0.1% |
| Norwegian | 602 | 1.7% |
| Paiute | 5 | 0.0% |
| Panamanian | 40 | 0.1% |
| Pennsylvania German | 52 | 0.1% |
| Peruvian | 78 | 0.2% |
| Polish | 303 | 0.8% |
| Portuguese | 65 | 0.2% |
| Potawatomi | 5 | 0.0% |
| Puerto Rican | 217 | 0.6% |
| Russian | 905 | 2.5% |
| Salvadoran | 30 | 0.1% |
| Samoan | 13 | 0.0% |
| Scandinavian | 53 | 0.2% |
| Scotch-Irish | 301 | 0.8% |
| Scottish | 437 | 1.2% |
| Seminole | 3 | 0.0% |
| Shoshone | 6 | 0.0% |
| Sioux | 599 | 1.7% |
| Slovene | 4 | 0.0% |
| South American | 147 | 0.4% |
| Spaniard | 145 | 0.4% |
| Spanish | 59 | 0.2% |
| Sri Lankan | 20 | 0.1% |
| Subsaharan African | 9 | 0.0% |
| Sudanese | 5 | 0.0% |
| Swedish | 938 | 2.6% |
| Swiss | 89 | 0.3% |
| Syrian | 9 | 0.0% |
| Thai | 62 | 0.2% |
| Tlingit-Haida | 9 | 0.0% |
| Ukrainian | 1 | 0.0% |
| Venezuelan | 19 | 0.1% |
| Welsh | 169 | 0.5% |
| Yugoslavian | 1 | 0.0% | View All 81 Rows |
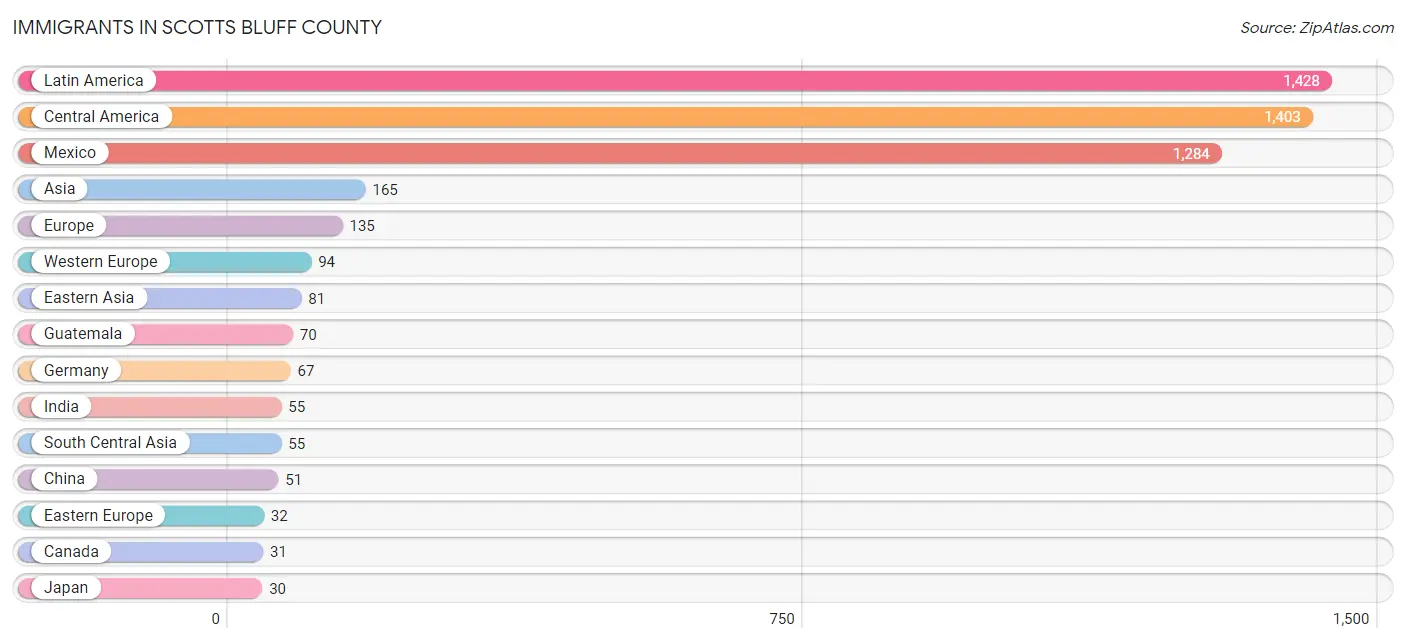
Immigrants in Scotts Bluff County
The most numerous immigrant groups reported in Scotts Bluff County came from Latin America (1,428 | 4.0%), Central America (1,403 | 3.9%), Mexico (1,284 | 3.6%), Asia (165 | 0.5%), and Europe (135 | 0.4%), together accounting for 12.2% of all Scotts Bluff County residents.
| Immigration Origin | # Population | % Population |
| Asia | 165 | 0.5% |
| Canada | 31 | 0.1% |
| Caribbean | 12 | 0.0% |
| Central America | 1,403 | 3.9% |
| China | 51 | 0.1% |
| Croatia | 25 | 0.1% |
| Cuba | 12 | 0.0% |
| Eastern Asia | 81 | 0.2% |
| Eastern Europe | 32 | 0.1% |
| El Salvador | 28 | 0.1% |
| Europe | 135 | 0.4% |
| France | 5 | 0.0% |
| Germany | 67 | 0.2% |
| Guatemala | 70 | 0.2% |
| Honduras | 19 | 0.1% |
| India | 55 | 0.2% |
| Japan | 30 | 0.1% |
| Latin America | 1,428 | 4.0% |
| Mexico | 1,284 | 3.6% |
| Netherlands | 22 | 0.1% |
| Northern Europe | 9 | 0.0% |
| Norway | 9 | 0.0% |
| Panama | 2 | 0.0% |
| Peru | 13 | 0.0% |
| Philippines | 15 | 0.0% |
| Poland | 7 | 0.0% |
| South America | 13 | 0.0% |
| South Central Asia | 55 | 0.2% |
| South Eastern Asia | 29 | 0.1% |
| Taiwan | 27 | 0.1% |
| Vietnam | 8 | 0.0% |
| Western Europe | 94 | 0.3% | View All 32 Rows |
Sex and Age in Scotts Bluff County
Sex and Age in Scotts Bluff County
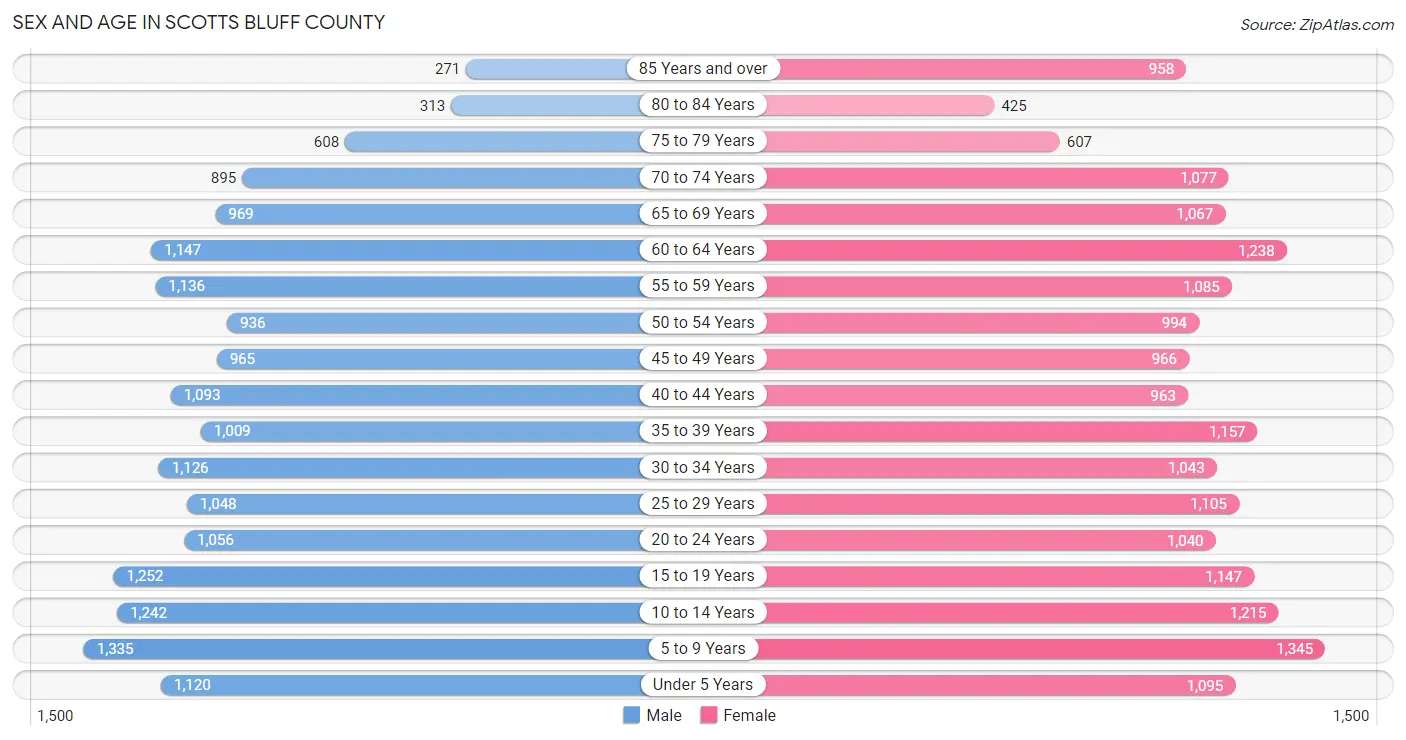
The most populous age groups in Scotts Bluff County are 5 to 9 Years (1,335 | 7.6%) for men and 5 to 9 Years (1,345 | 7.3%) for women.
| Age Bracket | Male | Female |
| Under 5 Years | 1,120 (6.4%) | 1,095 (5.9%) |
| 5 to 9 Years | 1,335 (7.6%) | 1,345 (7.3%) |
| 10 to 14 Years | 1,242 (7.1%) | 1,215 (6.6%) |
| 15 to 19 Years | 1,252 (7.1%) | 1,147 (6.2%) |
| 20 to 24 Years | 1,056 (6.0%) | 1,040 (5.6%) |
| 25 to 29 Years | 1,048 (6.0%) | 1,105 (6.0%) |
| 30 to 34 Years | 1,126 (6.4%) | 1,043 (5.6%) |
| 35 to 39 Years | 1,009 (5.8%) | 1,157 (6.2%) |
| 40 to 44 Years | 1,093 (6.2%) | 963 (5.2%) |
| 45 to 49 Years | 965 (5.5%) | 966 (5.2%) |
| 50 to 54 Years | 936 (5.3%) | 994 (5.4%) |
| 55 to 59 Years | 1,136 (6.5%) | 1,085 (5.9%) |
| 60 to 64 Years | 1,147 (6.6%) | 1,238 (6.7%) |
| 65 to 69 Years | 969 (5.5%) | 1,067 (5.8%) |
| 70 to 74 Years | 895 (5.1%) | 1,077 (5.8%) |
| 75 to 79 Years | 608 (3.5%) | 607 (3.3%) |
| 80 to 84 Years | 313 (1.8%) | 425 (2.3%) |
| 85 Years and over | 271 (1.5%) | 958 (5.2%) |
| Total | 17,521 (100.0%) | 18,527 (100.0%) |
Families and Households in Scotts Bluff County
Median Family Size in Scotts Bluff County
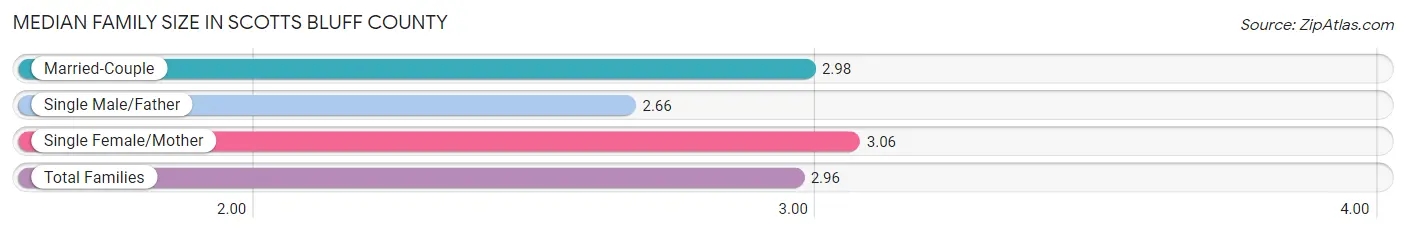
The median family size in Scotts Bluff County is 2.96 persons per family, with single female/mother families (1,537 | 16.3%) accounting for the largest median family size of 3.06 persons per family. On the other hand, single male/father families (953 | 10.1%) represent the smallest median family size with 2.66 persons per family.
| Family Type | # Families | Family Size |
| Married-Couple | 6,920 (73.5%) | 2.98 |
| Single Male/Father | 953 (10.1%) | 2.66 |
| Single Female/Mother | 1,537 (16.3%) | 3.06 |
| Total Families | 9,410 (100.0%) | 2.96 |
Median Household Size in Scotts Bluff County
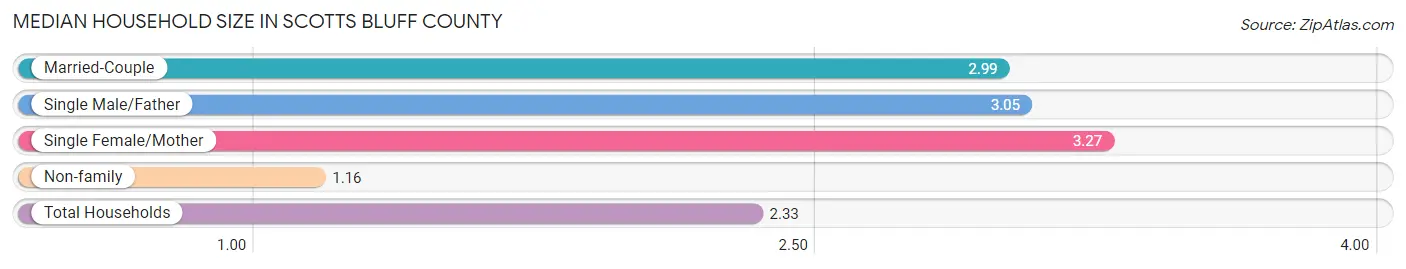
The median household size in Scotts Bluff County is 2.33 persons per household, with single female/mother households (1,537 | 10.2%) accounting for the largest median household size of 3.27 persons per household. non-family households (5,709 | 37.8%) represent the smallest median household size with 1.16 persons per household.
| Household Type | # Households | Household Size |
| Married-Couple | 6,920 (45.8%) | 2.99 |
| Single Male/Father | 953 (6.3%) | 3.05 |
| Single Female/Mother | 1,537 (10.2%) | 3.27 |
| Non-family | 5,709 (37.8%) | 1.16 |
| Total Households | 15,119 (100.0%) | 2.33 |
Household Size by Marriage Status in Scotts Bluff County
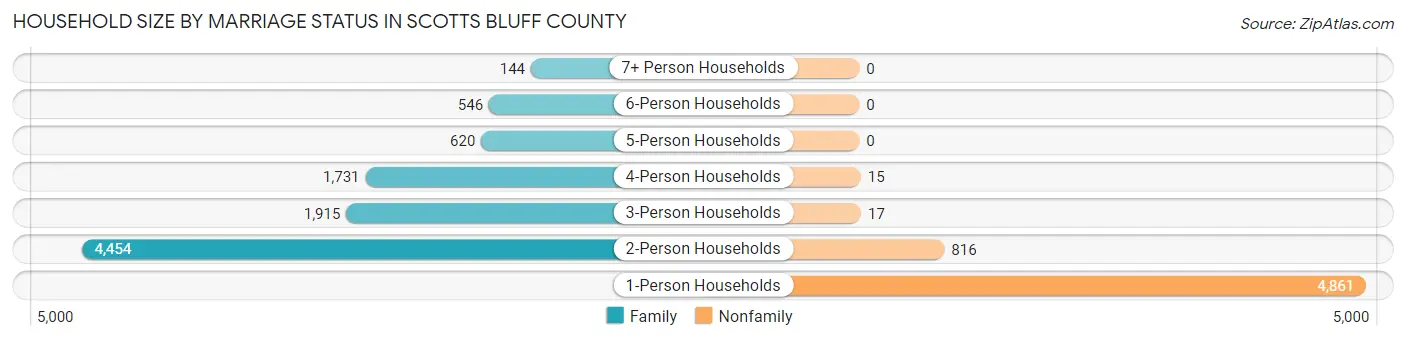
Out of a total of 15,119 households in Scotts Bluff County, 9,410 (62.2%) are family households, while 5,709 (37.8%) are nonfamily households. The most numerous type of family households are 2-person households, comprising 4,454, and the most common type of nonfamily households are 1-person households, comprising 4,861.
| Household Size | Family Households | Nonfamily Households |
| 1-Person Households | - | 4,861 (32.2%) |
| 2-Person Households | 4,454 (29.5%) | 816 (5.4%) |
| 3-Person Households | 1,915 (12.7%) | 17 (0.1%) |
| 4-Person Households | 1,731 (11.5%) | 15 (0.1%) |
| 5-Person Households | 620 (4.1%) | 0 (0.0%) |
| 6-Person Households | 546 (3.6%) | 0 (0.0%) |
| 7+ Person Households | 144 (0.9%) | 0 (0.0%) |
| Total | 9,410 (62.2%) | 5,709 (37.8%) |
Female Fertility in Scotts Bluff County
Fertility by Age in Scotts Bluff County
Average fertility rate in Scotts Bluff County is 69.0 births per 1,000 women. Women in the age bracket of 20 to 34 years have the highest fertility rate with 127.0 births per 1,000 women. Women in the age bracket of 20 to 34 years acount for 77.2% of all women with births.
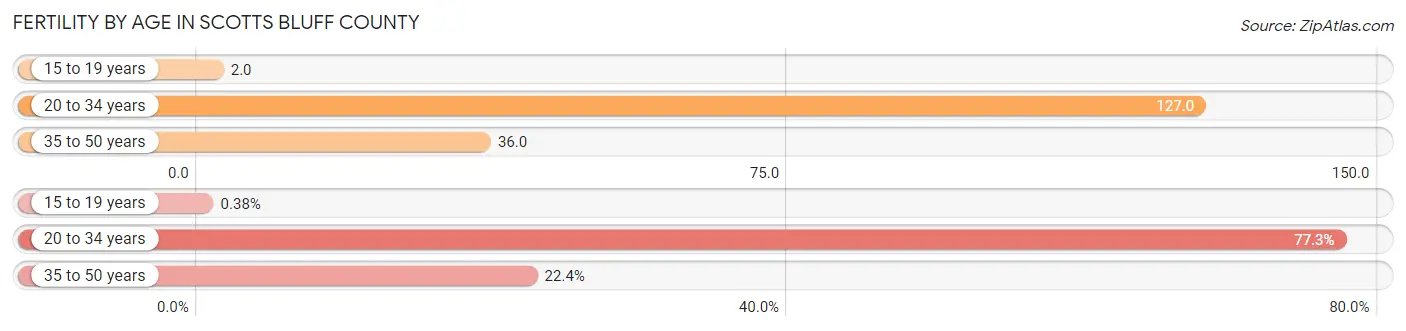
| Age Bracket | Women with Births | Births / 1,000 Women |
| 15 to 19 years | 2 (0.4%) | 2.0 |
| 20 to 34 years | 404 (77.2%) | 127.0 |
| 35 to 50 years | 117 (22.4%) | 36.0 |
| Total | 523 (100.0%) | 69.0 |
Fertility by Age by Marriage Status in Scotts Bluff County
88.7% of women with births (523) in Scotts Bluff County are married. The highest percentage of unmarried women with births falls into 15 to 19 years age bracket with 100.0% of them unmarried at the time of birth, while the lowest percentage of unmarried women with births belong to 35 to 50 years age bracket with 0.0% of them unmarried.
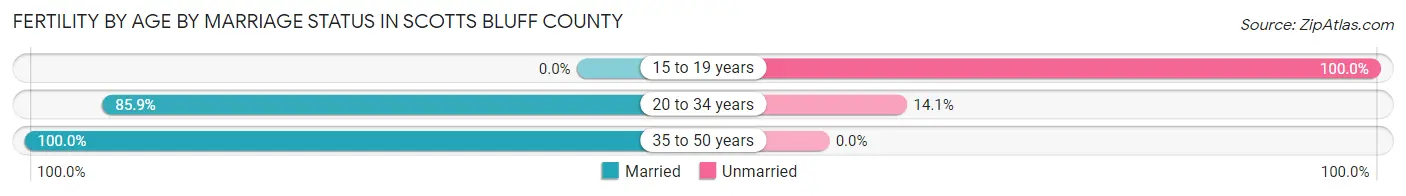
| Age Bracket | Married | Unmarried |
| 15 to 19 years | 0 (0.0%) | 2 (100.0%) |
| 20 to 34 years | 347 (85.9%) | 57 (14.1%) |
| 35 to 50 years | 117 (100.0%) | 0 (0.0%) |
| Total | 464 (88.7%) | 59 (11.3%) |
Fertility by Education in Scotts Bluff County
Average fertility rate in Scotts Bluff County is 69.0 births per 1,000 women. Women with the education attainment of college or associate's degree have the highest fertility rate of 103.0 births per 1,000 women, while women with the education attainment of less than high school have the lowest fertility at 29.0 births per 1,000 women. Women with the education attainment of college or associate's degree represent 47.4% of all women with births.
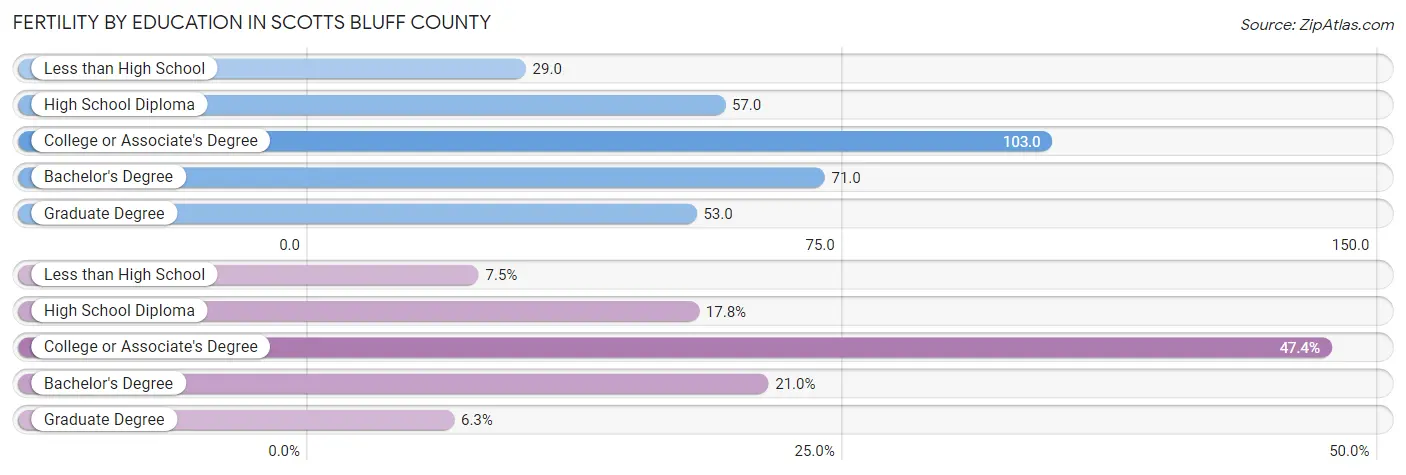
| Educational Attainment | Women with Births | Births / 1,000 Women |
| Less than High School | 39 (7.5%) | 29.0 |
| High School Diploma | 93 (17.8%) | 57.0 |
| College or Associate's Degree | 248 (47.4%) | 103.0 |
| Bachelor's Degree | 110 (21.0%) | 71.0 |
| Graduate Degree | 33 (6.3%) | 53.0 |
| Total | 523 (100.0%) | 69.0 |
Fertility by Education by Marriage Status in Scotts Bluff County
11.3% of women with births in Scotts Bluff County are unmarried. Women with the educational attainment of bachelor's degree are most likely to be married with 100.0% of them married at childbirth, while women with the educational attainment of high school diploma are least likely to be married with 30.1% of them unmarried at childbirth.
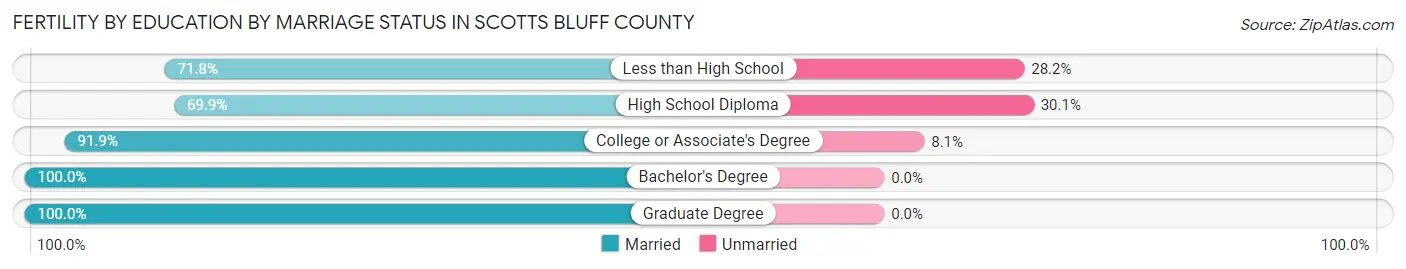
| Educational Attainment | Married | Unmarried |
| Less than High School | 28 (71.8%) | 11 (28.2%) |
| High School Diploma | 65 (69.9%) | 28 (30.1%) |
| College or Associate's Degree | 228 (91.9%) | 20 (8.1%) |
| Bachelor's Degree | 110 (100.0%) | 0 (0.0%) |
| Graduate Degree | 33 (100.0%) | 0 (0.0%) |
| Total | 464 (88.7%) | 59 (11.3%) |
Income in Scotts Bluff County
Income Overview in Scotts Bluff County
Per Capita Income in Scotts Bluff County is $33,158, while median incomes of families and households are $78,472 and $60,137 respectively.
| Characteristic | Number | Measure |
| Per Capita Income | 36,048 | $33,158 |
| Median Family Income | 9,410 | $78,472 |
| Mean Family Income | 9,410 | $94,215 |
| Median Household Income | 15,119 | $60,137 |
| Mean Household Income | 15,119 | $76,466 |
| Income Deficit | 9,410 | $9,804 |
| Wage / Income Gap (%) | 36,048 | 29.39% |
| Wage / Income Gap ($) | 36,048 | 70.61¢ per $1 |
| Gini / Inequality Index | 36,048 | 0.44 |
Earnings by Sex in Scotts Bluff County
Average Earnings in Scotts Bluff County are $37,237, $44,405 for men and $31,356 for women, a difference of 29.4%.
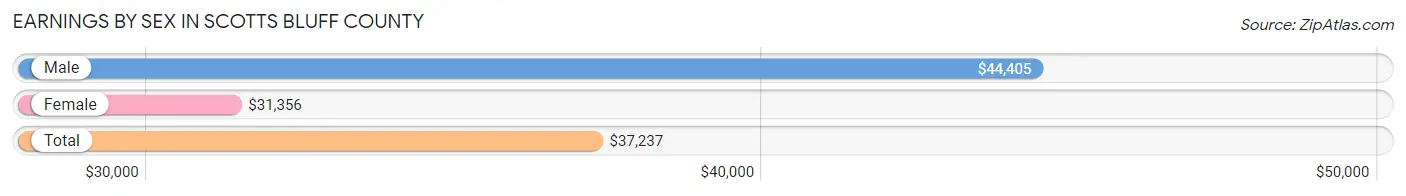
| Sex | Number | Average Earnings |
| Male | 9,954 (51.9%) | $44,405 |
| Female | 9,210 (48.1%) | $31,356 |
| Total | 19,164 (100.0%) | $37,237 |
Earnings by Sex by Income Bracket in Scotts Bluff County
The most common earnings brackets in Scotts Bluff County are $100,000+ for men (1,141 | 11.5%) and $30,000 to $34,999 for women (772 | 8.4%).
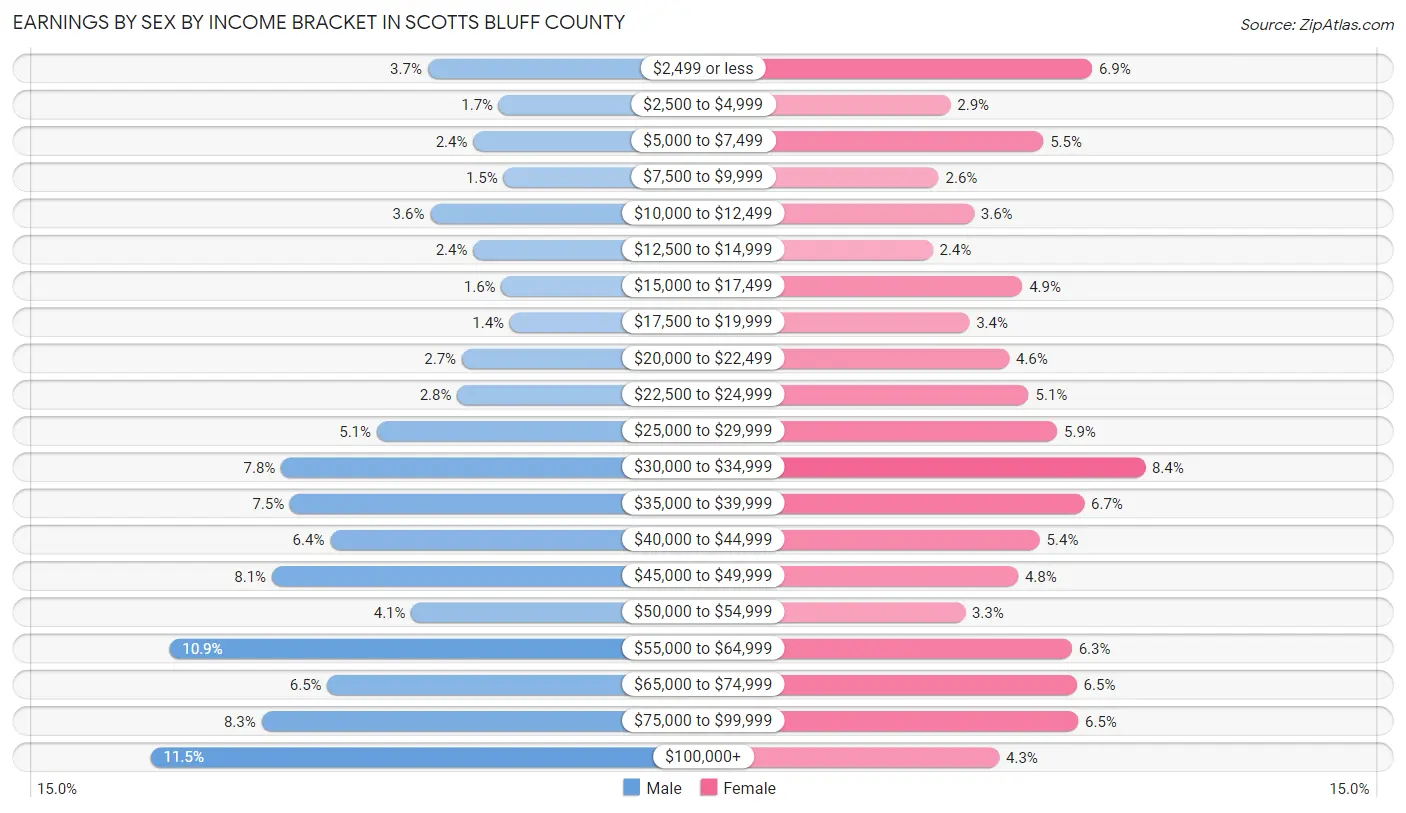
| Income | Male | Female |
| $2,499 or less | 365 (3.7%) | 635 (6.9%) |
| $2,500 to $4,999 | 166 (1.7%) | 268 (2.9%) |
| $5,000 to $7,499 | 238 (2.4%) | 508 (5.5%) |
| $7,500 to $9,999 | 153 (1.5%) | 238 (2.6%) |
| $10,000 to $12,499 | 358 (3.6%) | 329 (3.6%) |
| $12,500 to $14,999 | 238 (2.4%) | 222 (2.4%) |
| $15,000 to $17,499 | 159 (1.6%) | 454 (4.9%) |
| $17,500 to $19,999 | 135 (1.4%) | 317 (3.4%) |
| $20,000 to $22,499 | 270 (2.7%) | 420 (4.6%) |
| $22,500 to $24,999 | 283 (2.8%) | 471 (5.1%) |
| $25,000 to $29,999 | 508 (5.1%) | 544 (5.9%) |
| $30,000 to $34,999 | 775 (7.8%) | 772 (8.4%) |
| $35,000 to $39,999 | 751 (7.5%) | 614 (6.7%) |
| $40,000 to $44,999 | 638 (6.4%) | 499 (5.4%) |
| $45,000 to $49,999 | 801 (8.1%) | 443 (4.8%) |
| $50,000 to $54,999 | 411 (4.1%) | 306 (3.3%) |
| $55,000 to $64,999 | 1,088 (10.9%) | 582 (6.3%) |
| $65,000 to $74,999 | 646 (6.5%) | 595 (6.5%) |
| $75,000 to $99,999 | 830 (8.3%) | 599 (6.5%) |
| $100,000+ | 1,141 (11.5%) | 394 (4.3%) |
| Total | 9,954 (100.0%) | 9,210 (100.0%) |
Earnings by Sex by Educational Attainment in Scotts Bluff County
Average earnings in Scotts Bluff County are $48,188 for men and $34,658 for women, a difference of 28.1%. Men with an educational attainment of graduate degree enjoy the highest average annual earnings of $78,167, while those with less than high school education earn the least with $34,333. Women with an educational attainment of graduate degree earn the most with the average annual earnings of $70,077, while those with less than high school education have the smallest earnings of $19,462.
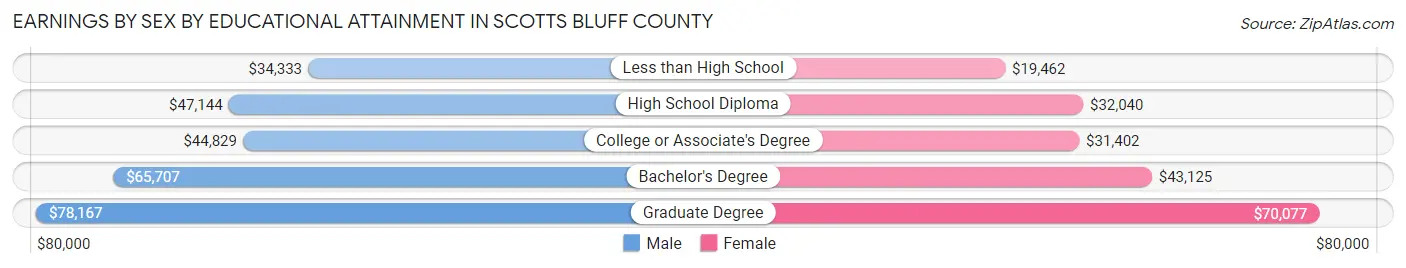
| Educational Attainment | Male Income | Female Income |
| Less than High School | $34,333 | $19,462 |
| High School Diploma | $47,144 | $32,040 |
| College or Associate's Degree | $44,829 | $31,402 |
| Bachelor's Degree | $65,707 | $43,125 |
| Graduate Degree | $78,167 | $70,077 |
| Total | $48,188 | $34,658 |
Family Income in Scotts Bluff County
Family Income Brackets in Scotts Bluff County
According to the Scotts Bluff County family income data, there are 2,089 families falling into the $100,000 to $149,999 income range, which is the most common income bracket and makes up 22.2% of all families. Conversely, the less than $10,000 income bracket is the least frequent group with only 169 families (1.8%) belonging to this category.
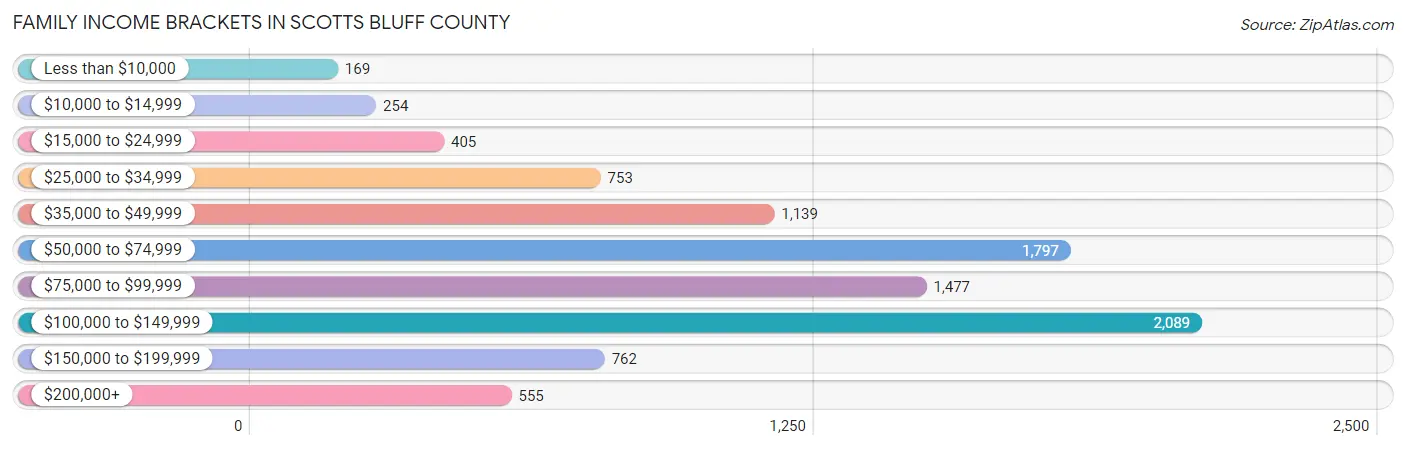
| Income Bracket | # Families | % Families |
| Less than $10,000 | 169 | 1.8% |
| $10,000 to $14,999 | 254 | 2.7% |
| $15,000 to $24,999 | 405 | 4.3% |
| $25,000 to $34,999 | 753 | 8.0% |
| $35,000 to $49,999 | 1,139 | 12.1% |
| $50,000 to $74,999 | 1,797 | 19.1% |
| $75,000 to $99,999 | 1,477 | 15.7% |
| $100,000 to $149,999 | 2,089 | 22.2% |
| $150,000 to $199,999 | 762 | 8.1% |
| $200,000+ | 555 | 5.9% |
Family Income by Famaliy Size in Scotts Bluff County
7+ person families (106 | 1.1%) account for the highest median family income in Scotts Bluff County with $118,482 per family, while 2-person families (4,749 | 50.5%) have the highest median income of $35,566 per family member.
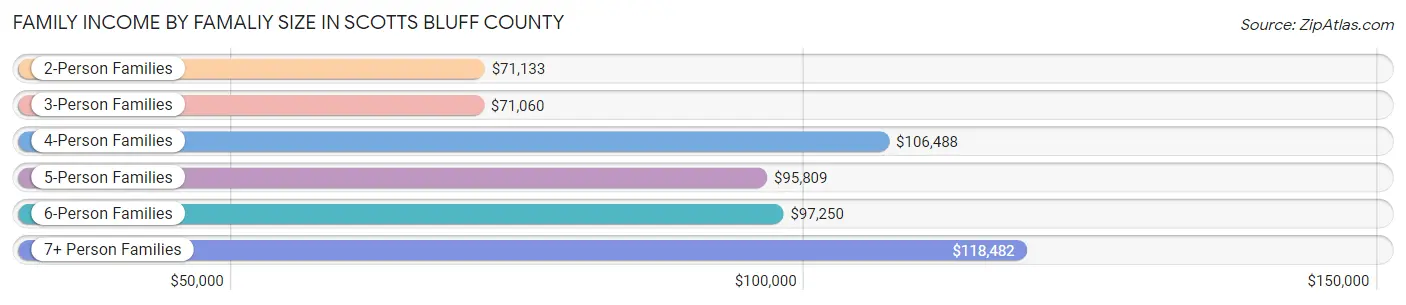
| Income Bracket | # Families | Median Income |
| 2-Person Families | 4,749 (50.5%) | $71,133 |
| 3-Person Families | 1,917 (20.4%) | $71,060 |
| 4-Person Families | 1,545 (16.4%) | $106,488 |
| 5-Person Families | 598 (6.4%) | $95,809 |
| 6-Person Families | 495 (5.3%) | $97,250 |
| 7+ Person Families | 106 (1.1%) | $118,482 |
| Total | 9,410 (100.0%) | $78,472 |
Family Income by Number of Earners in Scotts Bluff County
The median family income in Scotts Bluff County is $78,472, with families comprising 3+ earners (838) having the highest median family income of $119,500, while families with no earners (1,264) have the lowest median family income of $43,045, accounting for 8.9% and 13.4% of families, respectively.
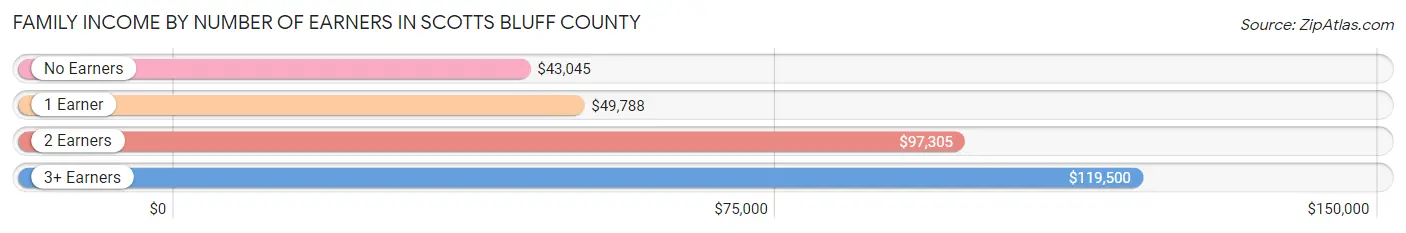
| Number of Earners | # Families | Median Income |
| No Earners | 1,264 (13.4%) | $43,045 |
| 1 Earner | 3,038 (32.3%) | $49,788 |
| 2 Earners | 4,270 (45.4%) | $97,305 |
| 3+ Earners | 838 (8.9%) | $119,500 |
| Total | 9,410 (100.0%) | $78,472 |
Household Income in Scotts Bluff County
Household Income Brackets in Scotts Bluff County
With 2,873 households falling in the category, the $50,000 to $74,999 income range is the most frequent in Scotts Bluff County, accounting for 19.0% of all households. In contrast, only 620 households (4.1%) fall into the $200,000+ income bracket, making it the least populous group.
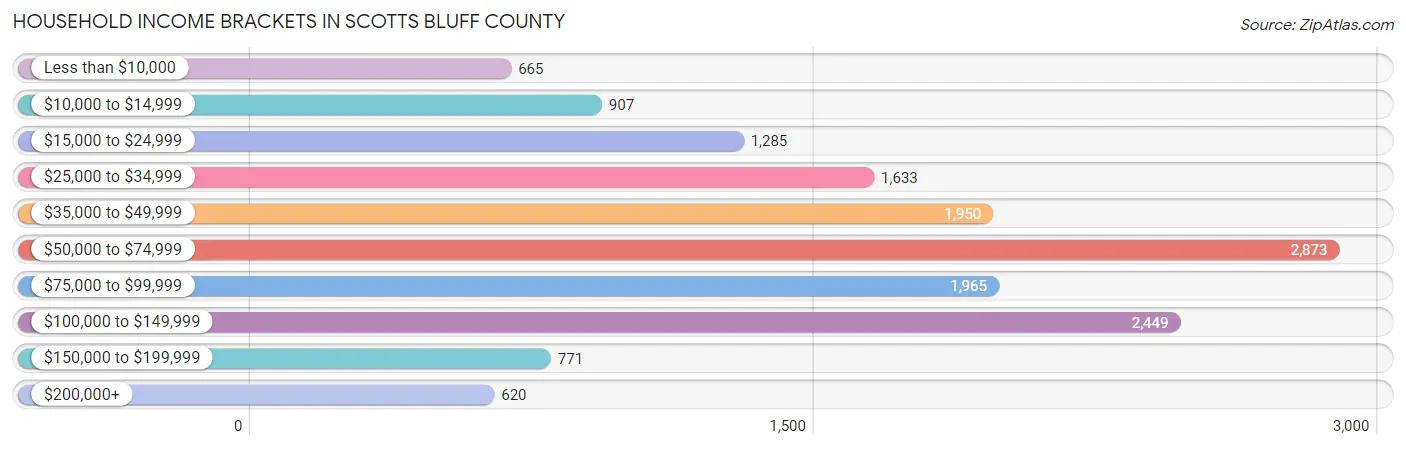
| Income Bracket | # Households | % Households |
| Less than $10,000 | 665 | 4.4% |
| $10,000 to $14,999 | 907 | 6.0% |
| $15,000 to $24,999 | 1,285 | 8.5% |
| $25,000 to $34,999 | 1,633 | 10.8% |
| $35,000 to $49,999 | 1,950 | 12.9% |
| $50,000 to $74,999 | 2,873 | 19.0% |
| $75,000 to $99,999 | 1,965 | 13.0% |
| $100,000 to $149,999 | 2,449 | 16.2% |
| $150,000 to $199,999 | 771 | 5.1% |
| $200,000+ | 620 | 4.1% |
Household Income by Householder Age in Scotts Bluff County
The median household income in Scotts Bluff County is $60,137, with the highest median household income of $75,489 found in the 25 to 44 years age bracket for the primary householder. A total of 4,525 households (29.9%) fall into this category. Meanwhile, the 65+ years age bracket for the primary householder has the lowest median household income of $43,698, with 4,625 households (30.6%) in this group.
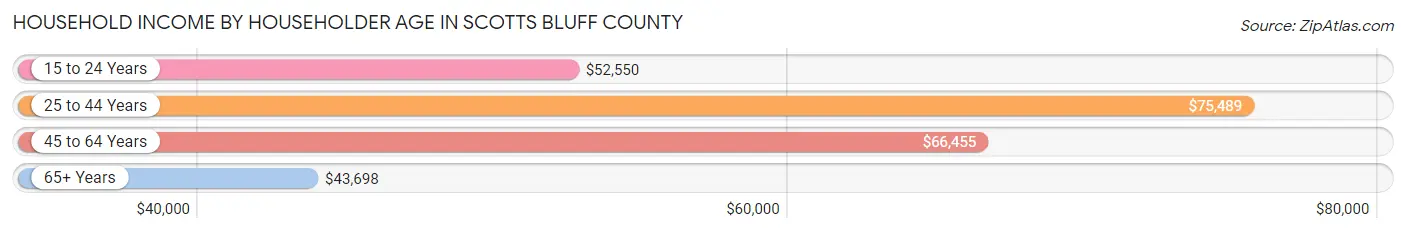
| Income Bracket | # Households | Median Income |
| 15 to 24 Years | 899 (5.9%) | $52,550 |
| 25 to 44 Years | 4,525 (29.9%) | $75,489 |
| 45 to 64 Years | 5,070 (33.5%) | $66,455 |
| 65+ Years | 4,625 (30.6%) | $43,698 |
| Total | 15,119 (100.0%) | $60,137 |
Poverty in Scotts Bluff County
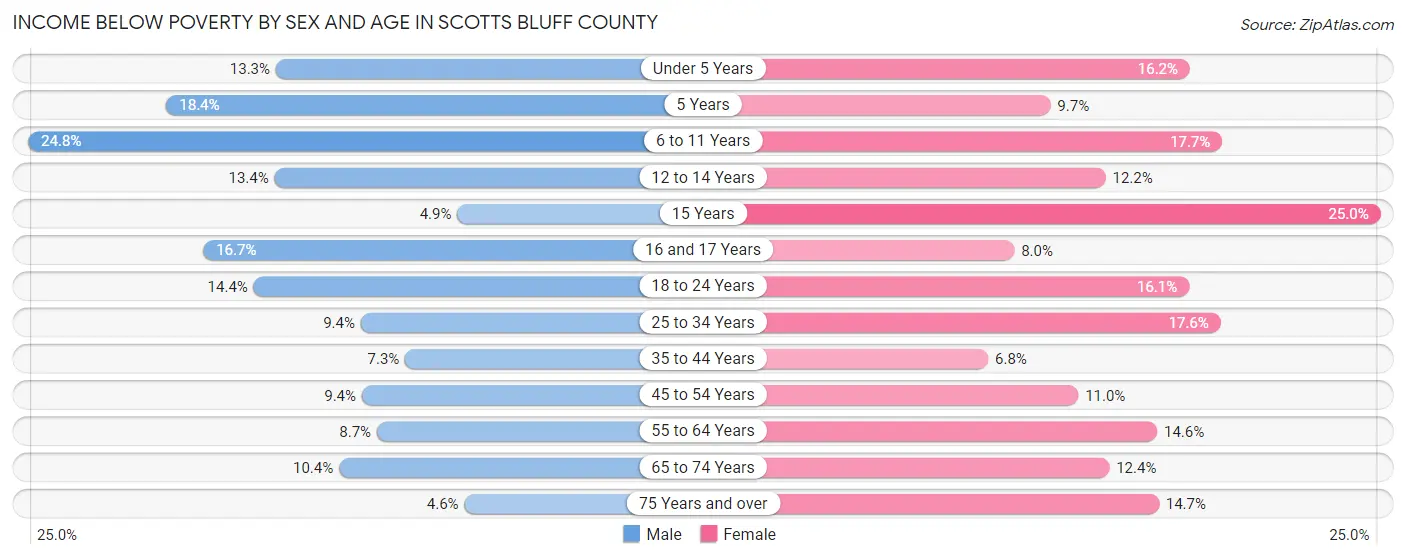
Income Below Poverty by Sex and Age in Scotts Bluff County
With 11.4% poverty level for males and 13.5% for females among the residents of Scotts Bluff County, 6 to 11 year old males and 15 year old females are the most vulnerable to poverty, with 392 males (24.8%) and 43 females (25.0%) in their respective age groups living below the poverty level.
| Age Bracket | Male | Female |
| Under 5 Years | 147 (13.3%) | 168 (16.2%) |
| 5 Years | 49 (18.4%) | 24 (9.7%) |
| 6 to 11 Years | 392 (24.8%) | 246 (17.6%) |
| 12 to 14 Years | 91 (13.4%) | 108 (12.2%) |
| 15 Years | 15 (4.9%) | 43 (25.0%) |
| 16 and 17 Years | 71 (16.7%) | 48 (8.0%) |
| 18 to 24 Years | 209 (14.4%) | 218 (16.1%) |
| 25 to 34 Years | 199 (9.4%) | 374 (17.6%) |
| 35 to 44 Years | 151 (7.3%) | 144 (6.8%) |
| 45 to 54 Years | 174 (9.3%) | 215 (11.0%) |
| 55 to 64 Years | 196 (8.6%) | 339 (14.6%) |
| 65 to 74 Years | 192 (10.4%) | 266 (12.4%) |
| 75 Years and over | 51 (4.6%) | 249 (14.7%) |
| Total | 1,937 (11.4%) | 2,442 (13.5%) |
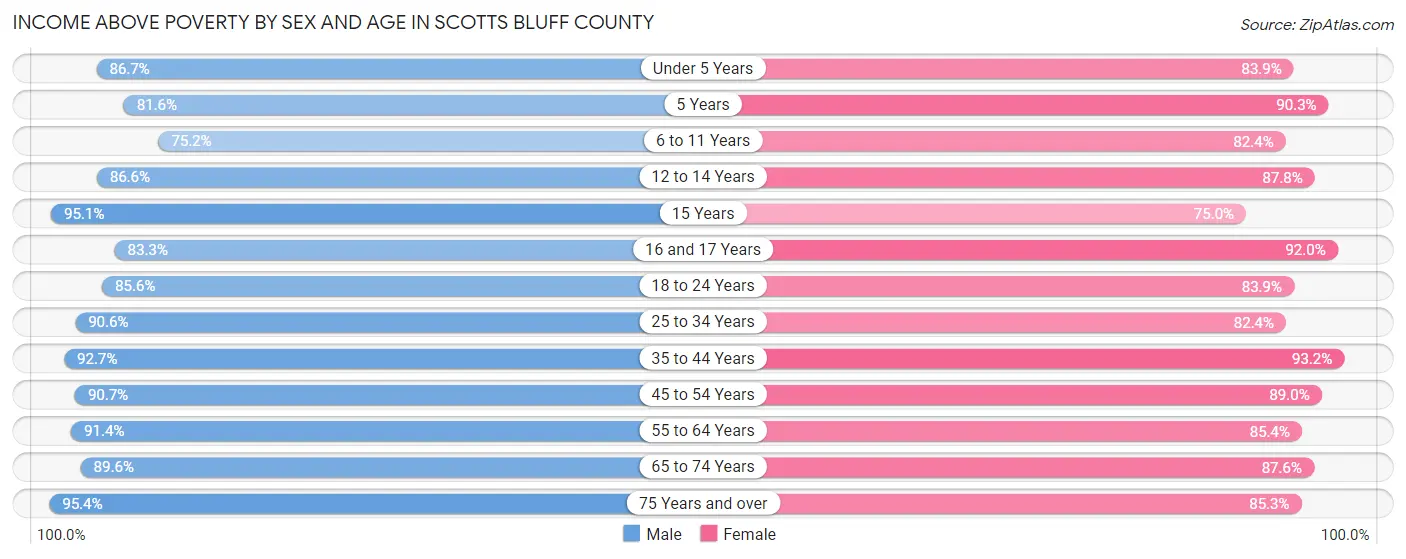
Income Above Poverty by Sex and Age in Scotts Bluff County
According to the poverty statistics in Scotts Bluff County, males aged 75 years and over and females aged 35 to 44 years are the age groups that are most secure financially, with 95.4% of males and 93.2% of females in these age groups living above the poverty line.
| Age Bracket | Male | Female |
| Under 5 Years | 955 (86.7%) | 872 (83.9%) |
| 5 Years | 217 (81.6%) | 224 (90.3%) |
| 6 to 11 Years | 1,186 (75.2%) | 1,148 (82.4%) |
| 12 to 14 Years | 588 (86.6%) | 774 (87.8%) |
| 15 Years | 290 (95.1%) | 129 (75.0%) |
| 16 and 17 Years | 354 (83.3%) | 552 (92.0%) |
| 18 to 24 Years | 1,245 (85.6%) | 1,135 (83.9%) |
| 25 to 34 Years | 1,917 (90.6%) | 1,754 (82.4%) |
| 35 to 44 Years | 1,905 (92.7%) | 1,976 (93.2%) |
| 45 to 54 Years | 1,686 (90.6%) | 1,745 (89.0%) |
| 55 to 64 Years | 2,071 (91.3%) | 1,978 (85.4%) |
| 65 to 74 Years | 1,652 (89.6%) | 1,878 (87.6%) |
| 75 Years and over | 1,059 (95.4%) | 1,444 (85.3%) |
| Total | 15,125 (88.6%) | 15,609 (86.5%) |
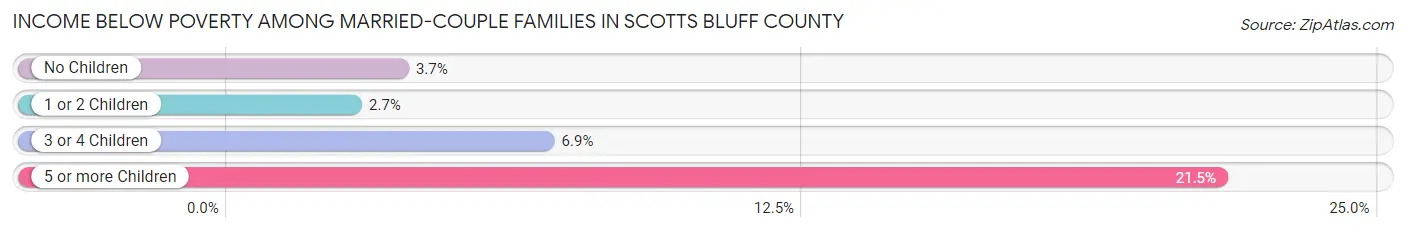
Income Below Poverty Among Married-Couple Families in Scotts Bluff County
The poverty statistics for married-couple families in Scotts Bluff County show that 3.9% or 269 of the total 6,920 families live below the poverty line. Families with 5 or more children have the highest poverty rate of 21.5%, comprising of 14 families. On the other hand, families with 1 or 2 children have the lowest poverty rate of 2.7%, which includes 57 families.
| Children | Above Poverty | Below Poverty |
| No Children | 3,910 (96.3%) | 151 (3.7%) |
| 1 or 2 Children | 2,055 (97.3%) | 57 (2.7%) |
| 3 or 4 Children | 635 (93.1%) | 47 (6.9%) |
| 5 or more Children | 51 (78.5%) | 14 (21.5%) |
| Total | 6,651 (96.1%) | 269 (3.9%) |
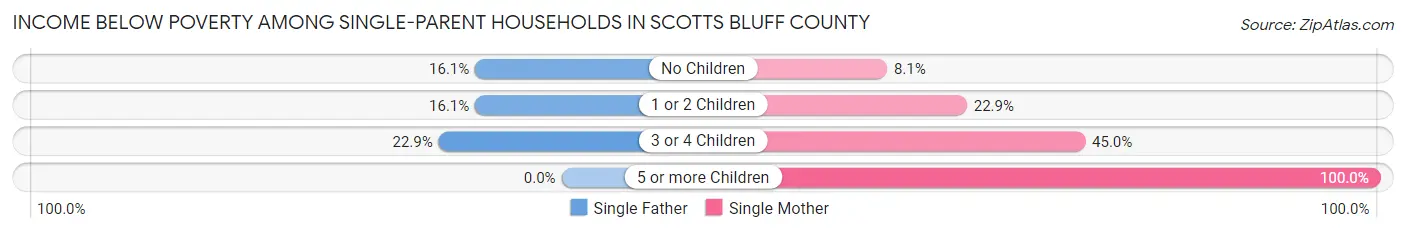
Income Below Poverty Among Single-Parent Households in Scotts Bluff County
According to the poverty data in Scotts Bluff County, 16.7% or 159 single-father households and 26.3% or 404 single-mother households are living below the poverty line. Among single-father households, those with 3 or 4 children have the highest poverty rate, with 19 households (22.9%) experiencing poverty. Likewise, among single-mother households, those with 5 or more children have the highest poverty rate, with 120 households (100.0%) falling below the poverty line.
| Children | Single Father | Single Mother |
| No Children | 37 (16.1%) | 40 (8.1%) |
| 1 or 2 Children | 103 (16.1%) | 177 (22.9%) |
| 3 or 4 Children | 19 (22.9%) | 67 (45.0%) |
| 5 or more Children | 0 (0.0%) | 120 (100.0%) |
| Total | 159 (16.7%) | 404 (26.3%) |
Income Below Poverty Among Married-Couple vs Single-Parent Households in Scotts Bluff County
The poverty data for Scotts Bluff County shows that 269 of the married-couple family households (3.9%) and 563 of the single-parent households (22.6%) are living below the poverty level. Within the married-couple family households, those with 5 or more children have the highest poverty rate, with 14 households (21.5%) falling below the poverty line. Among the single-parent households, those with 5 or more children have the highest poverty rate, with 120 household (100.0%) living below poverty.
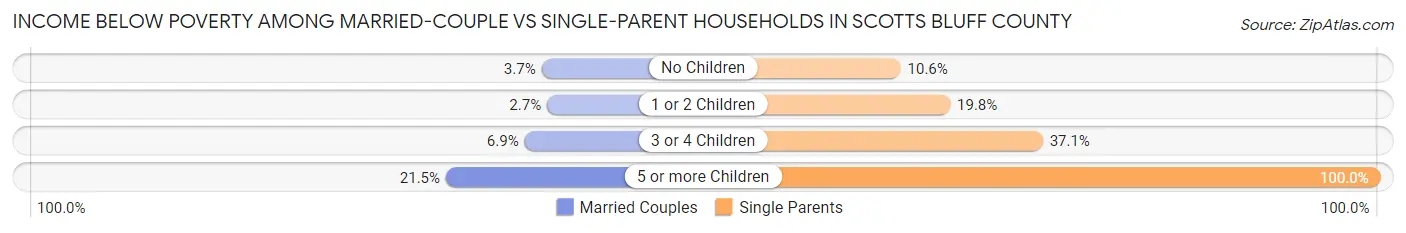
| Children | Married-Couple Families | Single-Parent Households |
| No Children | 151 (3.7%) | 77 (10.6%) |
| 1 or 2 Children | 57 (2.7%) | 280 (19.8%) |
| 3 or 4 Children | 47 (6.9%) | 86 (37.1%) |
| 5 or more Children | 14 (21.5%) | 120 (100.0%) |
| Total | 269 (3.9%) | 563 (22.6%) |
Employment Characteristics in Scotts Bluff County
Employment by Class of Employer in Scotts Bluff County
Among the 16,964 employed individuals in Scotts Bluff County, private company employees (10,550 | 62.2%), local government employees (1,569 | 9.2%), and not-for-profit organizations (1,517 | 8.9%) make up the most common classes of employment.
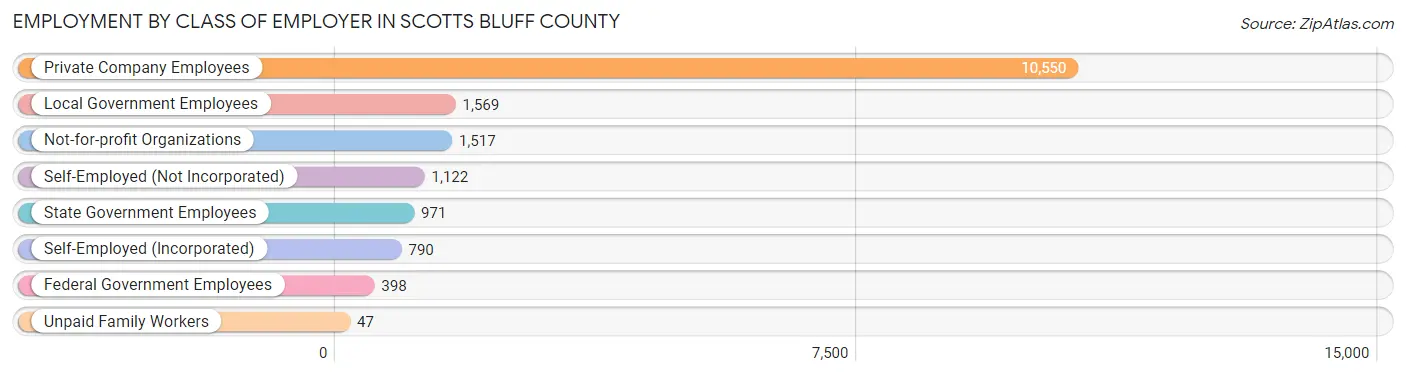
| Employer Class | # Employees | % Employees |
| Private Company Employees | 10,550 | 62.2% |
| Self-Employed (Incorporated) | 790 | 4.7% |
| Self-Employed (Not Incorporated) | 1,122 | 6.6% |
| Not-for-profit Organizations | 1,517 | 8.9% |
| Local Government Employees | 1,569 | 9.2% |
| State Government Employees | 971 | 5.7% |
| Federal Government Employees | 398 | 2.4% |
| Unpaid Family Workers | 47 | 0.3% |
| Total | 16,964 | 100.0% |
Employment Status by Age in Scotts Bluff County
According to the labor force statistics for Scotts Bluff County, out of the total population over 16 years of age (28,219), 64.0% or 18,060 individuals are in the labor force, with 3.5% or 632 of them unemployed. The age group with the highest labor force participation rate is 30 to 34 years, with 88.5% or 1,920 individuals in the labor force. Within the labor force, the 16 to 19 years age range has the highest percentage of unemployed individuals, with 12.5% or 102 of them being unemployed.
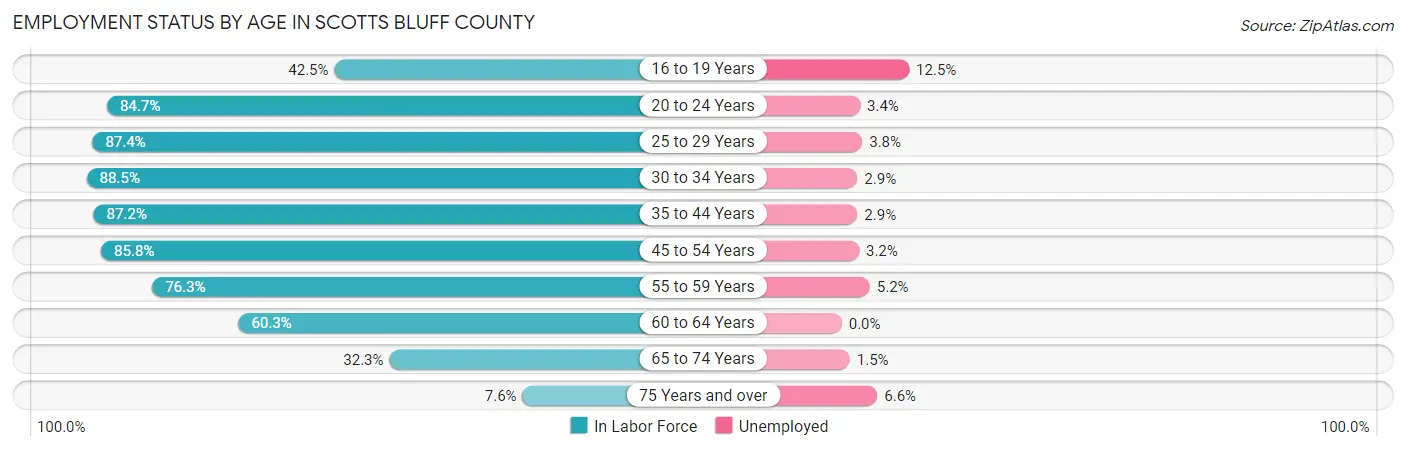
| Age Bracket | In Labor Force | Unemployed |
| 16 to 19 Years | 817 (42.5%) | 102 (12.5%) |
| 20 to 24 Years | 1,775 (84.7%) | 60 (3.4%) |
| 25 to 29 Years | 1,882 (87.4%) | 72 (3.8%) |
| 30 to 34 Years | 1,920 (88.5%) | 56 (2.9%) |
| 35 to 44 Years | 3,682 (87.2%) | 107 (2.9%) |
| 45 to 54 Years | 3,313 (85.8%) | 106 (3.2%) |
| 55 to 59 Years | 1,695 (76.3%) | 88 (5.2%) |
| 60 to 64 Years | 1,438 (60.3%) | 0 (0.0%) |
| 65 to 74 Years | 1,295 (32.3%) | 19 (1.5%) |
| 75 Years and over | 242 (7.6%) | 16 (6.6%) |
| Total | 18,060 (64.0%) | 632 (3.5%) |
Employment Status by Educational Attainment in Scotts Bluff County
According to labor force statistics for Scotts Bluff County, 81.9% of individuals (13,932) out of the total population between 25 and 64 years of age (17,011) are in the labor force, with 3.1% or 432 of them being unemployed. The group with the highest labor force participation rate are those with the educational attainment of bachelor's degree or higher, with 90.7% or 4,085 individuals in the labor force. Within the labor force, individuals with less than high school education have the highest percentage of unemployment, with 8.2% or 92 of them being unemployed.
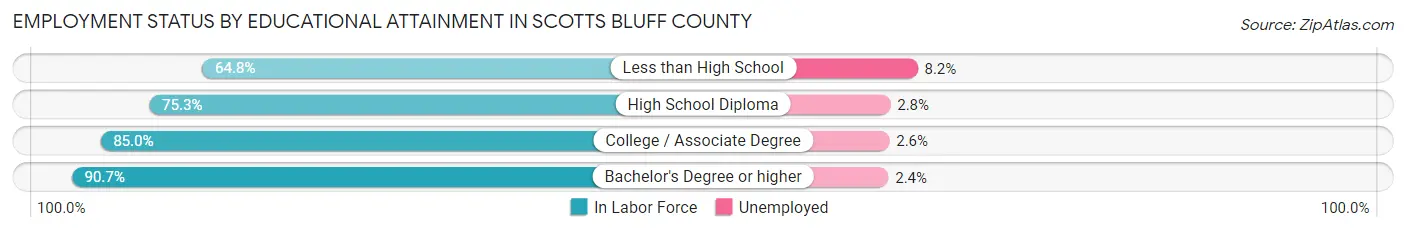
| Educational Attainment | In Labor Force | Unemployed |
| Less than High School | 1,120 (64.8%) | 142 (8.2%) |
| High School Diploma | 3,440 (75.3%) | 128 (2.8%) |
| College / Associate Degree | 5,278 (85.0%) | 161 (2.6%) |
| Bachelor's Degree or higher | 4,085 (90.7%) | 108 (2.4%) |
| Total | 13,932 (81.9%) | 527 (3.1%) |
Employment Occupations by Sex in Scotts Bluff County
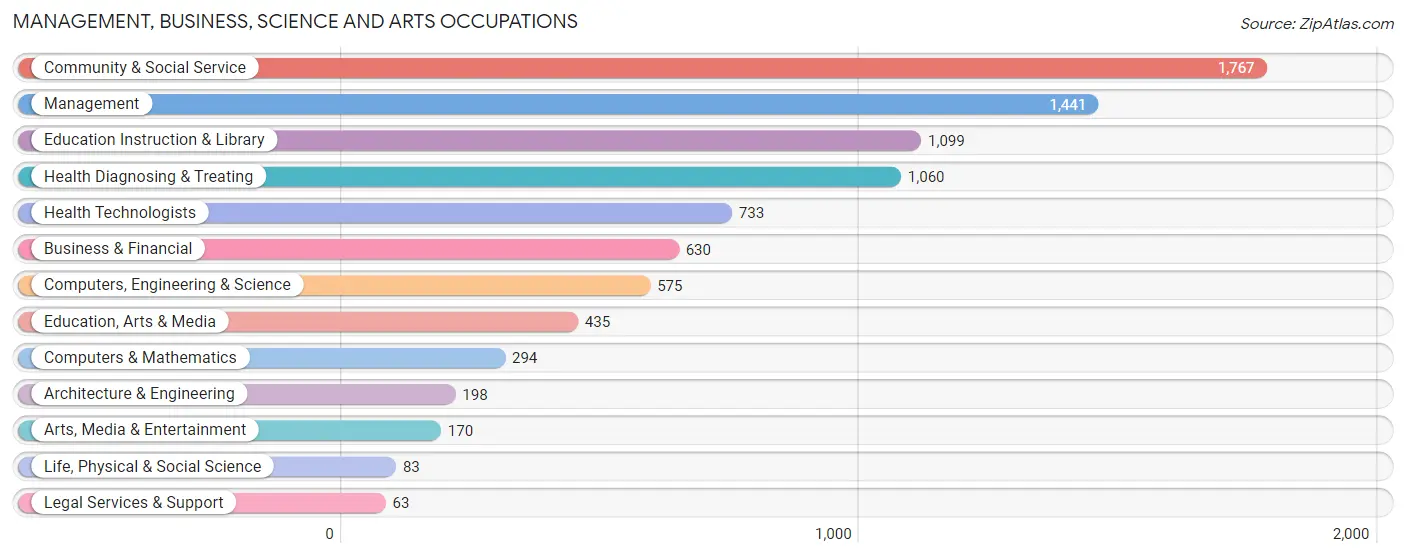
Management, Business, Science and Arts Occupations
The most common Management, Business, Science and Arts occupations in Scotts Bluff County are Community & Social Service (1,767 | 10.1%), Management (1,441 | 8.3%), Education Instruction & Library (1,099 | 6.3%), Health Diagnosing & Treating (1,060 | 6.1%), and Health Technologists (733 | 4.2%).
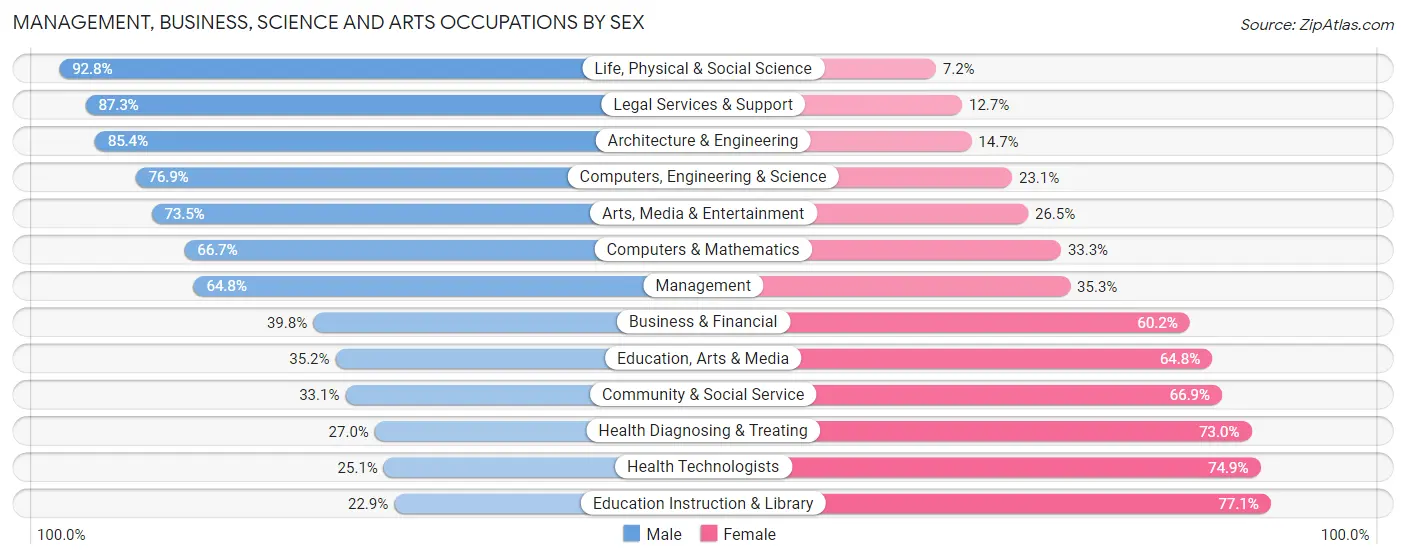
Management, Business, Science and Arts Occupations by Sex
Within the Management, Business, Science and Arts occupations in Scotts Bluff County, the most male-oriented occupations are Life, Physical & Social Science (92.8%), Legal Services & Support (87.3%), and Architecture & Engineering (85.4%), while the most female-oriented occupations are Education Instruction & Library (77.1%), Health Technologists (74.9%), and Health Diagnosing & Treating (73.0%).
| Occupation | Male | Female |
| Management | 933 (64.7%) | 508 (35.2%) |
| Business & Financial | 251 (39.8%) | 379 (60.2%) |
| Computers, Engineering & Science | 442 (76.9%) | 133 (23.1%) |
| Computers & Mathematics | 196 (66.7%) | 98 (33.3%) |
| Architecture & Engineering | 169 (85.4%) | 29 (14.6%) |
| Life, Physical & Social Science | 77 (92.8%) | 6 (7.2%) |
| Community & Social Service | 585 (33.1%) | 1,182 (66.9%) |
| Education, Arts & Media | 153 (35.2%) | 282 (64.8%) |
| Legal Services & Support | 55 (87.3%) | 8 (12.7%) |
| Education Instruction & Library | 252 (22.9%) | 847 (77.1%) |
| Arts, Media & Entertainment | 125 (73.5%) | 45 (26.5%) |
| Health Diagnosing & Treating | 286 (27.0%) | 774 (73.0%) |
| Health Technologists | 184 (25.1%) | 549 (74.9%) |
| Total (Category) | 2,497 (45.6%) | 2,976 (54.4%) |
| Total (Overall) | 9,029 (51.8%) | 8,389 (48.2%) |
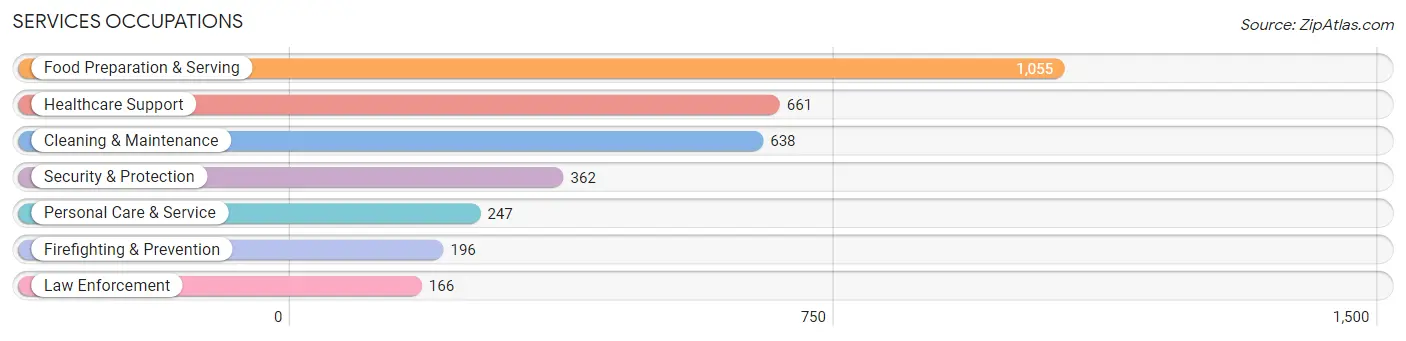
Services Occupations
The most common Services occupations in Scotts Bluff County are Food Preparation & Serving (1,055 | 6.1%), Healthcare Support (661 | 3.8%), Cleaning & Maintenance (638 | 3.7%), Security & Protection (362 | 2.1%), and Personal Care & Service (247 | 1.4%).
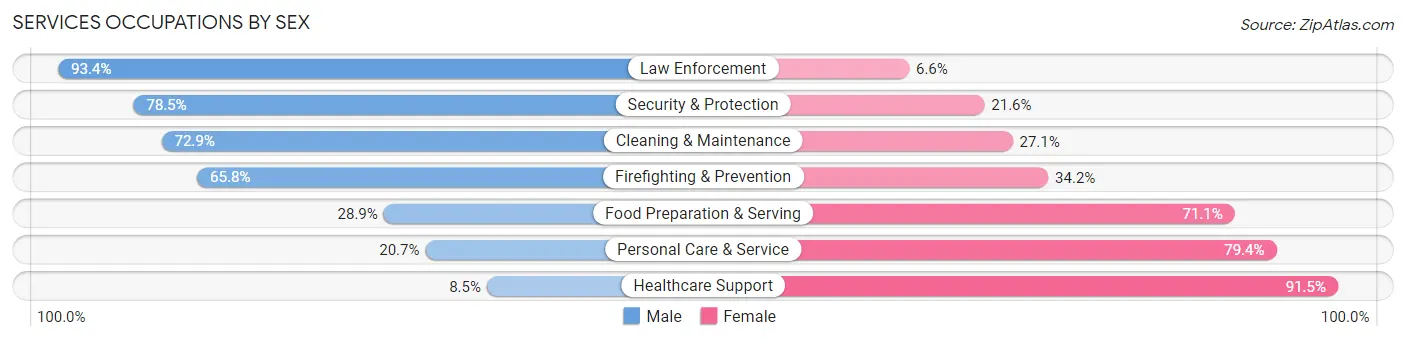
Services Occupations by Sex
Within the Services occupations in Scotts Bluff County, the most male-oriented occupations are Law Enforcement (93.4%), Security & Protection (78.4%), and Cleaning & Maintenance (72.9%), while the most female-oriented occupations are Healthcare Support (91.5%), Personal Care & Service (79.3%), and Food Preparation & Serving (71.1%).
| Occupation | Male | Female |
| Healthcare Support | 56 (8.5%) | 605 (91.5%) |
| Security & Protection | 284 (78.4%) | 78 (21.5%) |
| Firefighting & Prevention | 129 (65.8%) | 67 (34.2%) |
| Law Enforcement | 155 (93.4%) | 11 (6.6%) |
| Food Preparation & Serving | 305 (28.9%) | 750 (71.1%) |
| Cleaning & Maintenance | 465 (72.9%) | 173 (27.1%) |
| Personal Care & Service | 51 (20.6%) | 196 (79.3%) |
| Total (Category) | 1,161 (39.2%) | 1,802 (60.8%) |
| Total (Overall) | 9,029 (51.8%) | 8,389 (48.2%) |
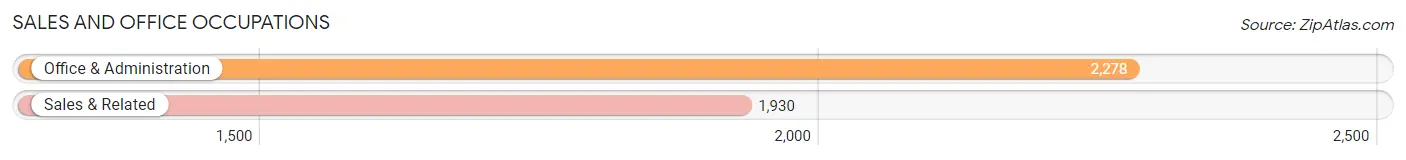
Sales and Office Occupations
The most common Sales and Office occupations in Scotts Bluff County are Office & Administration (2,278 | 13.1%), and Sales & Related (1,930 | 11.1%).
Sales and Office Occupations by Sex
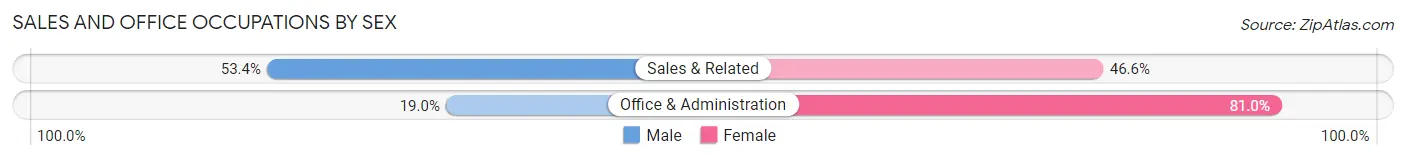
| Occupation | Male | Female |
| Sales & Related | 1,031 (53.4%) | 899 (46.6%) |
| Office & Administration | 433 (19.0%) | 1,845 (81.0%) |
| Total (Category) | 1,464 (34.8%) | 2,744 (65.2%) |
| Total (Overall) | 9,029 (51.8%) | 8,389 (48.2%) |
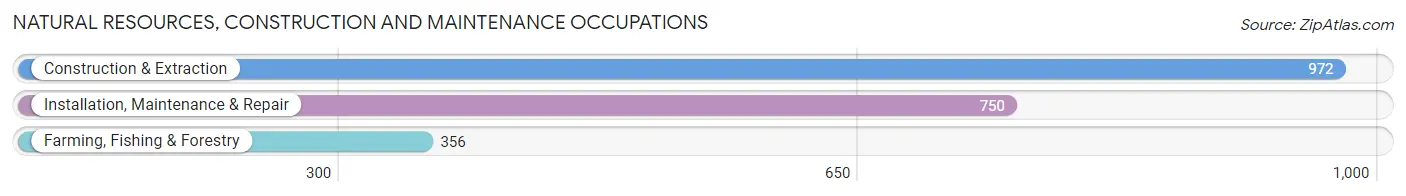
Natural Resources, Construction and Maintenance Occupations
The most common Natural Resources, Construction and Maintenance occupations in Scotts Bluff County are Construction & Extraction (972 | 5.6%), Installation, Maintenance & Repair (750 | 4.3%), and Farming, Fishing & Forestry (356 | 2.0%).
Natural Resources, Construction and Maintenance Occupations by Sex
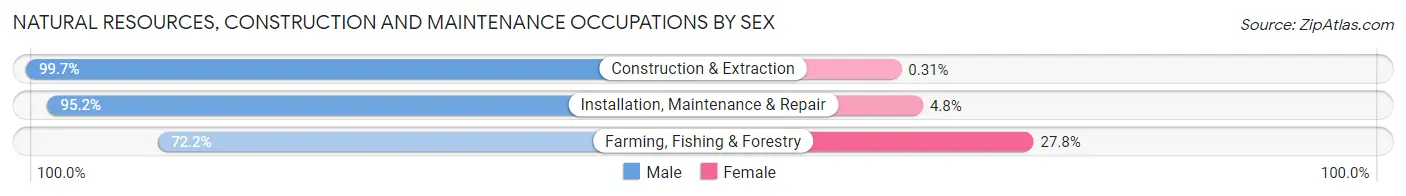
| Occupation | Male | Female |
| Farming, Fishing & Forestry | 257 (72.2%) | 99 (27.8%) |
| Construction & Extraction | 969 (99.7%) | 3 (0.3%) |
| Installation, Maintenance & Repair | 714 (95.2%) | 36 (4.8%) |
| Total (Category) | 1,940 (93.4%) | 138 (6.6%) |
| Total (Overall) | 9,029 (51.8%) | 8,389 (48.2%) |
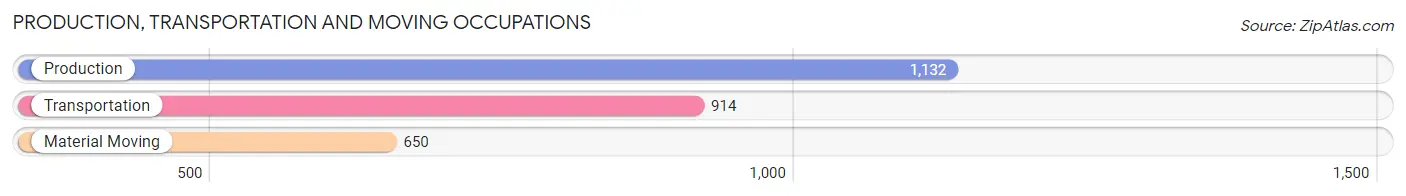
Production, Transportation and Moving Occupations
The most common Production, Transportation and Moving occupations in Scotts Bluff County are Production (1,132 | 6.5%), Transportation (914 | 5.2%), and Material Moving (650 | 3.7%).
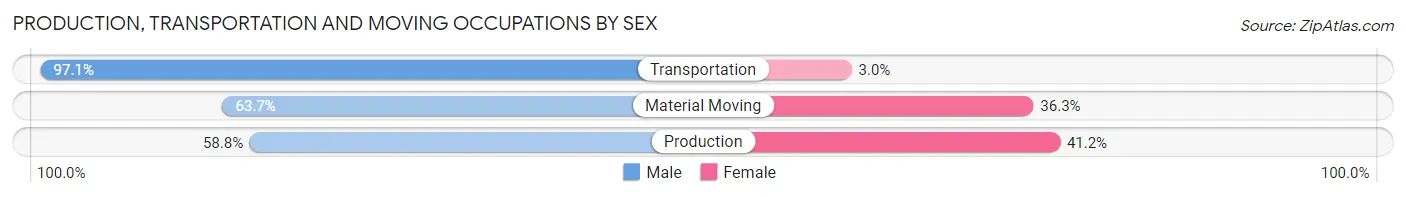
Production, Transportation and Moving Occupations by Sex
| Occupation | Male | Female |
| Production | 666 (58.8%) | 466 (41.2%) |
| Transportation | 887 (97.1%) | 27 (2.9%) |
| Material Moving | 414 (63.7%) | 236 (36.3%) |
| Total (Category) | 1,967 (73.0%) | 729 (27.0%) |
| Total (Overall) | 9,029 (51.8%) | 8,389 (48.2%) |
Employment Industries by Sex in Scotts Bluff County
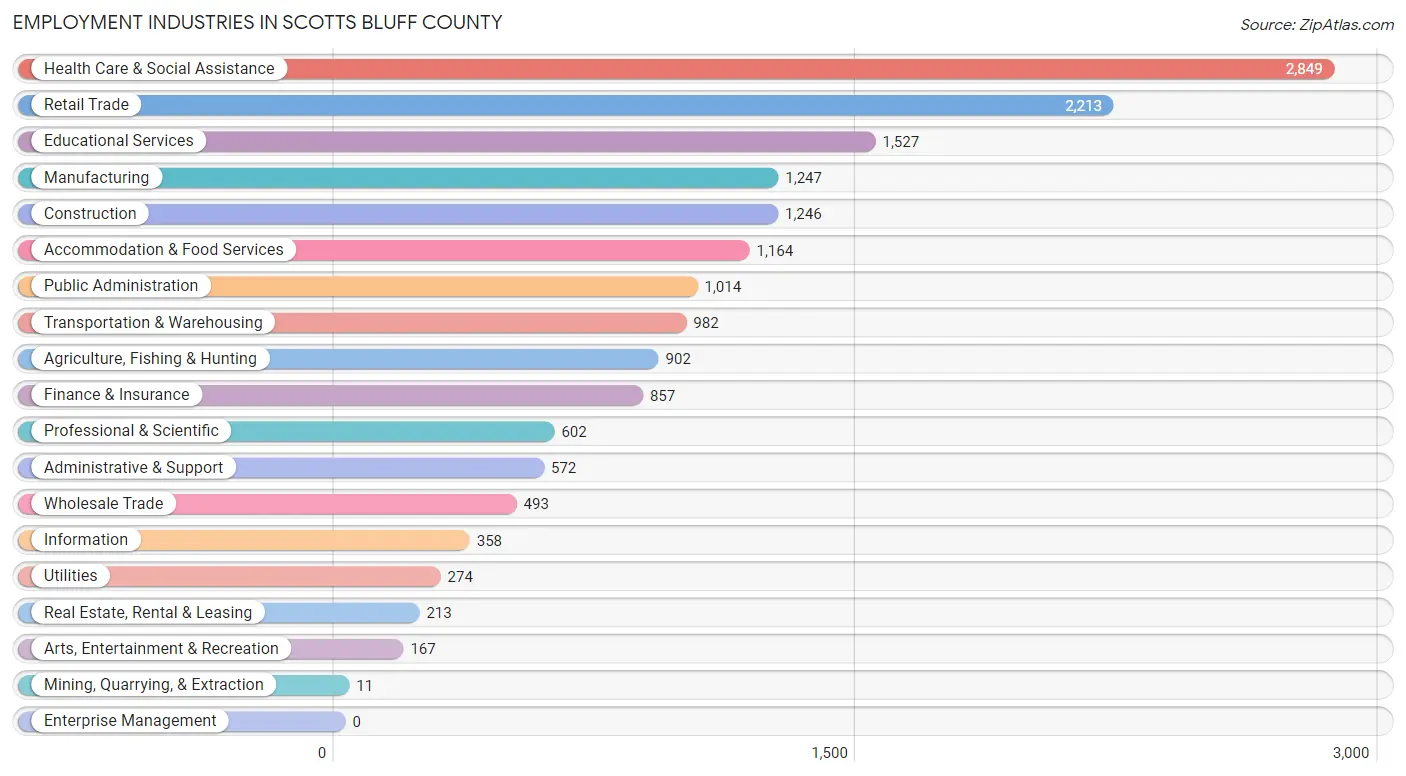
Employment Industries in Scotts Bluff County
The major employment industries in Scotts Bluff County include Health Care & Social Assistance (2,849 | 16.4%), Retail Trade (2,213 | 12.7%), Educational Services (1,527 | 8.8%), Manufacturing (1,247 | 7.2%), and Construction (1,246 | 7.1%).
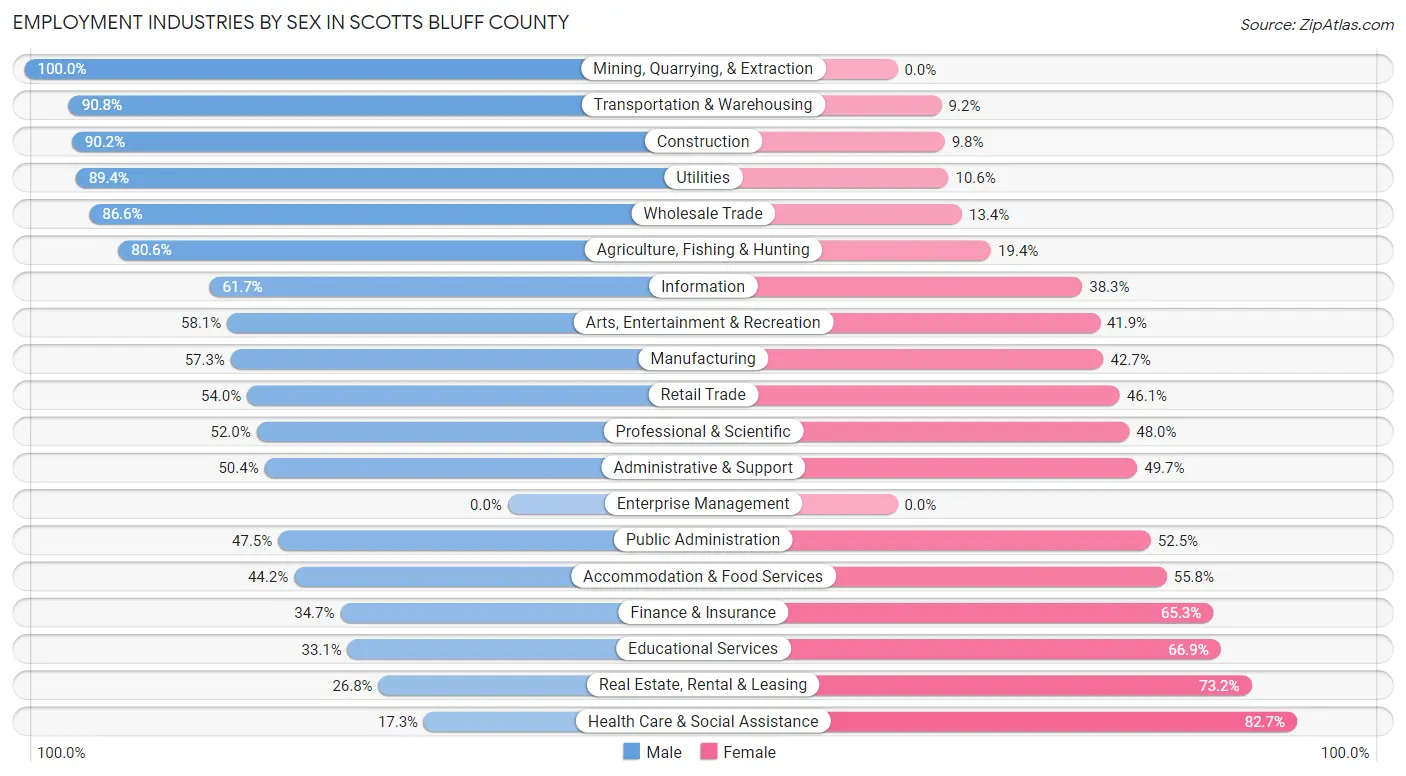
Employment Industries by Sex in Scotts Bluff County
The Scotts Bluff County industries that see more men than women are Mining, Quarrying, & Extraction (100.0%), Transportation & Warehousing (90.8%), and Construction (90.2%), whereas the industries that tend to have a higher number of women are Health Care & Social Assistance (82.7%), Real Estate, Rental & Leasing (73.2%), and Educational Services (66.9%).
| Industry | Male | Female |
| Agriculture, Fishing & Hunting | 727 (80.6%) | 175 (19.4%) |
| Mining, Quarrying, & Extraction | 11 (100.0%) | 0 (0.0%) |
| Construction | 1,124 (90.2%) | 122 (9.8%) |
| Manufacturing | 715 (57.3%) | 532 (42.7%) |
| Wholesale Trade | 427 (86.6%) | 66 (13.4%) |
| Retail Trade | 1,194 (53.9%) | 1,019 (46.1%) |
| Transportation & Warehousing | 892 (90.8%) | 90 (9.2%) |
| Utilities | 245 (89.4%) | 29 (10.6%) |
| Information | 221 (61.7%) | 137 (38.3%) |
| Finance & Insurance | 297 (34.7%) | 560 (65.3%) |
| Real Estate, Rental & Leasing | 57 (26.8%) | 156 (73.2%) |
| Professional & Scientific | 313 (52.0%) | 289 (48.0%) |
| Enterprise Management | 0 (0.0%) | 0 (0.0%) |
| Administrative & Support | 288 (50.3%) | 284 (49.6%) |
| Educational Services | 506 (33.1%) | 1,021 (66.9%) |
| Health Care & Social Assistance | 494 (17.3%) | 2,355 (82.7%) |
| Arts, Entertainment & Recreation | 97 (58.1%) | 70 (41.9%) |
| Accommodation & Food Services | 515 (44.2%) | 649 (55.8%) |
| Public Administration | 482 (47.5%) | 532 (52.5%) |
| Total | 9,029 (51.8%) | 8,389 (48.2%) |
Education in Scotts Bluff County
School Enrollment in Scotts Bluff County
The most common levels of schooling among the 9,067 students in Scotts Bluff County are elementary school (2,269 | 25.0%), middle school (2,165 | 23.9%), and high school (1,854 | 20.4%).
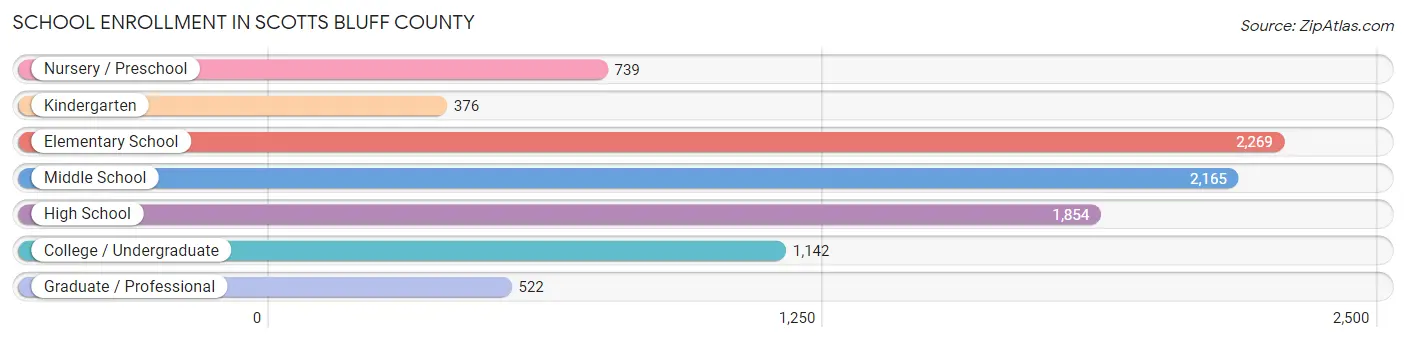
| School Level | # Students | % Students |
| Nursery / Preschool | 739 | 8.2% |
| Kindergarten | 376 | 4.2% |
| Elementary School | 2,269 | 25.0% |
| Middle School | 2,165 | 23.9% |
| High School | 1,854 | 20.4% |
| College / Undergraduate | 1,142 | 12.6% |
| Graduate / Professional | 522 | 5.8% |
| Total | 9,067 | 100.0% |
School Enrollment by Age by Funding Source in Scotts Bluff County
Out of a total of 9,067 students who are enrolled in schools in Scotts Bluff County, 1,351 (14.9%) attend a private institution, while the remaining 7,716 (85.1%) are enrolled in public schools. The age group of 3 to 4 year olds has the highest likelihood of being enrolled in private schools, with 229 (46.5% in the age bracket) enrolled. Conversely, the age group of 15 to 17 year olds has the lowest likelihood of being enrolled in a private school, with 1,424 (94.4% in the age bracket) attending a public institution.
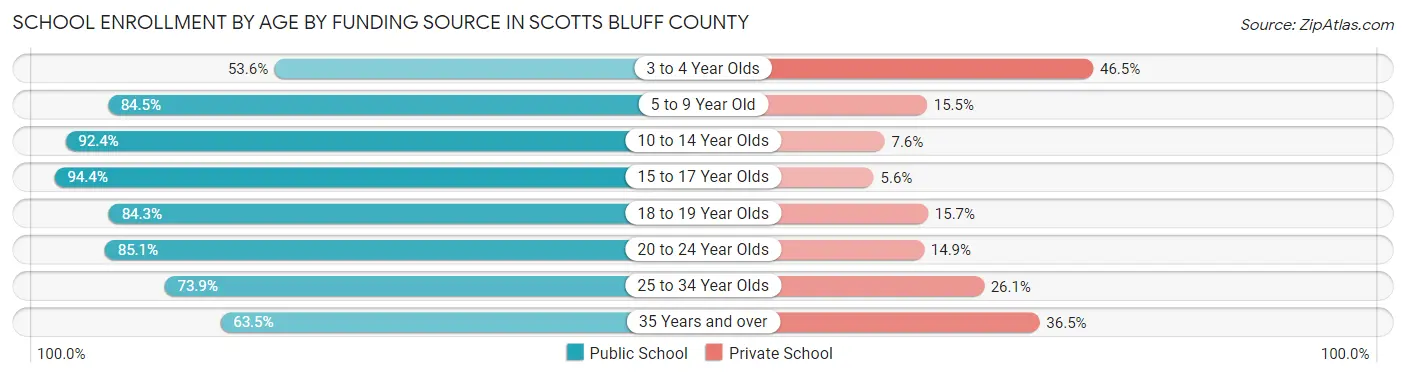
| Age Bracket | Public School | Private School |
| 3 to 4 Year Olds | 264 (53.5%) | 229 (46.5%) |
| 5 to 9 Year Old | 2,209 (84.5%) | 405 (15.5%) |
| 10 to 14 Year Olds | 2,270 (92.4%) | 187 (7.6%) |
| 15 to 17 Year Olds | 1,424 (94.4%) | 84 (5.6%) |
| 18 to 19 Year Olds | 511 (84.3%) | 95 (15.7%) |
| 20 to 24 Year Olds | 427 (85.1%) | 75 (14.9%) |
| 25 to 34 Year Olds | 309 (73.9%) | 109 (26.1%) |
| 35 Years and over | 298 (63.5%) | 171 (36.5%) |
| Total | 7,716 (85.1%) | 1,351 (14.9%) |
Educational Attainment by Field of Study in Scotts Bluff County
Education (1,448 | 22.0%), business (1,173 | 17.8%), science & technology (763 | 11.6%), bio, nature & agricultural (750 | 11.4%), and arts & humanities (620 | 9.4%) are the most common fields of study among 6,597 individuals in Scotts Bluff County who have obtained a bachelor's degree or higher.
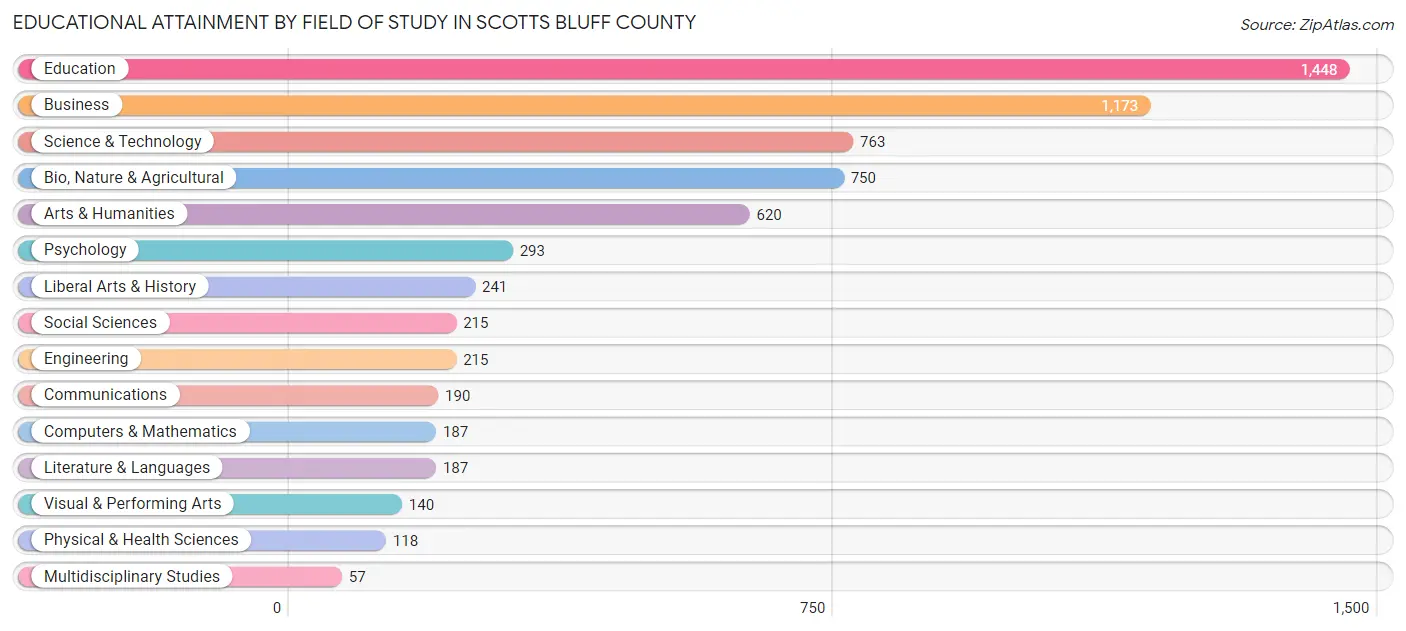
| Field of Study | # Graduates | % Graduates |
| Computers & Mathematics | 187 | 2.8% |
| Bio, Nature & Agricultural | 750 | 11.4% |
| Physical & Health Sciences | 118 | 1.8% |
| Psychology | 293 | 4.4% |
| Social Sciences | 215 | 3.3% |
| Engineering | 215 | 3.3% |
| Multidisciplinary Studies | 57 | 0.9% |
| Science & Technology | 763 | 11.6% |
| Business | 1,173 | 17.8% |
| Education | 1,448 | 22.0% |
| Literature & Languages | 187 | 2.8% |
| Liberal Arts & History | 241 | 3.6% |
| Visual & Performing Arts | 140 | 2.1% |
| Communications | 190 | 2.9% |
| Arts & Humanities | 620 | 9.4% |
| Total | 6,597 | 100.0% |
Transportation & Commute in Scotts Bluff County
Vehicle Availability by Sex in Scotts Bluff County
The most prevalent vehicle ownership categories in Scotts Bluff County are males with 2 vehicles (3,611, accounting for 40.8%) and females with 2 vehicles (3,146, making up 45.0%).
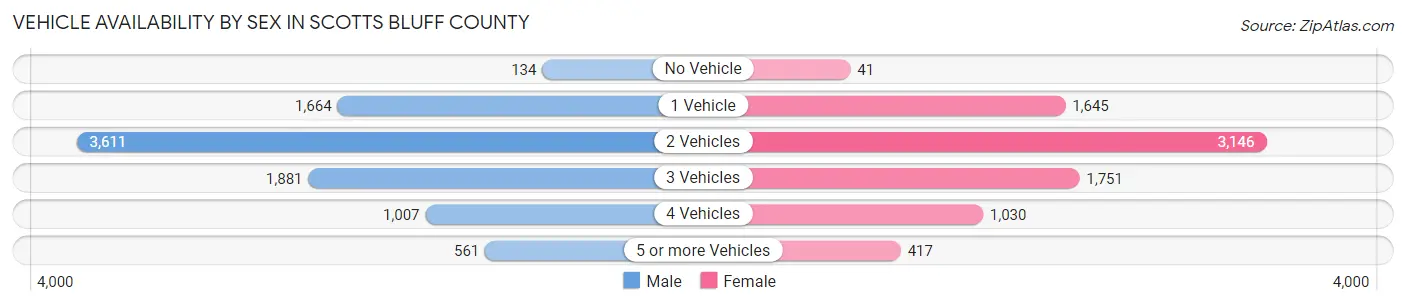
| Vehicles Available | Male | Female |
| No Vehicle | 134 (1.5%) | 41 (0.5%) |
| 1 Vehicle | 1,664 (18.8%) | 1,645 (20.5%) |
| 2 Vehicles | 3,611 (40.8%) | 3,146 (39.2%) |
| 3 Vehicles | 1,881 (21.2%) | 1,751 (21.8%) |
| 4 Vehicles | 1,007 (11.4%) | 1,030 (12.8%) |
| 5 or more Vehicles | 561 (6.3%) | 417 (5.2%) |
| Total | 8,858 (100.0%) | 8,030 (100.0%) |
Commute Time in Scotts Bluff County
The most frequently occuring commute durations in Scotts Bluff County are 5 to 9 minutes (4,647 commuters, 29.0%), 10 to 14 minutes (4,118 commuters, 25.7%), and 15 to 19 minutes (2,673 commuters, 16.7%).
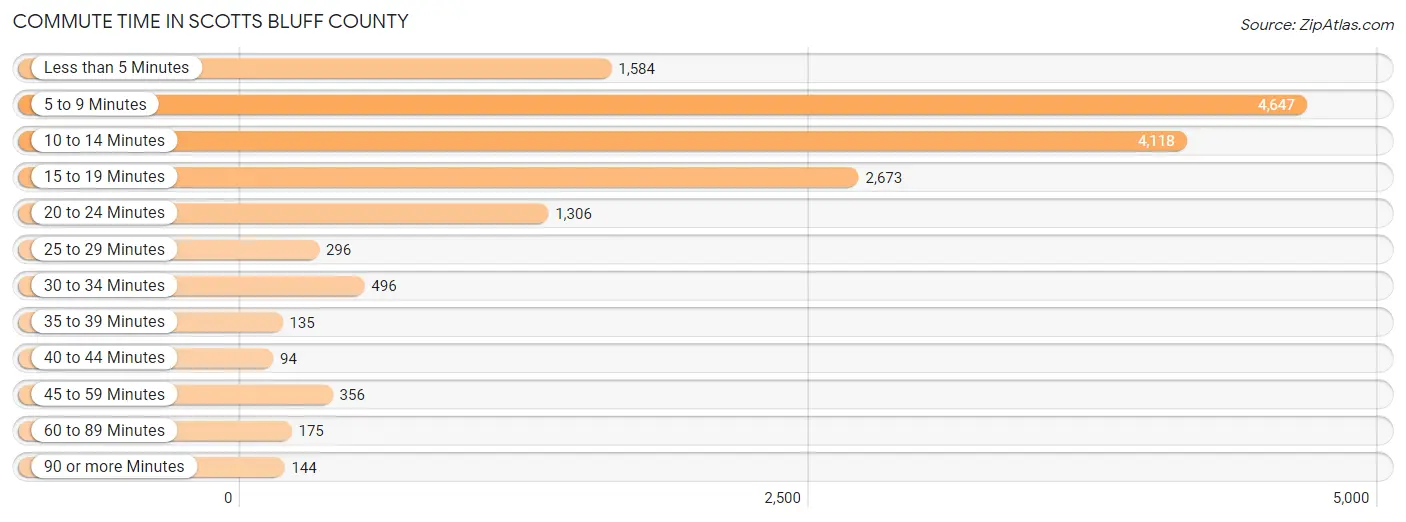
| Commute Time | # Commuters | % Commuters |
| Less than 5 Minutes | 1,584 | 9.9% |
| 5 to 9 Minutes | 4,647 | 29.0% |
| 10 to 14 Minutes | 4,118 | 25.7% |
| 15 to 19 Minutes | 2,673 | 16.7% |
| 20 to 24 Minutes | 1,306 | 8.2% |
| 25 to 29 Minutes | 296 | 1.8% |
| 30 to 34 Minutes | 496 | 3.1% |
| 35 to 39 Minutes | 135 | 0.8% |
| 40 to 44 Minutes | 94 | 0.6% |
| 45 to 59 Minutes | 356 | 2.2% |
| 60 to 89 Minutes | 175 | 1.1% |
| 90 or more Minutes | 144 | 0.9% |
Commute Time by Sex in Scotts Bluff County
The most common commute times in Scotts Bluff County are 5 to 9 minutes (2,418 commuters, 28.5%) for males and 5 to 9 minutes (2,229 commuters, 29.5%) for females.
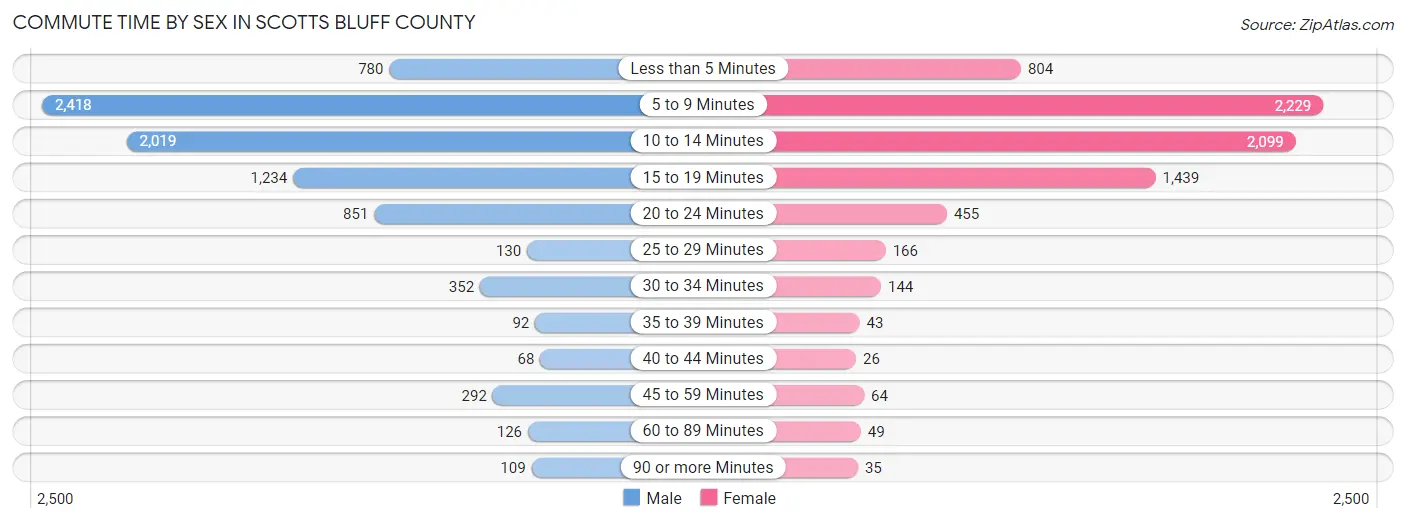
| Commute Time | Male | Female |
| Less than 5 Minutes | 780 (9.2%) | 804 (10.6%) |
| 5 to 9 Minutes | 2,418 (28.5%) | 2,229 (29.5%) |
| 10 to 14 Minutes | 2,019 (23.8%) | 2,099 (27.8%) |
| 15 to 19 Minutes | 1,234 (14.6%) | 1,439 (19.1%) |
| 20 to 24 Minutes | 851 (10.1%) | 455 (6.0%) |
| 25 to 29 Minutes | 130 (1.5%) | 166 (2.2%) |
| 30 to 34 Minutes | 352 (4.2%) | 144 (1.9%) |
| 35 to 39 Minutes | 92 (1.1%) | 43 (0.6%) |
| 40 to 44 Minutes | 68 (0.8%) | 26 (0.3%) |
| 45 to 59 Minutes | 292 (3.5%) | 64 (0.9%) |
| 60 to 89 Minutes | 126 (1.5%) | 49 (0.6%) |
| 90 or more Minutes | 109 (1.3%) | 35 (0.5%) |
Time of Departure to Work by Sex in Scotts Bluff County
The most frequent times of departure to work in Scotts Bluff County are 7:00 AM to 7:29 AM (1,619, 19.1%) for males and 7:30 AM to 7:59 AM (1,524, 20.2%) for females.
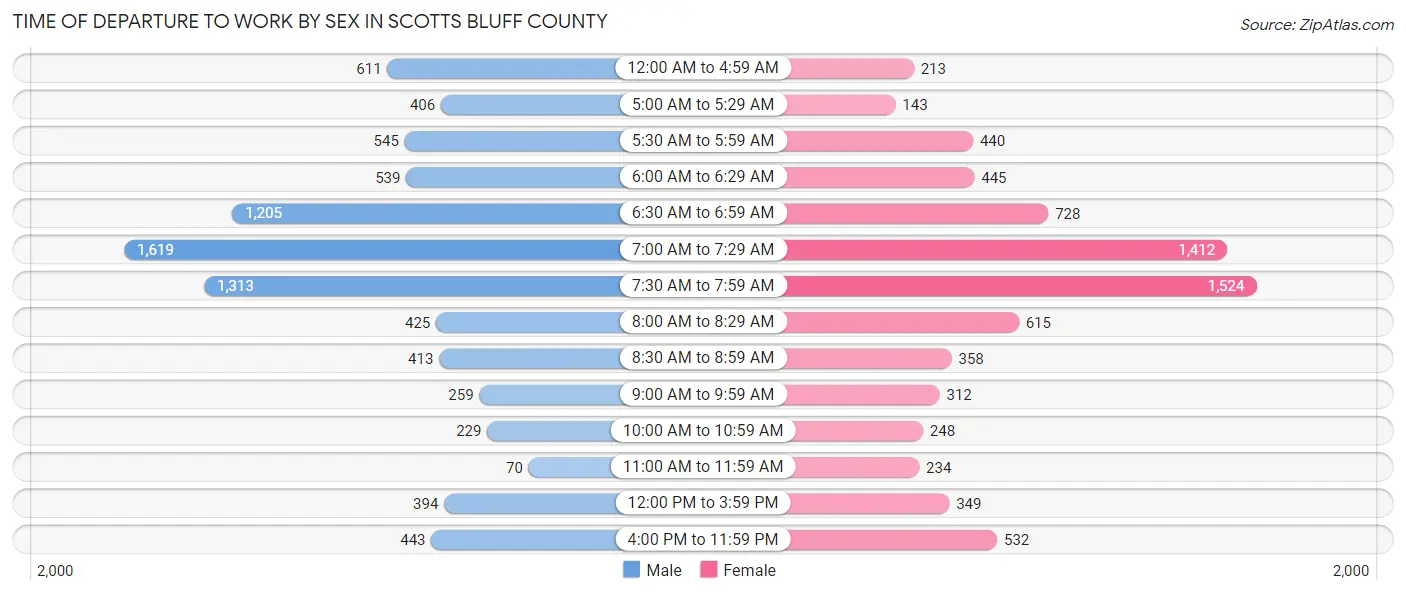
| Time of Departure | Male | Female |
| 12:00 AM to 4:59 AM | 611 (7.2%) | 213 (2.8%) |
| 5:00 AM to 5:29 AM | 406 (4.8%) | 143 (1.9%) |
| 5:30 AM to 5:59 AM | 545 (6.4%) | 440 (5.8%) |
| 6:00 AM to 6:29 AM | 539 (6.4%) | 445 (5.9%) |
| 6:30 AM to 6:59 AM | 1,205 (14.2%) | 728 (9.6%) |
| 7:00 AM to 7:29 AM | 1,619 (19.1%) | 1,412 (18.7%) |
| 7:30 AM to 7:59 AM | 1,313 (15.5%) | 1,524 (20.2%) |
| 8:00 AM to 8:29 AM | 425 (5.0%) | 615 (8.1%) |
| 8:30 AM to 8:59 AM | 413 (4.9%) | 358 (4.7%) |
| 9:00 AM to 9:59 AM | 259 (3.1%) | 312 (4.1%) |
| 10:00 AM to 10:59 AM | 229 (2.7%) | 248 (3.3%) |
| 11:00 AM to 11:59 AM | 70 (0.8%) | 234 (3.1%) |
| 12:00 PM to 3:59 PM | 394 (4.6%) | 349 (4.6%) |
| 4:00 PM to 11:59 PM | 443 (5.2%) | 532 (7.0%) |
| Total | 8,471 (100.0%) | 7,553 (100.0%) |
Housing Occupancy in Scotts Bluff County
Occupancy by Ownership in Scotts Bluff County
Of the total 15,119 dwellings in Scotts Bluff County, owner-occupied units account for 10,258 (67.8%), while renter-occupied units make up 4,861 (32.2%).
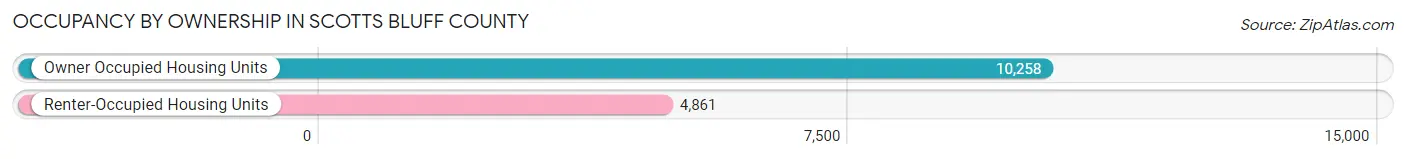
| Occupancy | # Housing Units | % Housing Units |
| Owner Occupied Housing Units | 10,258 | 67.8% |
| Renter-Occupied Housing Units | 4,861 | 32.2% |
| Total Occupied Housing Units | 15,119 | 100.0% |
Occupancy by Household Size in Scotts Bluff County
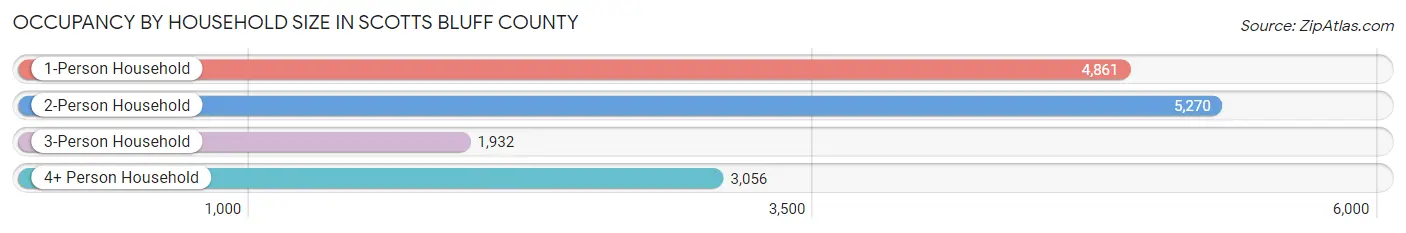
| Household Size | # Housing Units | % Housing Units |
| 1-Person Household | 4,861 | 32.2% |
| 2-Person Household | 5,270 | 34.9% |
| 3-Person Household | 1,932 | 12.8% |
| 4+ Person Household | 3,056 | 20.2% |
| Total Housing Units | 15,119 | 100.0% |
Occupancy by Ownership by Household Size in Scotts Bluff County
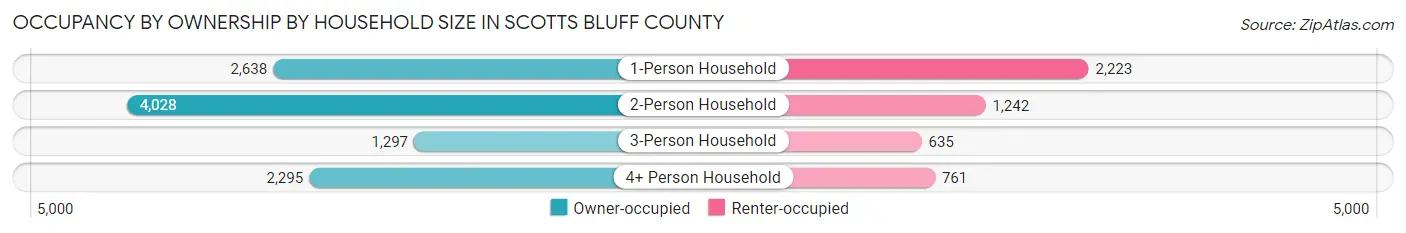
| Household Size | Owner-occupied | Renter-occupied |
| 1-Person Household | 2,638 (54.3%) | 2,223 (45.7%) |
| 2-Person Household | 4,028 (76.4%) | 1,242 (23.6%) |
| 3-Person Household | 1,297 (67.1%) | 635 (32.9%) |
| 4+ Person Household | 2,295 (75.1%) | 761 (24.9%) |
| Total Housing Units | 10,258 (67.8%) | 4,861 (32.2%) |
Occupancy by Educational Attainment in Scotts Bluff County
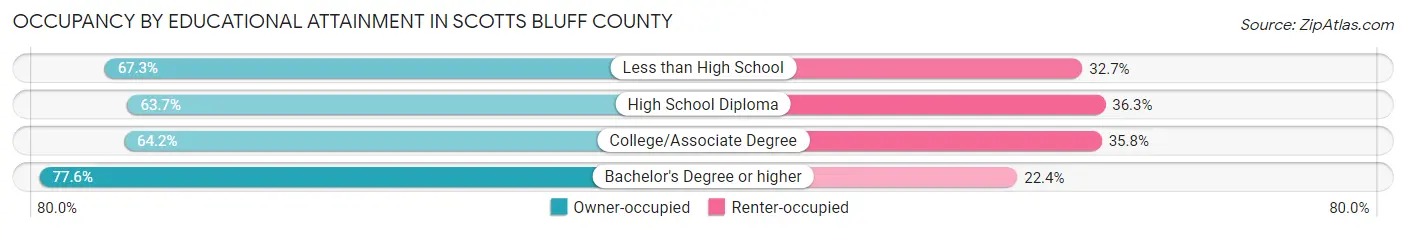
| Household Size | Owner-occupied | Renter-occupied |
| Less than High School | 897 (67.3%) | 436 (32.7%) |
| High School Diploma | 2,503 (63.7%) | 1,429 (36.3%) |
| College/Associate Degree | 3,787 (64.2%) | 2,110 (35.8%) |
| Bachelor's Degree or higher | 3,071 (77.6%) | 886 (22.4%) |
Occupancy by Age of Householder in Scotts Bluff County
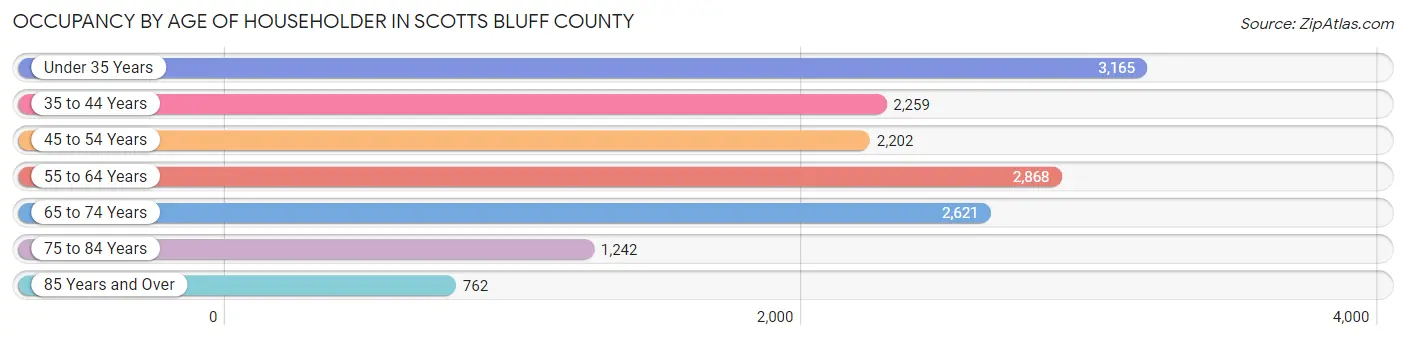
| Age Bracket | # Households | % Households |
| Under 35 Years | 3,165 | 20.9% |
| 35 to 44 Years | 2,259 | 14.9% |
| 45 to 54 Years | 2,202 | 14.6% |
| 55 to 64 Years | 2,868 | 19.0% |
| 65 to 74 Years | 2,621 | 17.3% |
| 75 to 84 Years | 1,242 | 8.2% |
| 85 Years and Over | 762 | 5.0% |
| Total | 15,119 | 100.0% |
Housing Finances in Scotts Bluff County
Median Income by Occupancy in Scotts Bluff County
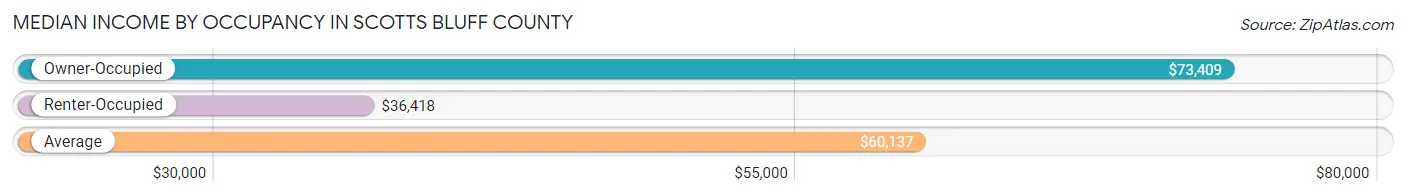
| Occupancy Type | # Households | Median Income |
| Owner-Occupied | 10,258 (67.8%) | $73,409 |
| Renter-Occupied | 4,861 (32.2%) | $36,418 |
| Average | 15,119 (100.0%) | $60,137 |
Occupancy by Householder Income Bracket in Scotts Bluff County
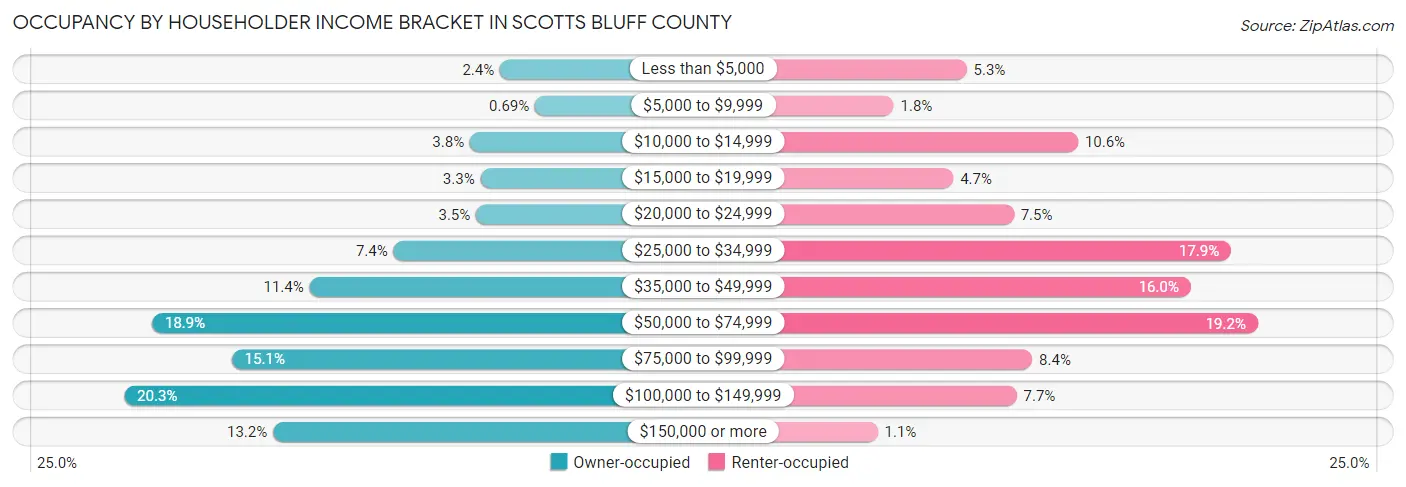
| Income Bracket | Owner-occupied | Renter-occupied |
| Less than $5,000 | 242 (2.4%) | 257 (5.3%) |
| $5,000 to $9,999 | 71 (0.7%) | 88 (1.8%) |
| $10,000 to $14,999 | 389 (3.8%) | 515 (10.6%) |
| $15,000 to $19,999 | 337 (3.3%) | 226 (4.6%) |
| $20,000 to $24,999 | 359 (3.5%) | 366 (7.5%) |
| $25,000 to $34,999 | 762 (7.4%) | 869 (17.9%) |
| $35,000 to $49,999 | 1,173 (11.4%) | 776 (16.0%) |
| $50,000 to $74,999 | 1,943 (18.9%) | 931 (19.2%) |
| $75,000 to $99,999 | 1,553 (15.1%) | 409 (8.4%) |
| $100,000 to $149,999 | 2,078 (20.3%) | 373 (7.7%) |
| $150,000 or more | 1,351 (13.2%) | 51 (1.1%) |
| Total | 10,258 (100.0%) | 4,861 (100.0%) |
Monthly Housing Cost Tiers in Scotts Bluff County
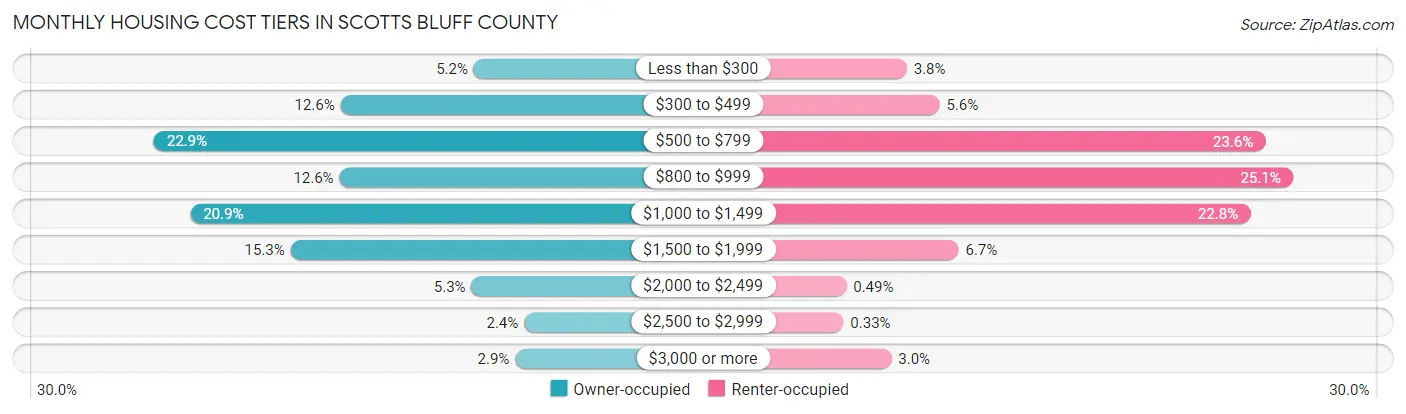
| Monthly Cost | Owner-occupied | Renter-occupied |
| Less than $300 | 532 (5.2%) | 186 (3.8%) |
| $300 to $499 | 1,287 (12.6%) | 274 (5.6%) |
| $500 to $799 | 2,345 (22.9%) | 1,148 (23.6%) |
| $800 to $999 | 1,294 (12.6%) | 1,222 (25.1%) |
| $1,000 to $1,499 | 2,139 (20.8%) | 1,108 (22.8%) |
| $1,500 to $1,999 | 1,571 (15.3%) | 325 (6.7%) |
| $2,000 to $2,499 | 546 (5.3%) | 24 (0.5%) |
| $2,500 to $2,999 | 247 (2.4%) | 16 (0.3%) |
| $3,000 or more | 297 (2.9%) | 145 (3.0%) |
| Total | 10,258 (100.0%) | 4,861 (100.0%) |
Physical Housing Characteristics in Scotts Bluff County
Housing Structures in Scotts Bluff County
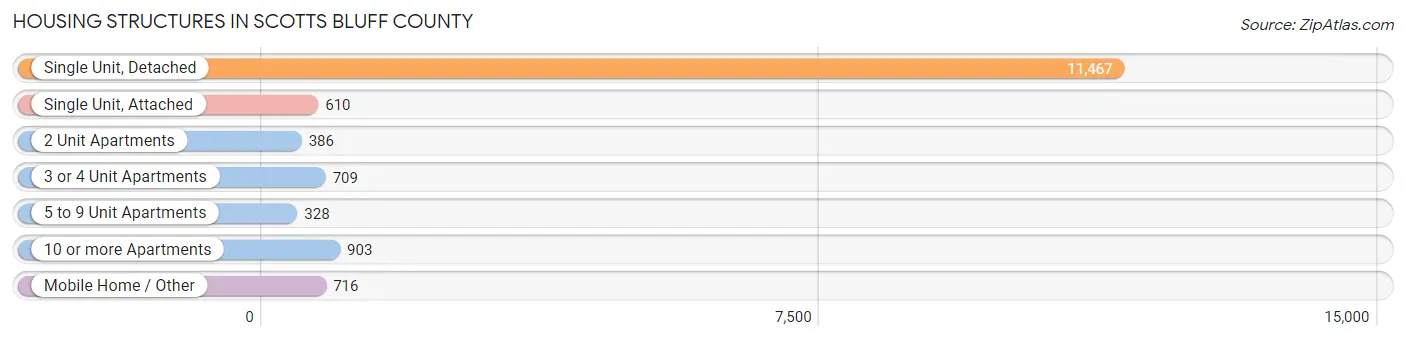
| Structure Type | # Housing Units | % Housing Units |
| Single Unit, Detached | 11,467 | 75.8% |
| Single Unit, Attached | 610 | 4.0% |
| 2 Unit Apartments | 386 | 2.5% |
| 3 or 4 Unit Apartments | 709 | 4.7% |
| 5 to 9 Unit Apartments | 328 | 2.2% |
| 10 or more Apartments | 903 | 6.0% |
| Mobile Home / Other | 716 | 4.7% |
| Total | 15,119 | 100.0% |
Housing Structures by Occupancy in Scotts Bluff County
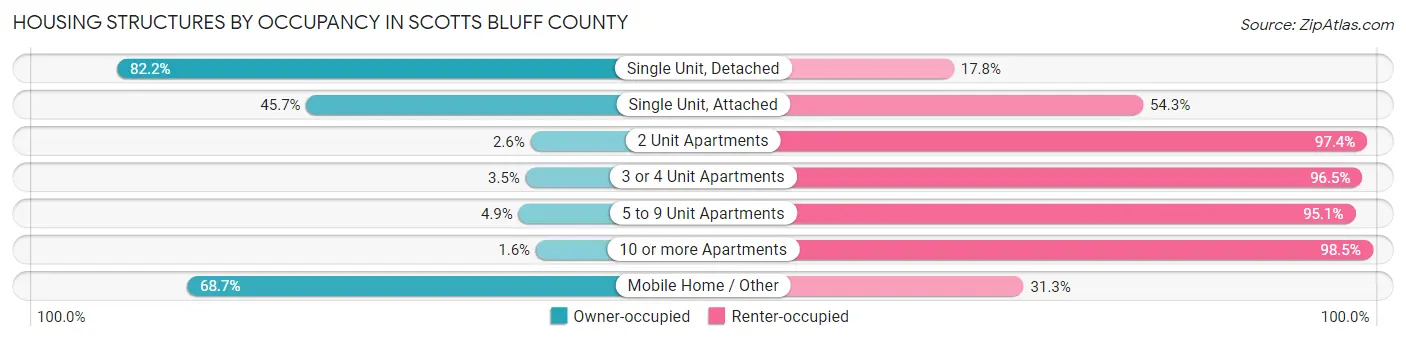
| Structure Type | Owner-occupied | Renter-occupied |
| Single Unit, Detached | 9,422 (82.2%) | 2,045 (17.8%) |
| Single Unit, Attached | 279 (45.7%) | 331 (54.3%) |
| 2 Unit Apartments | 10 (2.6%) | 376 (97.4%) |
| 3 or 4 Unit Apartments | 25 (3.5%) | 684 (96.5%) |
| 5 to 9 Unit Apartments | 16 (4.9%) | 312 (95.1%) |
| 10 or more Apartments | 14 (1.5%) | 889 (98.5%) |
| Mobile Home / Other | 492 (68.7%) | 224 (31.3%) |
| Total | 10,258 (67.8%) | 4,861 (32.2%) |
Housing Structures by Number of Rooms in Scotts Bluff County
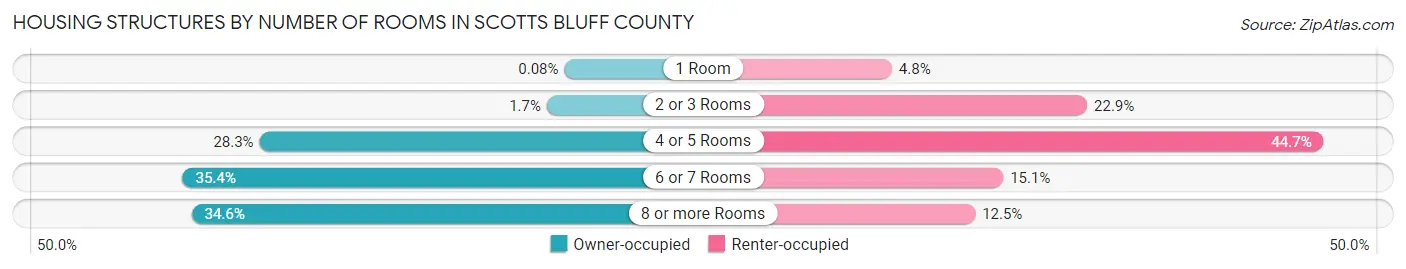
| Number of Rooms | Owner-occupied | Renter-occupied |
| 1 Room | 8 (0.1%) | 234 (4.8%) |
| 2 or 3 Rooms | 174 (1.7%) | 1,111 (22.9%) |
| 4 or 5 Rooms | 2,901 (28.3%) | 2,174 (44.7%) |
| 6 or 7 Rooms | 3,630 (35.4%) | 734 (15.1%) |
| 8 or more Rooms | 3,545 (34.6%) | 608 (12.5%) |
| Total | 10,258 (100.0%) | 4,861 (100.0%) |
Housing Structure by Heating Type in Scotts Bluff County
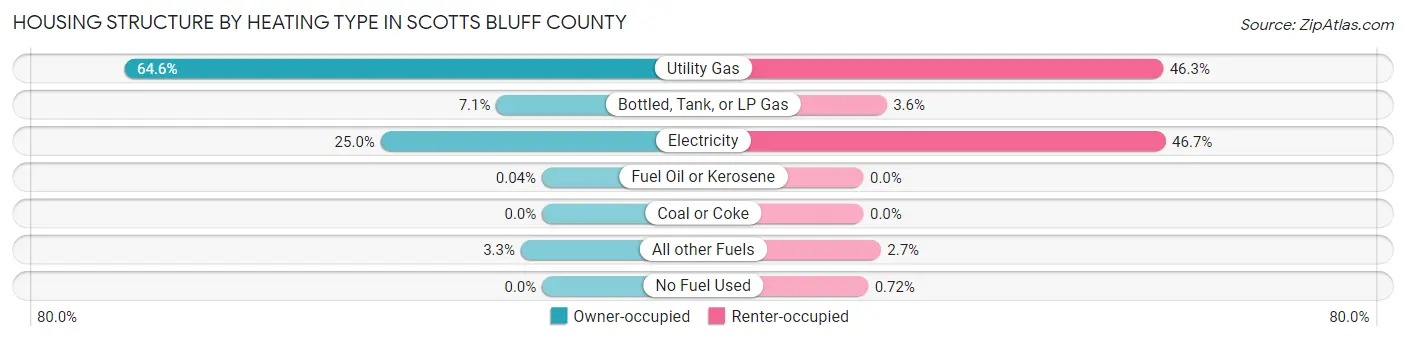
| Heating Type | Owner-occupied | Renter-occupied |
| Utility Gas | 6,629 (64.6%) | 2,252 (46.3%) |
| Bottled, Tank, or LP Gas | 726 (7.1%) | 174 (3.6%) |
| Electricity | 2,560 (25.0%) | 2,270 (46.7%) |
| Fuel Oil or Kerosene | 4 (0.0%) | 0 (0.0%) |
| Coal or Coke | 0 (0.0%) | 0 (0.0%) |
| All other Fuels | 339 (3.3%) | 130 (2.7%) |
| No Fuel Used | 0 (0.0%) | 35 (0.7%) |
| Total | 10,258 (100.0%) | 4,861 (100.0%) |
Household Vehicle Usage in Scotts Bluff County
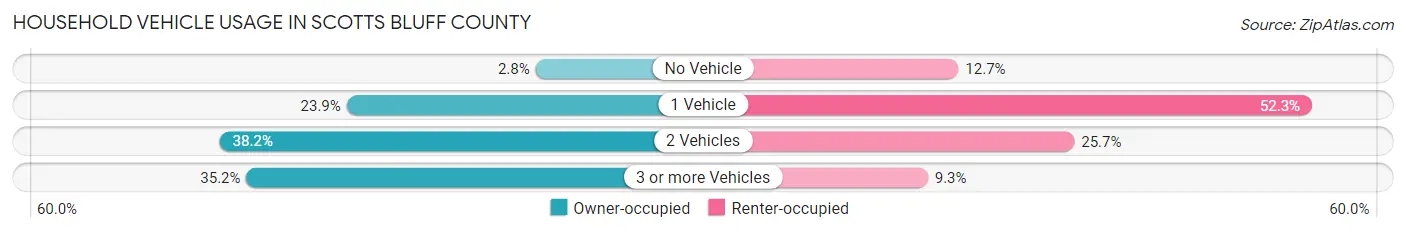
| Vehicles per Household | Owner-occupied | Renter-occupied |
| No Vehicle | 283 (2.8%) | 618 (12.7%) |
| 1 Vehicle | 2,455 (23.9%) | 2,543 (52.3%) |
| 2 Vehicles | 3,913 (38.2%) | 1,249 (25.7%) |
| 3 or more Vehicles | 3,607 (35.2%) | 451 (9.3%) |
| Total | 10,258 (100.0%) | 4,861 (100.0%) |
Real Estate & Mortgages in Scotts Bluff County
Real Estate and Mortgage Overview in Scotts Bluff County
| Characteristic | Without Mortgage | With Mortgage |
| Housing Units | 4,616 | 5,642 |
| Median Property Value | $124,900 | $167,500 |
| Median Household Income | $53,814 | $1,002 |
| Monthly Housing Costs | $554 | $294 |
| Real Estate Taxes | $2,031 | $129 |
Property Value by Mortgage Status in Scotts Bluff County
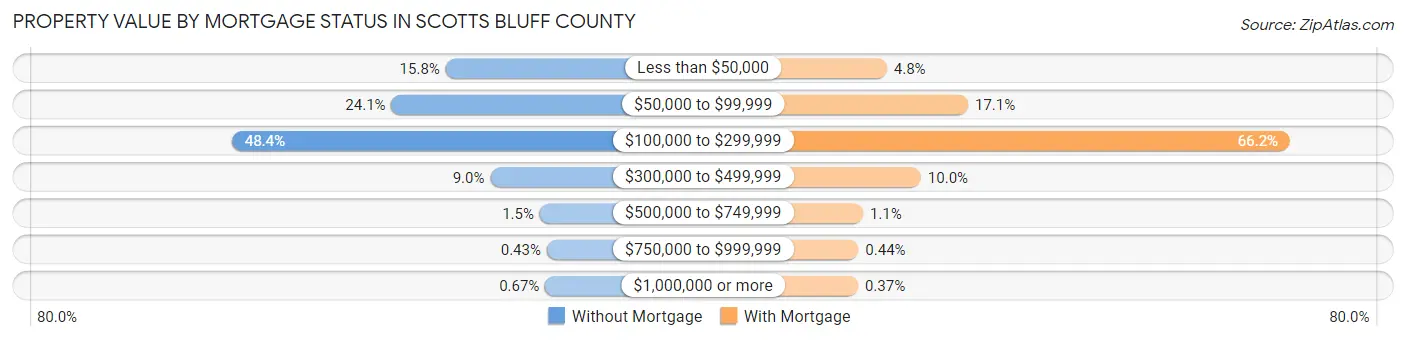
| Property Value | Without Mortgage | With Mortgage |
| Less than $50,000 | 731 (15.8%) | 269 (4.8%) |
| $50,000 to $99,999 | 1,113 (24.1%) | 967 (17.1%) |
| $100,000 to $299,999 | 2,235 (48.4%) | 3,734 (66.2%) |
| $300,000 to $499,999 | 417 (9.0%) | 562 (10.0%) |
| $500,000 to $749,999 | 69 (1.5%) | 64 (1.1%) |
| $750,000 to $999,999 | 20 (0.4%) | 25 (0.4%) |
| $1,000,000 or more | 31 (0.7%) | 21 (0.4%) |
| Total | 4,616 (100.0%) | 5,642 (100.0%) |
Household Income by Mortgage Status in Scotts Bluff County
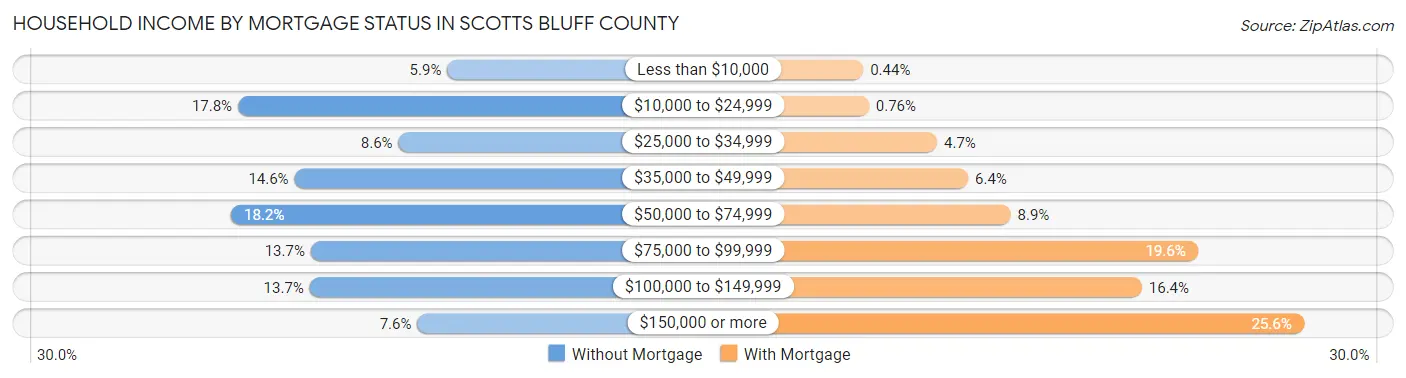
| Household Income | Without Mortgage | With Mortgage |
| Less than $10,000 | 270 (5.9%) | 25 (0.4%) |
| $10,000 to $24,999 | 822 (17.8%) | 43 (0.8%) |
| $25,000 to $34,999 | 399 (8.6%) | 263 (4.7%) |
| $35,000 to $49,999 | 673 (14.6%) | 363 (6.4%) |
| $50,000 to $74,999 | 840 (18.2%) | 500 (8.9%) |
| $75,000 to $99,999 | 630 (13.7%) | 1,103 (19.6%) |
| $100,000 to $149,999 | 633 (13.7%) | 923 (16.4%) |
| $150,000 or more | 349 (7.6%) | 1,445 (25.6%) |
| Total | 4,616 (100.0%) | 5,642 (100.0%) |
Property Value to Household Income Ratio in Scotts Bluff County
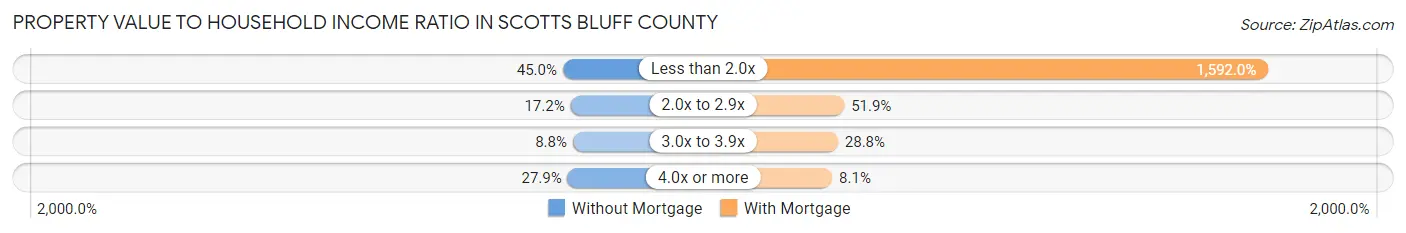
| Value-to-Income Ratio | Without Mortgage | With Mortgage |
| Less than 2.0x | 2,078 (45.0%) | 89,821 (1,592.0%) |
| 2.0x to 2.9x | 793 (17.2%) | 2,926 (51.9%) |
| 3.0x to 3.9x | 405 (8.8%) | 1,627 (28.8%) |
| 4.0x or more | 1,286 (27.9%) | 454 (8.1%) |
| Total | 4,616 (100.0%) | 5,642 (100.0%) |
Real Estate Taxes by Mortgage Status in Scotts Bluff County
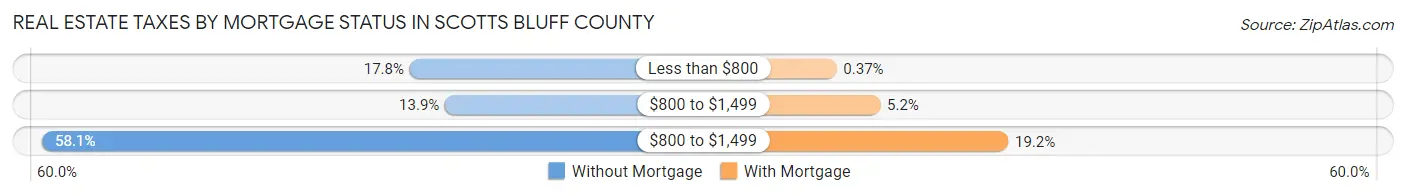
| Property Taxes | Without Mortgage | With Mortgage |
| Less than $800 | 821 (17.8%) | 21 (0.4%) |
| $800 to $1,499 | 642 (13.9%) | 291 (5.2%) |
| $800 to $1,499 | 2,681 (58.1%) | 1,082 (19.2%) |
| Total | 4,616 (100.0%) | 5,642 (100.0%) |
Health & Disability in Scotts Bluff County
Health Insurance Coverage by Age in Scotts Bluff County
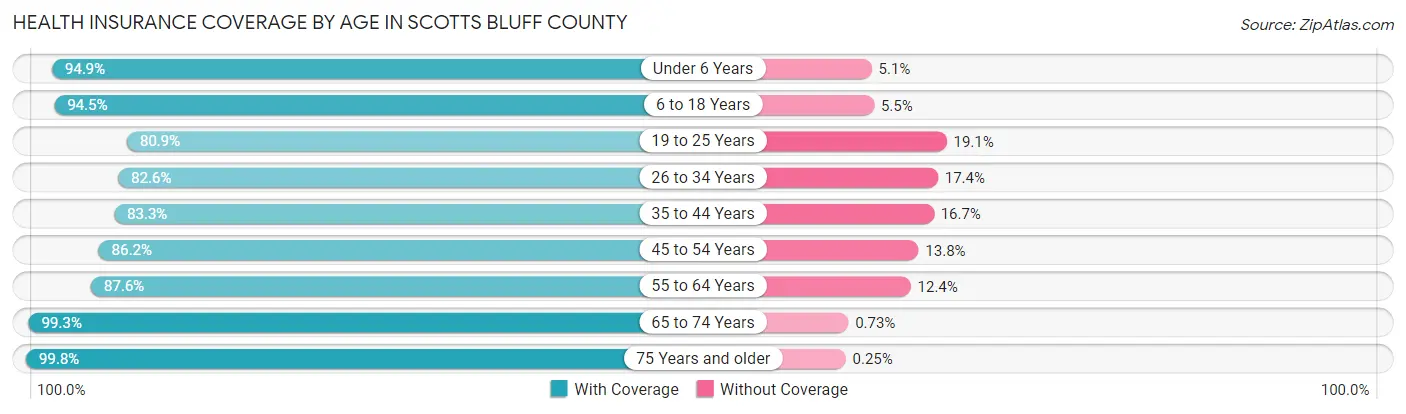
| Age Bracket | With Coverage | Without Coverage |
| Under 6 Years | 2,590 (94.9%) | 139 (5.1%) |
| 6 to 18 Years | 6,376 (94.5%) | 373 (5.5%) |
| 19 to 25 Years | 2,101 (80.9%) | 495 (19.1%) |
| 26 to 34 Years | 3,276 (82.6%) | 692 (17.4%) |
| 35 to 44 Years | 3,480 (83.3%) | 696 (16.7%) |
| 45 to 54 Years | 3,292 (86.2%) | 528 (13.8%) |
| 55 to 64 Years | 4,017 (87.6%) | 567 (12.4%) |
| 65 to 74 Years | 3,959 (99.3%) | 29 (0.7%) |
| 75 Years and older | 2,796 (99.8%) | 7 (0.3%) |
| Total | 31,887 (90.0%) | 3,526 (10.0%) |
Health Insurance Coverage by Citizenship Status in Scotts Bluff County
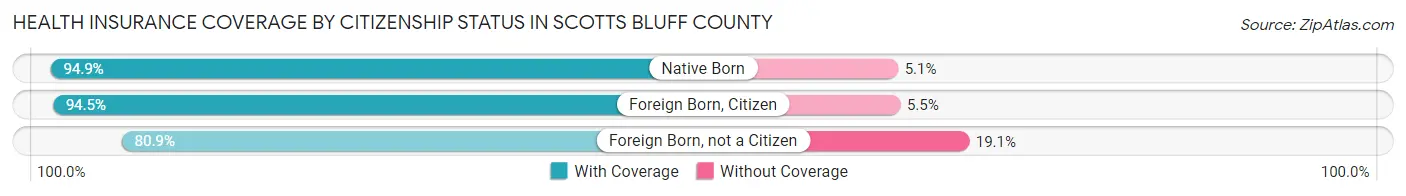
| Citizenship Status | With Coverage | Without Coverage |
| Native Born | 2,590 (94.9%) | 139 (5.1%) |
| Foreign Born, Citizen | 6,376 (94.5%) | 373 (5.5%) |
| Foreign Born, not a Citizen | 2,101 (80.9%) | 495 (19.1%) |
Health Insurance Coverage by Household Income in Scotts Bluff County
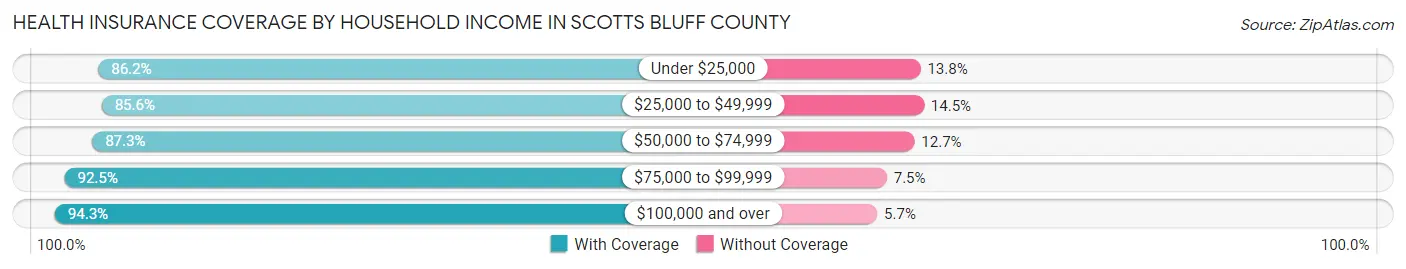
| Household Income | With Coverage | Without Coverage |
| Under $25,000 | 3,614 (86.2%) | 579 (13.8%) |
| $25,000 to $49,999 | 5,855 (85.6%) | 989 (14.4%) |
| $50,000 to $74,999 | 5,714 (87.3%) | 829 (12.7%) |
| $75,000 to $99,999 | 4,742 (92.5%) | 384 (7.5%) |
| $100,000 and over | 11,810 (94.3%) | 712 (5.7%) |
Public vs Private Health Insurance Coverage by Age in Scotts Bluff County
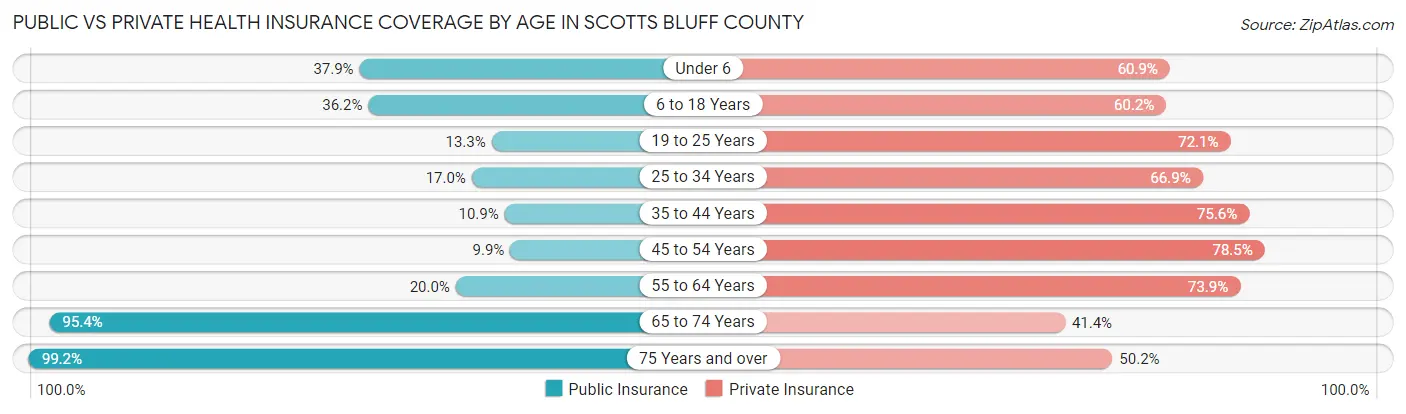
| Age Bracket | Public Insurance | Private Insurance |
| Under 6 | 1,033 (37.9%) | 1,661 (60.9%) |
| 6 to 18 Years | 2,443 (36.2%) | 4,063 (60.2%) |
| 19 to 25 Years | 346 (13.3%) | 1,872 (72.1%) |
| 25 to 34 Years | 675 (17.0%) | 2,656 (66.9%) |
| 35 to 44 Years | 456 (10.9%) | 3,157 (75.6%) |
| 45 to 54 Years | 377 (9.9%) | 2,997 (78.5%) |
| 55 to 64 Years | 916 (20.0%) | 3,388 (73.9%) |
| 65 to 74 Years | 3,804 (95.4%) | 1,652 (41.4%) |
| 75 Years and over | 2,781 (99.2%) | 1,408 (50.2%) |
| Total | 12,831 (36.2%) | 22,854 (64.5%) |
Disability Status by Sex by Age in Scotts Bluff County
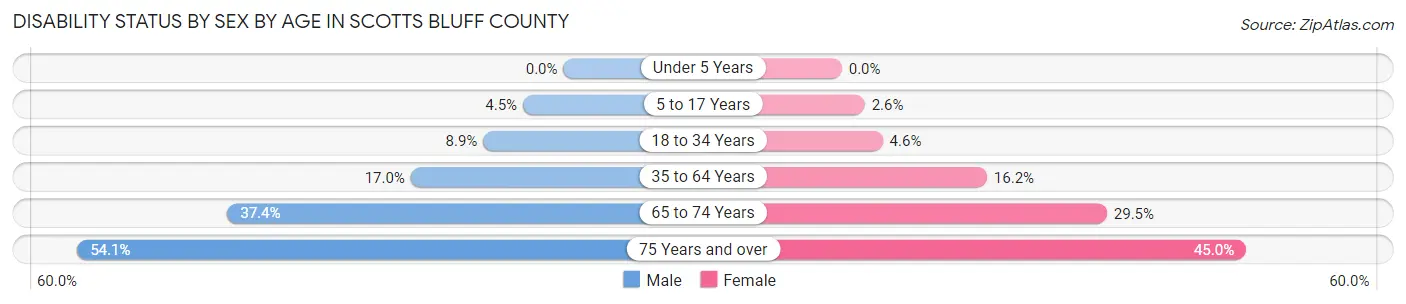
| Age Bracket | Male | Female |
| Under 5 Years | 0 (0.0%) | 0 (0.0%) |
| 5 to 17 Years | 149 (4.5%) | 85 (2.5%) |
| 18 to 34 Years | 325 (8.9%) | 161 (4.5%) |
| 35 to 64 Years | 1,051 (17.0%) | 1,034 (16.2%) |
| 65 to 74 Years | 690 (37.4%) | 633 (29.5%) |
| 75 Years and over | 601 (54.1%) | 762 (45.0%) |
Disability Class by Sex by Age in Scotts Bluff County
Disability Class: Hearing Difficulty
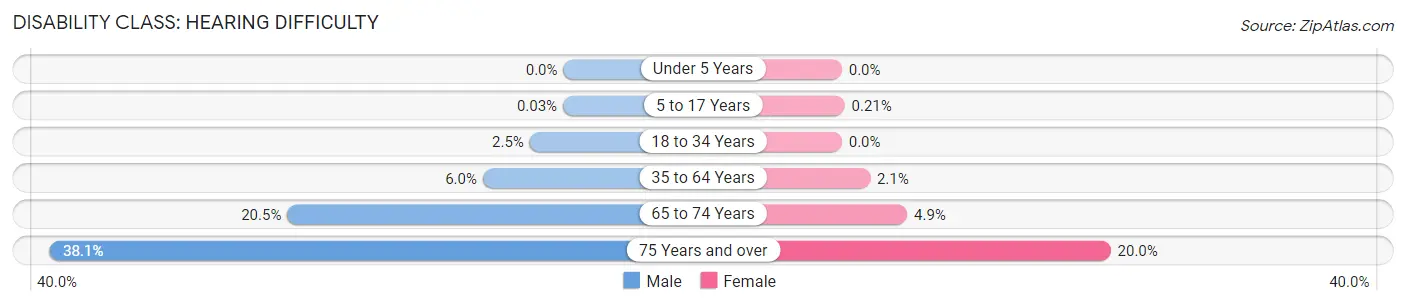
| Age Bracket | Male | Female |
| Under 5 Years | 0 (0.0%) | 0 (0.0%) |
| 5 to 17 Years | 1 (0.0%) | 7 (0.2%) |
| 18 to 34 Years | 91 (2.5%) | 0 (0.0%) |
| 35 to 64 Years | 370 (6.0%) | 134 (2.1%) |
| 65 to 74 Years | 378 (20.5%) | 104 (4.9%) |
| 75 Years and over | 423 (38.1%) | 338 (20.0%) |
Disability Class: Vision Difficulty

| Age Bracket | Male | Female |
| Under 5 Years | 0 (0.0%) | 0 (0.0%) |
| 5 to 17 Years | 16 (0.5%) | 28 (0.8%) |
| 18 to 34 Years | 4 (0.1%) | 3 (0.1%) |
| 35 to 64 Years | 197 (3.2%) | 102 (1.6%) |
| 65 to 74 Years | 81 (4.4%) | 205 (9.6%) |
| 75 Years and over | 79 (7.1%) | 180 (10.6%) |
Disability Class: Cognitive Difficulty
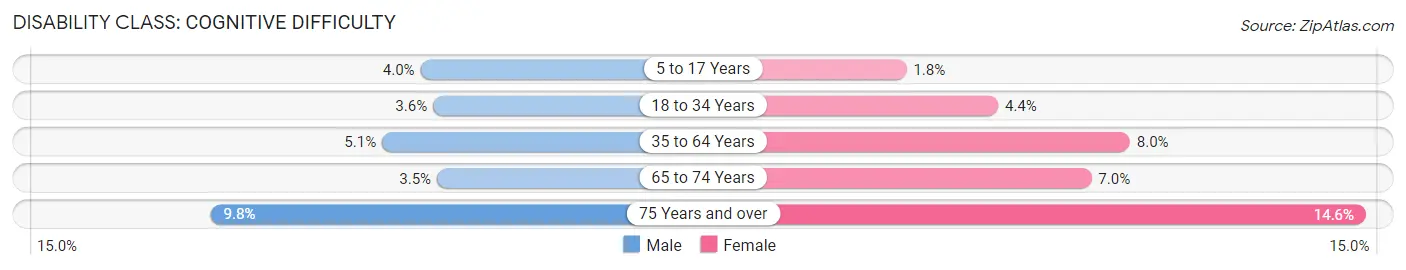
| Age Bracket | Male | Female |
| 5 to 17 Years | 132 (4.0%) | 60 (1.8%) |
| 18 to 34 Years | 132 (3.6%) | 154 (4.3%) |
| 35 to 64 Years | 312 (5.1%) | 513 (8.0%) |
| 65 to 74 Years | 65 (3.5%) | 149 (7.0%) |
| 75 Years and over | 109 (9.8%) | 247 (14.6%) |
Disability Class: Ambulatory Difficulty
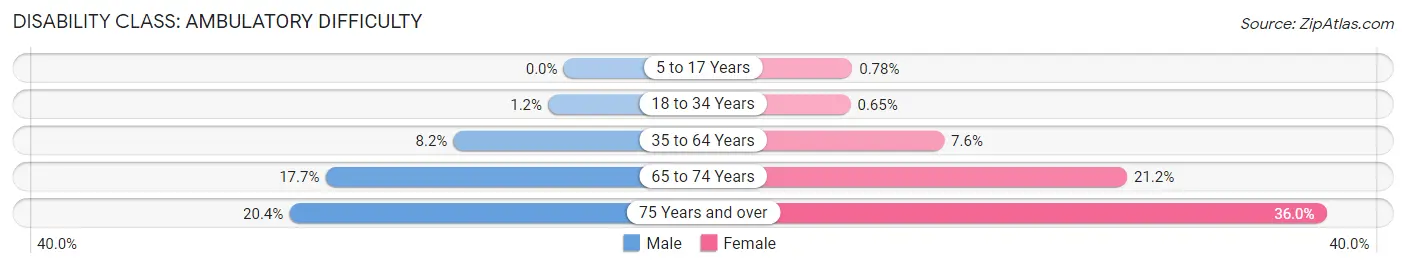
| Age Bracket | Male | Female |
| 5 to 17 Years | 0 (0.0%) | 26 (0.8%) |
| 18 to 34 Years | 42 (1.1%) | 23 (0.6%) |
| 35 to 64 Years | 506 (8.2%) | 486 (7.6%) |
| 65 to 74 Years | 326 (17.7%) | 454 (21.2%) |
| 75 Years and over | 226 (20.4%) | 609 (36.0%) |
Disability Class: Self-Care Difficulty
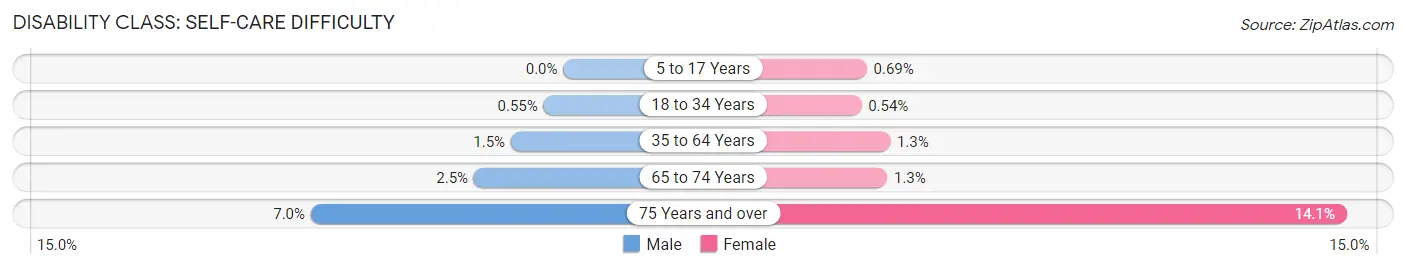
| Age Bracket | Male | Female |
| 5 to 17 Years | 0 (0.0%) | 23 (0.7%) |
| 18 to 34 Years | 20 (0.5%) | 19 (0.5%) |
| 35 to 64 Years | 90 (1.5%) | 86 (1.3%) |
| 65 to 74 Years | 46 (2.5%) | 27 (1.3%) |
| 75 Years and over | 78 (7.0%) | 238 (14.1%) |
Technology Access in Scotts Bluff County
Computing Device Access in Scotts Bluff County
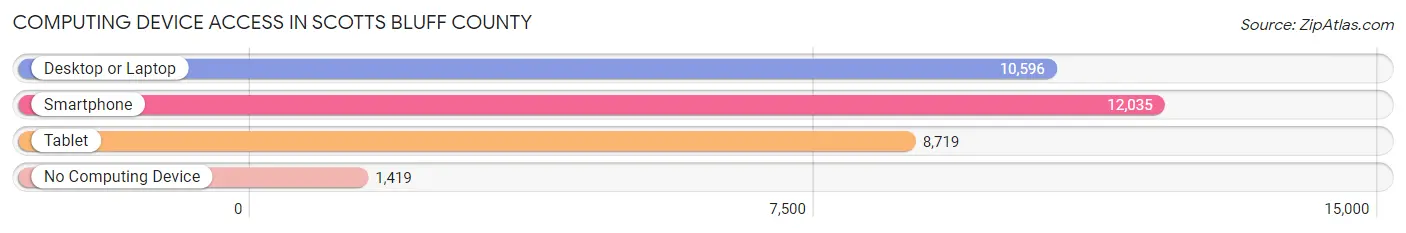
| Device Type | # Households | % Households |
| Desktop or Laptop | 10,596 | 70.1% |
| Smartphone | 12,035 | 79.6% |
| Tablet | 8,719 | 57.7% |
| No Computing Device | 1,419 | 9.4% |
| Total | 15,119 | 100.0% |
Internet Access in Scotts Bluff County
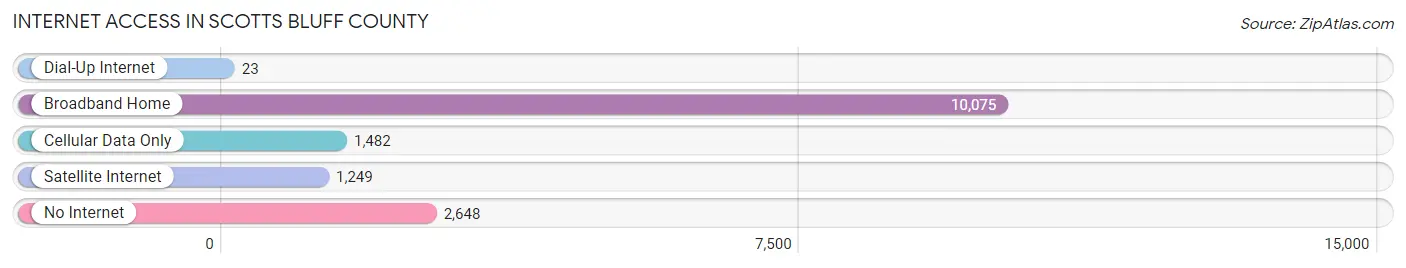
| Internet Type | # Households | % Households |
| Dial-Up Internet | 23 | 0.2% |
| Broadband Home | 10,075 | 66.6% |
| Cellular Data Only | 1,482 | 9.8% |
| Satellite Internet | 1,249 | 8.3% |
| No Internet | 2,648 | 17.5% |
| Total | 15,119 | 100.0% |
Scotts Bluff County Summary
Scott’s Bluff County is located in the western part of Nebraska, and is part of the Nebraska Panhandle. It is bordered by Sioux County to the north, Banner County to the east, Morrill County to the south, and Wyoming to the west. The county seat is Gering, and the largest city is Scottsbluff. The county was named after a prominent bluff that overlooks the North Platte River Valley.
History
The area that is now Scott’s Bluff County was originally inhabited by the Sioux and Cheyenne Native American tribes. The first Europeans to explore the area were French-Canadian fur trappers in the early 1800s. In 1841, the first permanent settlement was established by the Mormons, who were led by Brigham Young. The Mormons established a trading post and a ferry across the North Platte River.
In 1867, the Union Pacific Railroad reached the area, and the town of Gering was established. The railroad brought an influx of settlers to the area, and the population of the county grew rapidly. In 1887, the county was officially established, and the county seat was established in Gering.
Geography
Scott’s Bluff County covers an area of 1,845 square miles, and is located in the Nebraska Panhandle. The county is bordered by Sioux County to the north, Banner County to the east, Morrill County to the south, and Wyoming to the west. The county is mostly flat, with rolling hills in the east and south. The North Platte River runs through the county, and there are several small lakes and reservoirs. The county is home to several state parks, including Scotts Bluff National Monument, Lake Minatare State Recreation Area, and Wildcat Hills State Recreation Area.
Economy
The economy of Scott’s Bluff County is largely based on agriculture and tourism. The county is home to several large farms, and the main crops grown are corn, wheat, and hay. The county is also home to several large cattle ranches. Tourism is an important part of the economy, and the county is home to several popular attractions, including Scotts Bluff National Monument, Lake Minatare State Recreation Area, and Wildcat Hills State Recreation Area.
Demographics
As of the 2010 census, the population of Scott’s Bluff County was 37,364. The population is mostly white (90.2%), with small percentages of Hispanic (4.7%), African American (1.2%), and Native American (1.1%) residents. The median household income is $45,845, and the median home value is $133,400. The unemployment rate is 3.7%.
Common Questions
What is the Total Population of Scotts Bluff County?
Total Population of Scotts Bluff County is 36,048.
What is the Total Male Population of Scotts Bluff County?
Total Male Population of Scotts Bluff County is 17,521.
What is the Total Female Population of Scotts Bluff County?
Total Female Population of Scotts Bluff County is 18,527.
What is the Ratio of Males per 100 Females in Scotts Bluff County?
There are 94.57 Males per 100 Females in Scotts Bluff County.
What is the Ratio of Females per 100 Males in Scotts Bluff County?
There are 105.74 Females per 100 Males in Scotts Bluff County.
What is the Median Population Age in Scotts Bluff County?
Median Population Age in Scotts Bluff County is 39.2 Years.
What is the Average Family Size in Scotts Bluff County
Average Family Size in Scotts Bluff County is 3.0 People.
What is the Average Household Size in Scotts Bluff County
Average Household Size in Scotts Bluff County is 2.3 People.
What is Per Capita Income in Scotts Bluff County?
Per Capita income in Scotts Bluff County is $33,158.
What is the Median Family Income in Scotts Bluff County?
Median Family Income in Scotts Bluff County is $78,472.
What is the Median Household income in Scotts Bluff County?
Median Household Income in Scotts Bluff County is $60,137.
What is Income or Wage Gap in Scotts Bluff County?
Income or Wage Gap in Scotts Bluff County is 29.4%.
Women in Scotts Bluff County earn 70.6 cents for every dollar earned by a man.
What is Family Income Deficit in Scotts Bluff County?
Family Income Deficit in Scotts Bluff County is $9,804.
Families that are below poverty line in Scotts Bluff County earn $9,804 less on average than the poverty threshold level.
What is Inequality or Gini Index in Scotts Bluff County?
Inequality or Gini Index in Scotts Bluff County is 0.44.
How Large is the Labor Force in Scotts Bluff County?
There are 18,060 People in the Labor Forcein in Scotts Bluff County.
What is the Percentage of People in the Labor Force in Scotts Bluff County?
64.0% of People are in the Labor Force in Scotts Bluff County.
What is the Unemployment Rate in Scotts Bluff County?
Unemployment Rate in Scotts Bluff County is 3.5%.