Gage County, NE
Gage County Map
Gage County Overview
21,654
TOTAL POPULATION
10,964
MALE POPULATION
10,690
FEMALE POPULATION
102.56
MALES / 100 FEMALES
97.50
FEMALES / 100 MALES
42.9
MEDIAN AGE
2.9
AVG FAMILY SIZE
2.3
AVG HOUSEHOLD SIZE
$33,435
PER CAPITA INCOME
$82,708
AVG FAMILY INCOME
$60,035
AVG HOUSEHOLD INCOME
32.3%
WAGE / INCOME GAP [ % ]
67.7¢/ $1
WAGE / INCOME GAP [ $ ]
$10,726
FAMILY INCOME DEFICIT
0.44
INEQUALITY / GINI INDEX
11,020
LABOR FORCE [ PEOPLE ]
63.4%
PERCENT IN LABOR FORCE
2.0%
UNEMPLOYMENT RATE
Gage County Area Codes
Race in Gage County
The most populous races in Gage County are White / Caucasian (20,695 | 95.6%), Hispanic or Latino (671 | 3.1%), and Two or more Races (441 | 2.0%).
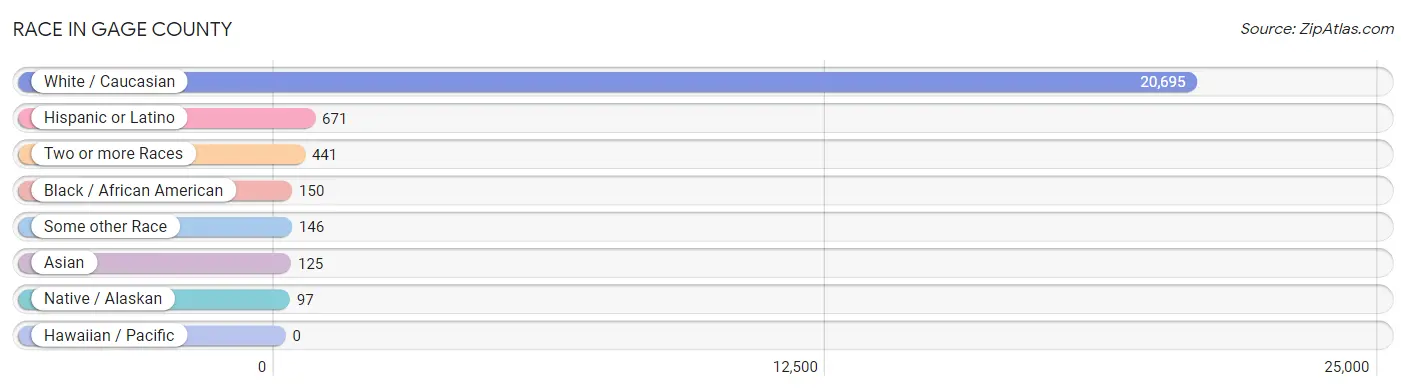
| Race | # Population | % Population |
| Asian | 125 | 0.6% |
| Black / African American | 150 | 0.7% |
| Hawaiian / Pacific | 0 | 0.0% |
| Hispanic or Latino | 671 | 3.1% |
| Native / Alaskan | 97 | 0.4% |
| White / Caucasian | 20,695 | 95.6% |
| Two or more Races | 441 | 2.0% |
| Some other Race | 146 | 0.7% |
| Total | 21,654 | 100.0% |
Ancestry in Gage County
The most populous ancestries reported in Gage County are German (8,906 | 41.1%), Irish (2,302 | 10.6%), English (1,910 | 8.8%), American (1,220 | 5.6%), and Czech (864 | 4.0%), together accounting for 70.2% of all Gage County residents.
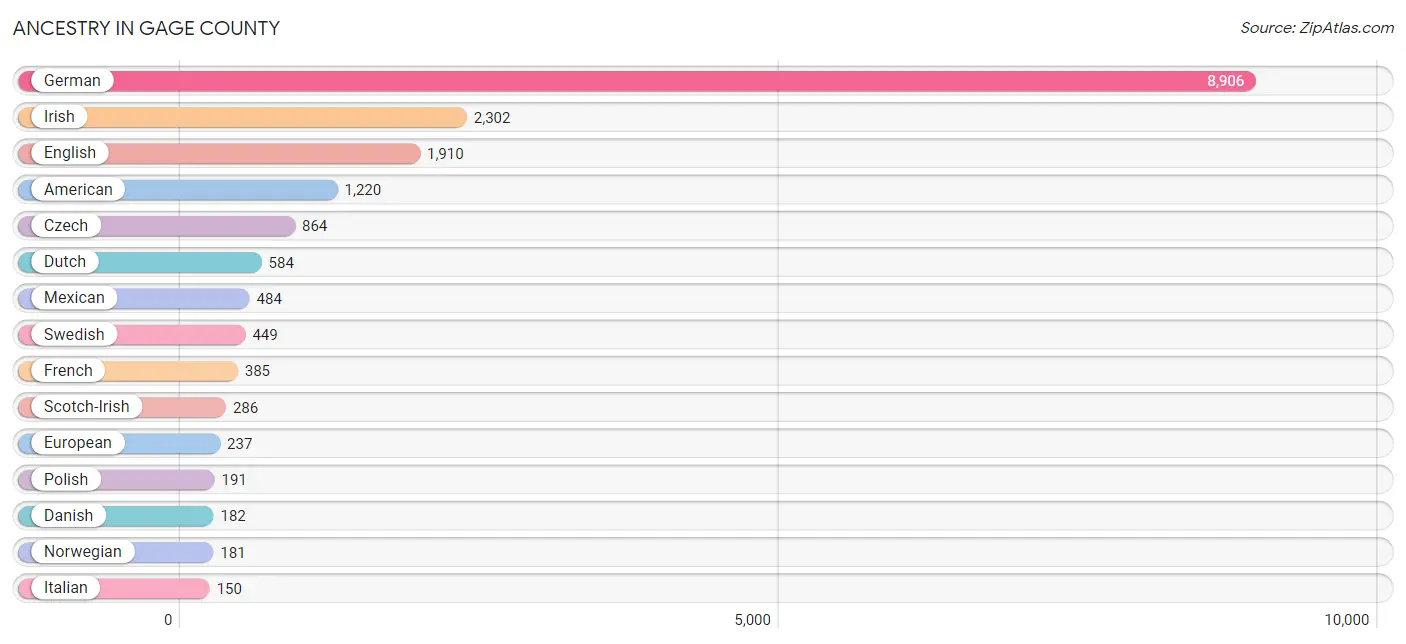
| Ancestry | # Population | % Population |
| African | 7 | 0.0% |
| American | 1,220 | 5.6% |
| Arab | 17 | 0.1% |
| Austrian | 9 | 0.0% |
| Belgian | 5 | 0.0% |
| Bhutanese | 21 | 0.1% |
| Blackfeet | 9 | 0.0% |
| British | 61 | 0.3% |
| Canadian | 33 | 0.2% |
| Celtic | 15 | 0.1% |
| Cherokee | 19 | 0.1% |
| Cheyenne | 6 | 0.0% |
| Choctaw | 9 | 0.0% |
| Croatian | 19 | 0.1% |
| Czech | 864 | 4.0% |
| Czechoslovakian | 107 | 0.5% |
| Danish | 182 | 0.8% |
| Dominican | 11 | 0.1% |
| Dutch | 584 | 2.7% |
| Eastern European | 48 | 0.2% |
| Egyptian | 17 | 0.1% |
| English | 1,910 | 8.8% |
| European | 237 | 1.1% |
| French | 385 | 1.8% |
| French Canadian | 18 | 0.1% |
| German | 8,906 | 41.1% |
| German Russian | 5 | 0.0% |
| Hungarian | 10 | 0.1% |
| Indian (Asian) | 72 | 0.3% |
| Inupiat | 25 | 0.1% |
| Irish | 2,302 | 10.6% |
| Italian | 150 | 0.7% |
| Korean | 50 | 0.2% |
| Lithuanian | 10 | 0.1% |
| Luxembourger | 2 | 0.0% |
| Malaysian | 41 | 0.2% |
| Mexican | 484 | 2.2% |
| Mexican American Indian | 62 | 0.3% |
| Navajo | 2 | 0.0% |
| Northern European | 8 | 0.0% |
| Norwegian | 181 | 0.8% |
| Pennsylvania German | 3 | 0.0% |
| Polish | 191 | 0.9% |
| Portuguese | 14 | 0.1% |
| Potawatomi | 18 | 0.1% |
| Puerto Rican | 29 | 0.1% |
| Russian | 105 | 0.5% |
| Samoan | 9 | 0.0% |
| Scandinavian | 44 | 0.2% |
| Scotch-Irish | 286 | 1.3% |
| Scottish | 146 | 0.7% |
| Sioux | 33 | 0.2% |
| South African | 18 | 0.1% |
| Spaniard | 25 | 0.1% |
| Spanish | 71 | 0.3% |
| Subsaharan African | 31 | 0.1% |
| Swedish | 449 | 2.1% |
| Swiss | 62 | 0.3% |
| Ukrainian | 3 | 0.0% |
| Welsh | 76 | 0.4% | View All 60 Rows |
Immigrants in Gage County
The most numerous immigrant groups reported in Gage County came from Central America (228 | 1.1%), Latin America (228 | 1.1%), Mexico (181 | 0.8%), Asia (65 | 0.3%), and Eastern Asia (53 | 0.2%), together accounting for 3.5% of all Gage County residents.
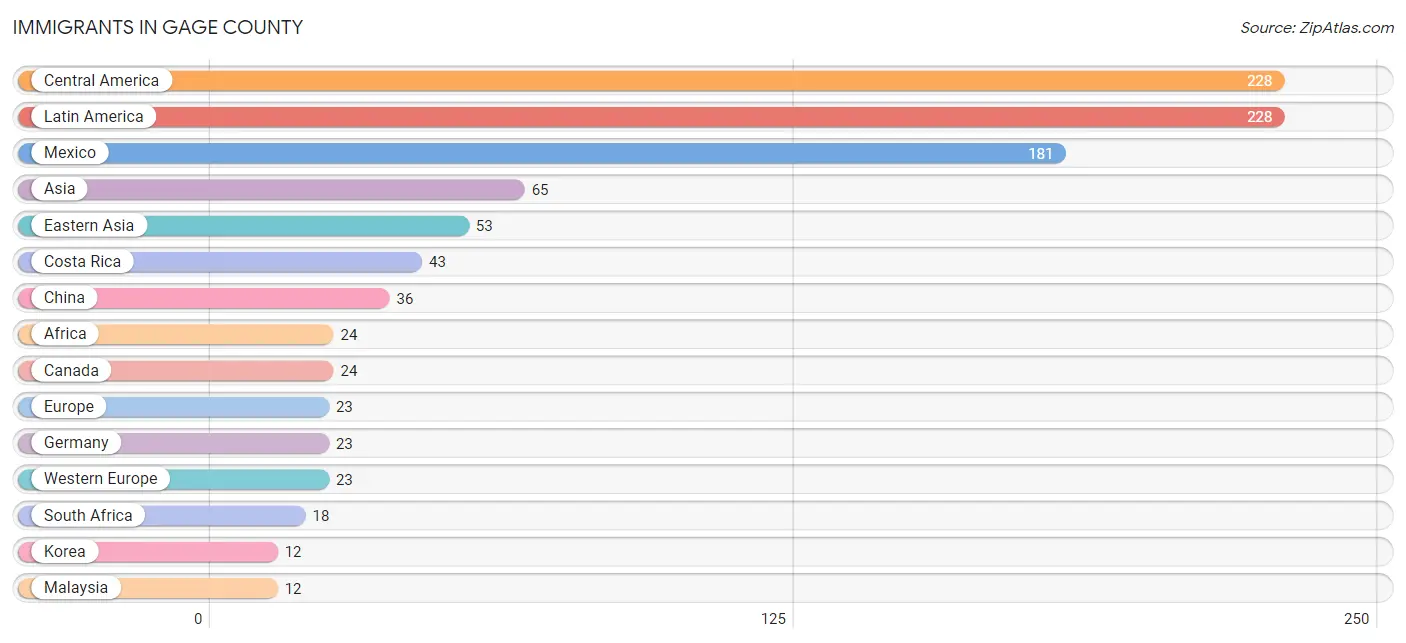
| Immigration Origin | # Population | % Population |
| Africa | 24 | 0.1% |
| Asia | 65 | 0.3% |
| Canada | 24 | 0.1% |
| Central America | 228 | 1.1% |
| China | 36 | 0.2% |
| Costa Rica | 43 | 0.2% |
| Eastern Africa | 3 | 0.0% |
| Eastern Asia | 53 | 0.2% |
| El Salvador | 2 | 0.0% |
| Europe | 23 | 0.1% |
| Germany | 23 | 0.1% |
| Guatemala | 2 | 0.0% |
| Japan | 5 | 0.0% |
| Kenya | 3 | 0.0% |
| Korea | 12 | 0.1% |
| Latin America | 228 | 1.1% |
| Malaysia | 12 | 0.1% |
| Mexico | 181 | 0.8% |
| South Africa | 18 | 0.1% |
| South Eastern Asia | 12 | 0.1% |
| Western Europe | 23 | 0.1% | View All 21 Rows |
Sex and Age in Gage County
Sex and Age in Gage County
The most populous age groups in Gage County are 55 to 59 Years (854 | 7.8%) for men and 55 to 59 Years (884 | 8.3%) for women.
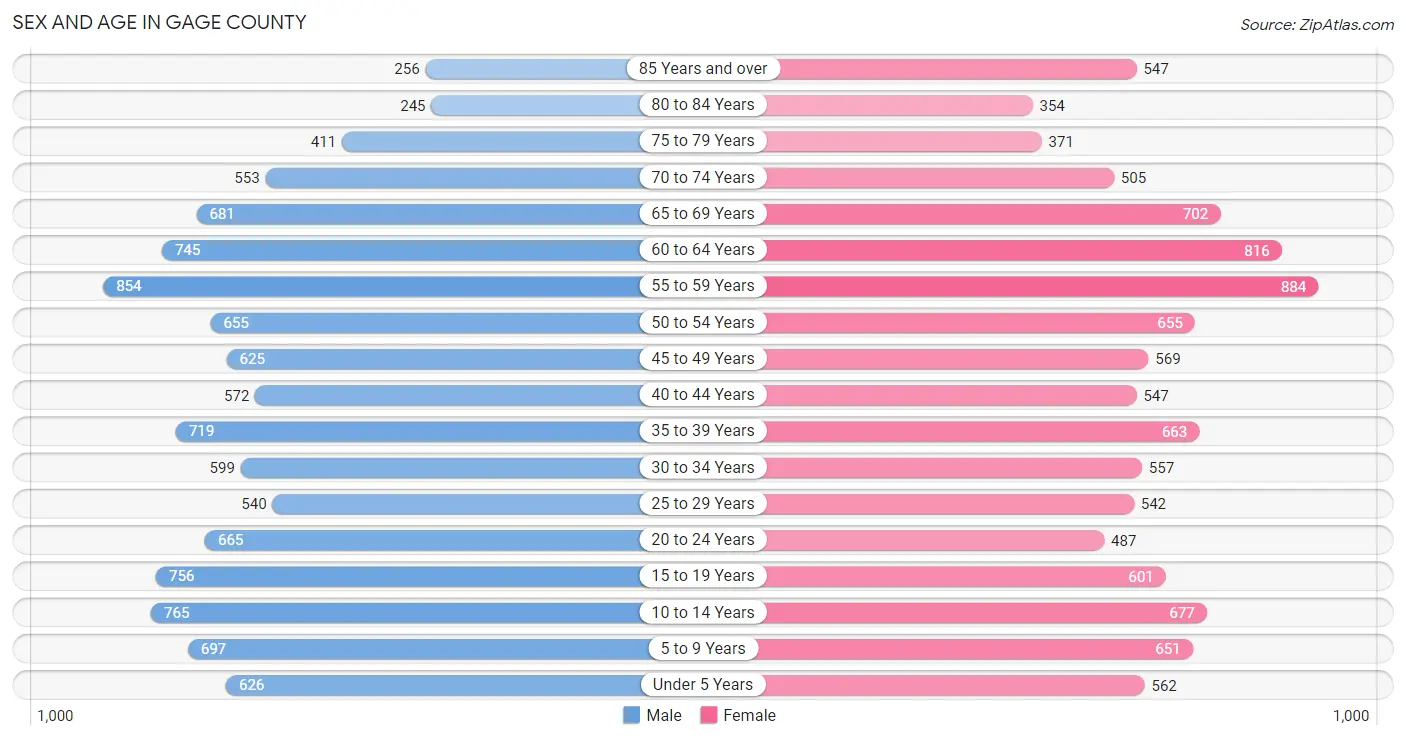
| Age Bracket | Male | Female |
| Under 5 Years | 626 (5.7%) | 562 (5.3%) |
| 5 to 9 Years | 697 (6.4%) | 651 (6.1%) |
| 10 to 14 Years | 765 (7.0%) | 677 (6.3%) |
| 15 to 19 Years | 756 (6.9%) | 601 (5.6%) |
| 20 to 24 Years | 665 (6.1%) | 487 (4.6%) |
| 25 to 29 Years | 540 (4.9%) | 542 (5.1%) |
| 30 to 34 Years | 599 (5.5%) | 557 (5.2%) |
| 35 to 39 Years | 719 (6.6%) | 663 (6.2%) |
| 40 to 44 Years | 572 (5.2%) | 547 (5.1%) |
| 45 to 49 Years | 625 (5.7%) | 569 (5.3%) |
| 50 to 54 Years | 655 (6.0%) | 655 (6.1%) |
| 55 to 59 Years | 854 (7.8%) | 884 (8.3%) |
| 60 to 64 Years | 745 (6.8%) | 816 (7.6%) |
| 65 to 69 Years | 681 (6.2%) | 702 (6.6%) |
| 70 to 74 Years | 553 (5.0%) | 505 (4.7%) |
| 75 to 79 Years | 411 (3.7%) | 371 (3.5%) |
| 80 to 84 Years | 245 (2.2%) | 354 (3.3%) |
| 85 Years and over | 256 (2.3%) | 547 (5.1%) |
| Total | 10,964 (100.0%) | 10,690 (100.0%) |
Families and Households in Gage County
Median Family Size in Gage County
The median family size in Gage County is 2.93 persons per family, with single female/mother families (696 | 12.6%) accounting for the largest median family size of 3.01 persons per family. On the other hand, single male/father families (391 | 7.1%) represent the smallest median family size with 2.57 persons per family.
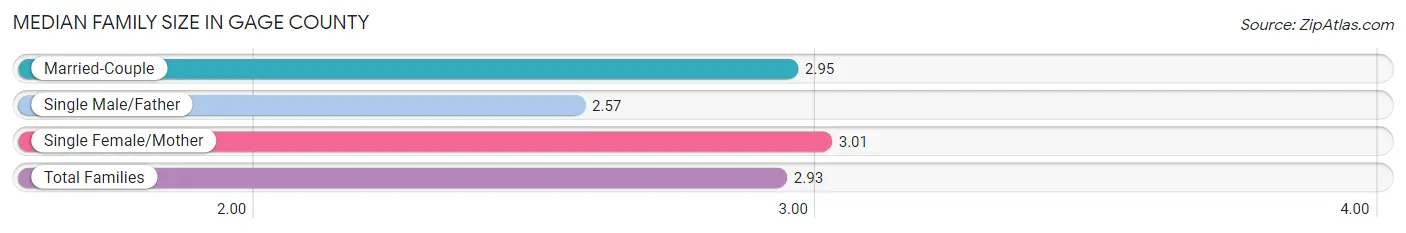
| Family Type | # Families | Family Size |
| Married-Couple | 4,425 (80.3%) | 2.95 |
| Single Male/Father | 391 (7.1%) | 2.57 |
| Single Female/Mother | 696 (12.6%) | 3.01 |
| Total Families | 5,512 (100.0%) | 2.93 |
Median Household Size in Gage County
The median household size in Gage County is 2.30 persons per household, with single female/mother households (696 | 7.6%) accounting for the largest median household size of 3.34 persons per household. non-family households (3,642 | 39.8%) represent the smallest median household size with 1.22 persons per household.
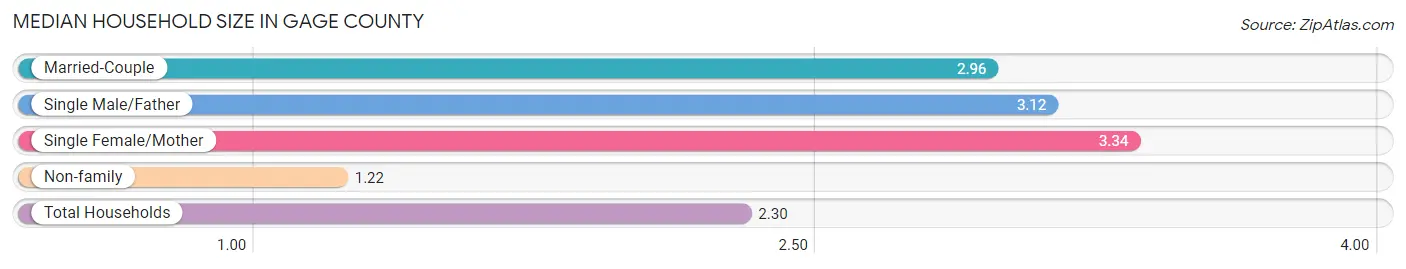
| Household Type | # Households | Household Size |
| Married-Couple | 4,425 (48.3%) | 2.96 |
| Single Male/Father | 391 (4.3%) | 3.12 |
| Single Female/Mother | 696 (7.6%) | 3.34 |
| Non-family | 3,642 (39.8%) | 1.22 |
| Total Households | 9,154 (100.0%) | 2.30 |
Household Size by Marriage Status in Gage County
Out of a total of 9,154 households in Gage County, 5,512 (60.2%) are family households, while 3,642 (39.8%) are nonfamily households. The most numerous type of family households are 2-person households, comprising 2,976, and the most common type of nonfamily households are 1-person households, comprising 3,174.
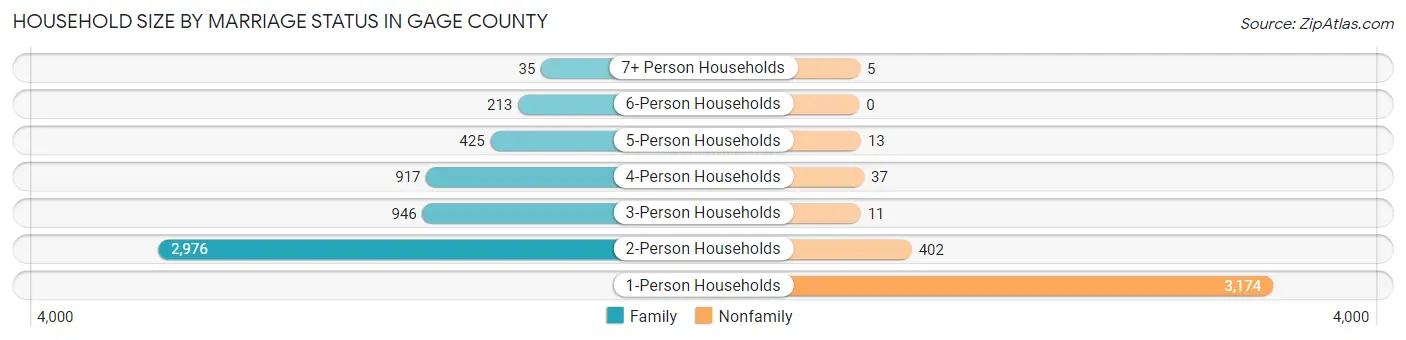
| Household Size | Family Households | Nonfamily Households |
| 1-Person Households | - | 3,174 (34.7%) |
| 2-Person Households | 2,976 (32.5%) | 402 (4.4%) |
| 3-Person Households | 946 (10.3%) | 11 (0.1%) |
| 4-Person Households | 917 (10.0%) | 37 (0.4%) |
| 5-Person Households | 425 (4.6%) | 13 (0.1%) |
| 6-Person Households | 213 (2.3%) | 0 (0.0%) |
| 7+ Person Households | 35 (0.4%) | 5 (0.1%) |
| Total | 5,512 (60.2%) | 3,642 (39.8%) |
Female Fertility in Gage County
Fertility by Age in Gage County
Average fertility rate in Gage County is 65.0 births per 1,000 women. Women in the age bracket of 20 to 34 years have the highest fertility rate with 96.0 births per 1,000 women. Women in the age bracket of 20 to 34 years acount for 57.3% of all women with births.
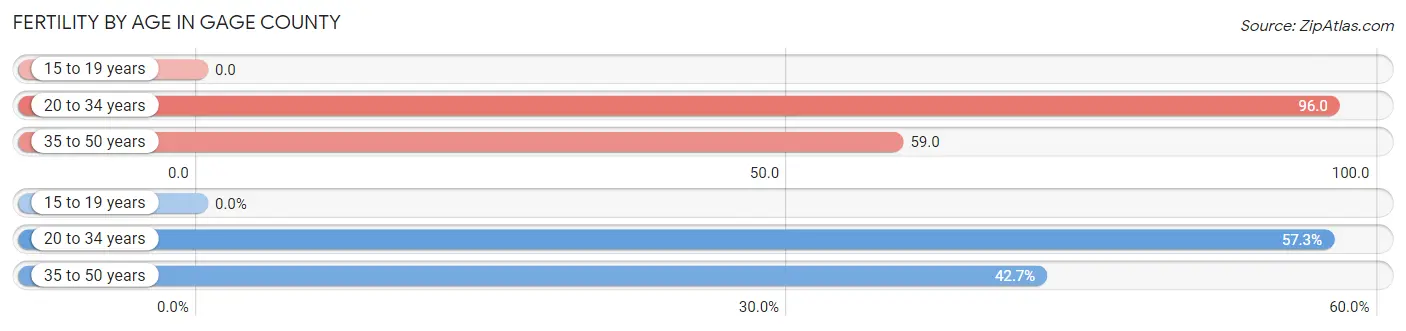
| Age Bracket | Women with Births | Births / 1,000 Women |
| 15 to 19 years | 0 (0.0%) | 0.0 |
| 20 to 34 years | 153 (57.3%) | 96.0 |
| 35 to 50 years | 114 (42.7%) | 59.0 |
| Total | 267 (100.0%) | 65.0 |
Fertility by Age by Marriage Status in Gage County
71.5% of women with births (267) in Gage County are married. The highest percentage of unmarried women with births falls into 35 to 50 years age bracket with 36.8% of them unmarried at the time of birth, while the lowest percentage of unmarried women with births belong to 20 to 34 years age bracket with 22.2% of them unmarried.
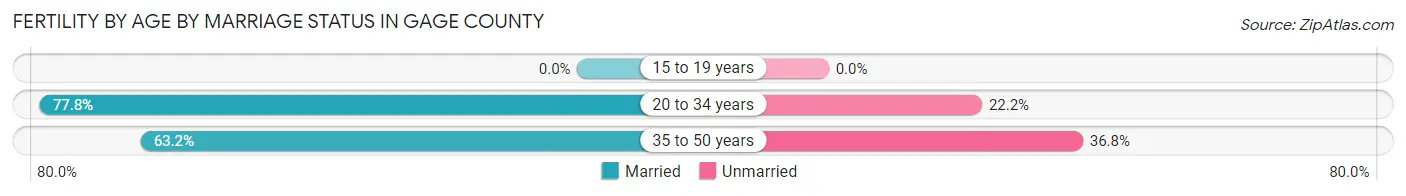
| Age Bracket | Married | Unmarried |
| 15 to 19 years | 0 (0.0%) | 0 (0.0%) |
| 20 to 34 years | 119 (77.8%) | 34 (22.2%) |
| 35 to 50 years | 72 (63.2%) | 42 (36.8%) |
| Total | 191 (71.5%) | 76 (28.5%) |
Fertility by Education in Gage County
Average fertility rate in Gage County is 65.0 births per 1,000 women. Women with the education attainment of graduate degree have the highest fertility rate of 90.0 births per 1,000 women, while women with the education attainment of less than high school have the lowest fertility at 2.0 births per 1,000 women. Women with the education attainment of college or associate's degree represent 46.8% of all women with births.
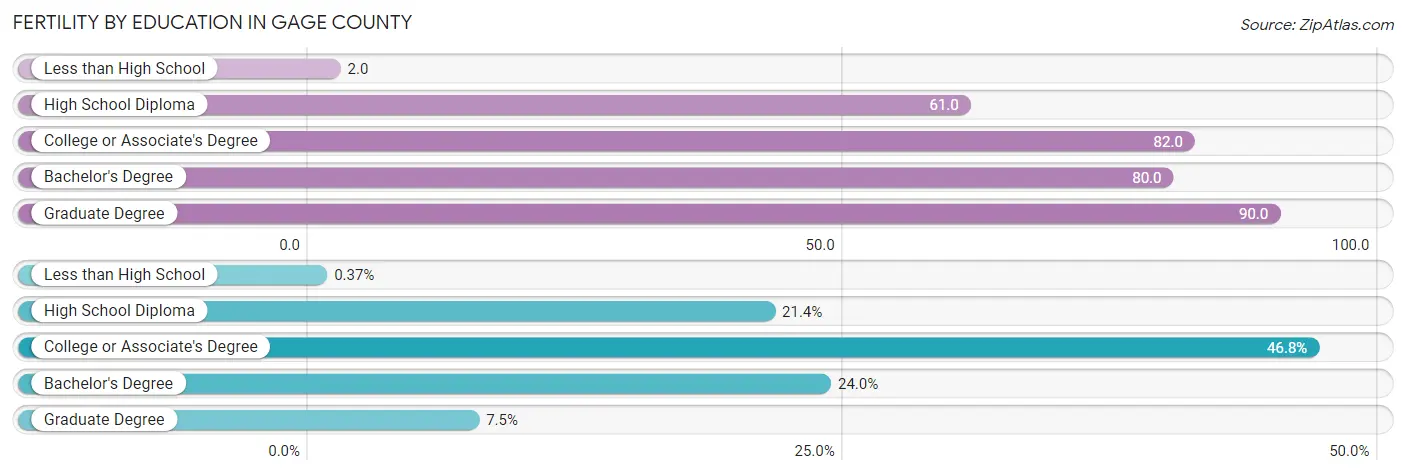
| Educational Attainment | Women with Births | Births / 1,000 Women |
| Less than High School | 1 (0.4%) | 2.0 |
| High School Diploma | 57 (21.3%) | 61.0 |
| College or Associate's Degree | 125 (46.8%) | 82.0 |
| Bachelor's Degree | 64 (24.0%) | 80.0 |
| Graduate Degree | 20 (7.5%) | 90.0 |
| Total | 267 (100.0%) | 65.0 |
Fertility by Education by Marriage Status in Gage County
28.5% of women with births in Gage County are unmarried. Women with the educational attainment of less than high school are most likely to be married with 100.0% of them married at childbirth, while women with the educational attainment of high school diploma are least likely to be married with 91.2% of them unmarried at childbirth.
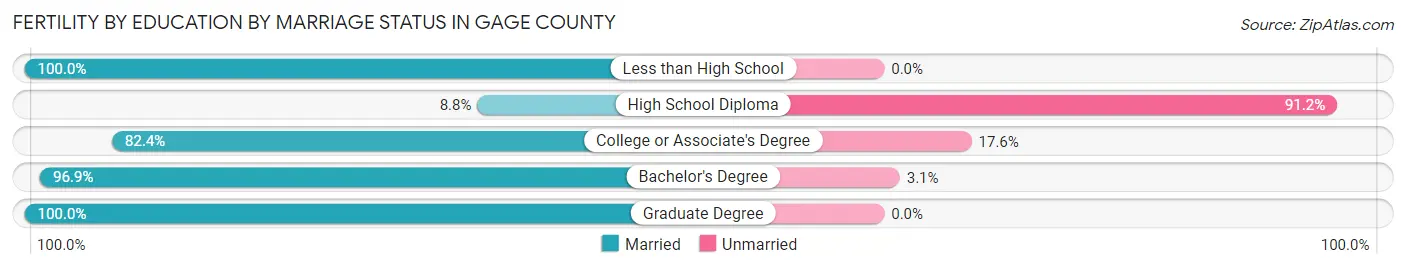
| Educational Attainment | Married | Unmarried |
| Less than High School | 1 (100.0%) | 0 (0.0%) |
| High School Diploma | 5 (8.8%) | 52 (91.2%) |
| College or Associate's Degree | 103 (82.4%) | 22 (17.6%) |
| Bachelor's Degree | 62 (96.9%) | 2 (3.1%) |
| Graduate Degree | 20 (100.0%) | 0 (0.0%) |
| Total | 191 (71.5%) | 76 (28.5%) |
Income in Gage County
Income Overview in Gage County
Per Capita Income in Gage County is $33,435, while median incomes of families and households are $82,708 and $60,035 respectively.
| Characteristic | Number | Measure |
| Per Capita Income | 21,654 | $33,435 |
| Median Family Income | 5,512 | $82,708 |
| Mean Family Income | 5,512 | $95,856 |
| Median Household Income | 9,154 | $60,035 |
| Mean Household Income | 9,154 | $75,952 |
| Income Deficit | 5,512 | $10,726 |
| Wage / Income Gap (%) | 21,654 | 32.28% |
| Wage / Income Gap ($) | 21,654 | 67.72¢ per $1 |
| Gini / Inequality Index | 21,654 | 0.44 |
Earnings by Sex in Gage County
Average Earnings in Gage County are $37,693, $44,628 for men and $30,223 for women, a difference of 32.3%.
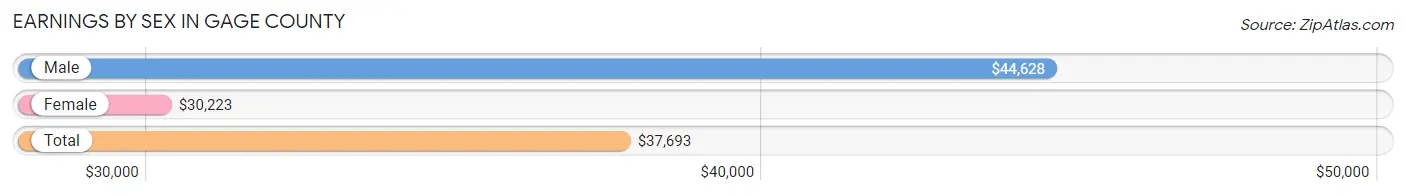
| Sex | Number | Average Earnings |
| Male | 6,264 (53.3%) | $44,628 |
| Female | 5,495 (46.7%) | $30,223 |
| Total | 11,759 (100.0%) | $37,693 |
Earnings by Sex by Income Bracket in Gage County
The most common earnings brackets in Gage County are $75,000 to $99,999 for men (779 | 12.4%) and $30,000 to $34,999 for women (441 | 8.0%).
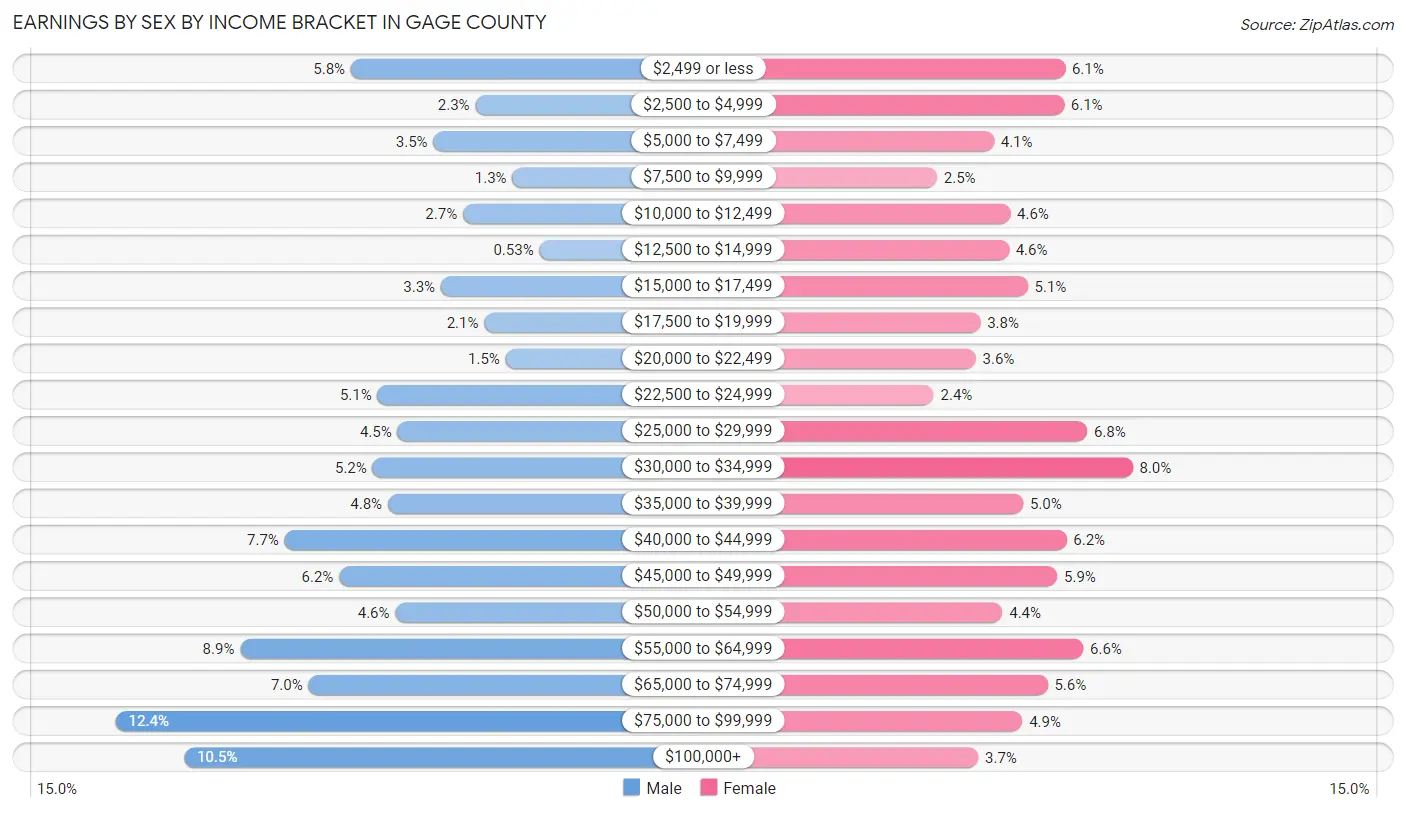
| Income | Male | Female |
| $2,499 or less | 365 (5.8%) | 337 (6.1%) |
| $2,500 to $4,999 | 146 (2.3%) | 335 (6.1%) |
| $5,000 to $7,499 | 220 (3.5%) | 227 (4.1%) |
| $7,500 to $9,999 | 81 (1.3%) | 139 (2.5%) |
| $10,000 to $12,499 | 168 (2.7%) | 252 (4.6%) |
| $12,500 to $14,999 | 33 (0.5%) | 250 (4.5%) |
| $15,000 to $17,499 | 207 (3.3%) | 279 (5.1%) |
| $17,500 to $19,999 | 130 (2.1%) | 206 (3.7%) |
| $20,000 to $22,499 | 93 (1.5%) | 199 (3.6%) |
| $22,500 to $24,999 | 318 (5.1%) | 134 (2.4%) |
| $25,000 to $29,999 | 283 (4.5%) | 371 (6.8%) |
| $30,000 to $34,999 | 327 (5.2%) | 441 (8.0%) |
| $35,000 to $39,999 | 300 (4.8%) | 272 (5.0%) |
| $40,000 to $44,999 | 482 (7.7%) | 339 (6.2%) |
| $45,000 to $49,999 | 386 (6.2%) | 325 (5.9%) |
| $50,000 to $54,999 | 287 (4.6%) | 240 (4.4%) |
| $55,000 to $64,999 | 560 (8.9%) | 365 (6.6%) |
| $65,000 to $74,999 | 440 (7.0%) | 310 (5.6%) |
| $75,000 to $99,999 | 779 (12.4%) | 271 (4.9%) |
| $100,000+ | 659 (10.5%) | 203 (3.7%) |
| Total | 6,264 (100.0%) | 5,495 (100.0%) |
Earnings by Sex by Educational Attainment in Gage County
Average earnings in Gage County are $51,201 for men and $34,050 for women, a difference of 33.5%. Men with an educational attainment of graduate degree enjoy the highest average annual earnings of $72,000, while those with less than high school education earn the least with $33,963. Women with an educational attainment of graduate degree earn the most with the average annual earnings of $69,345, while those with less than high school education have the smallest earnings of $17,669.
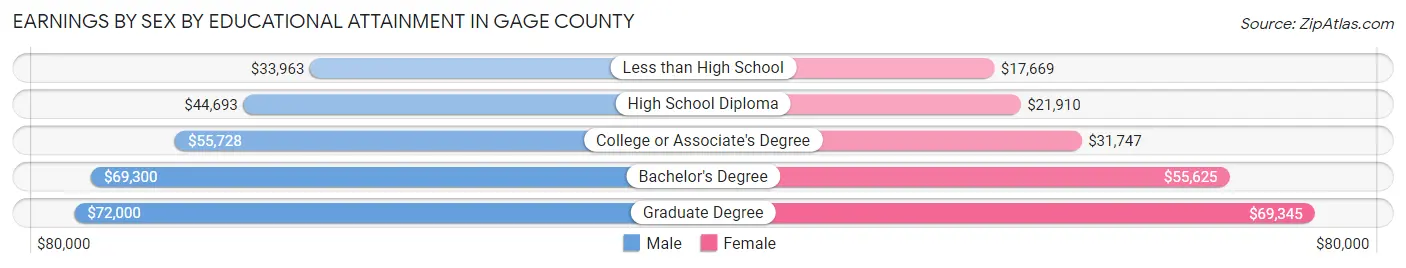
| Educational Attainment | Male Income | Female Income |
| Less than High School | $33,963 | $17,669 |
| High School Diploma | $44,693 | $21,910 |
| College or Associate's Degree | $55,728 | $31,747 |
| Bachelor's Degree | $69,300 | $55,625 |
| Graduate Degree | $72,000 | $69,345 |
| Total | $51,201 | $34,050 |
Family Income in Gage County
Family Income Brackets in Gage County
According to the Gage County family income data, there are 1,218 families falling into the $100,000 to $149,999 income range, which is the most common income bracket and makes up 22.1% of all families. Conversely, the $10,000 to $14,999 income bracket is the least frequent group with only 66 families (1.2%) belonging to this category.
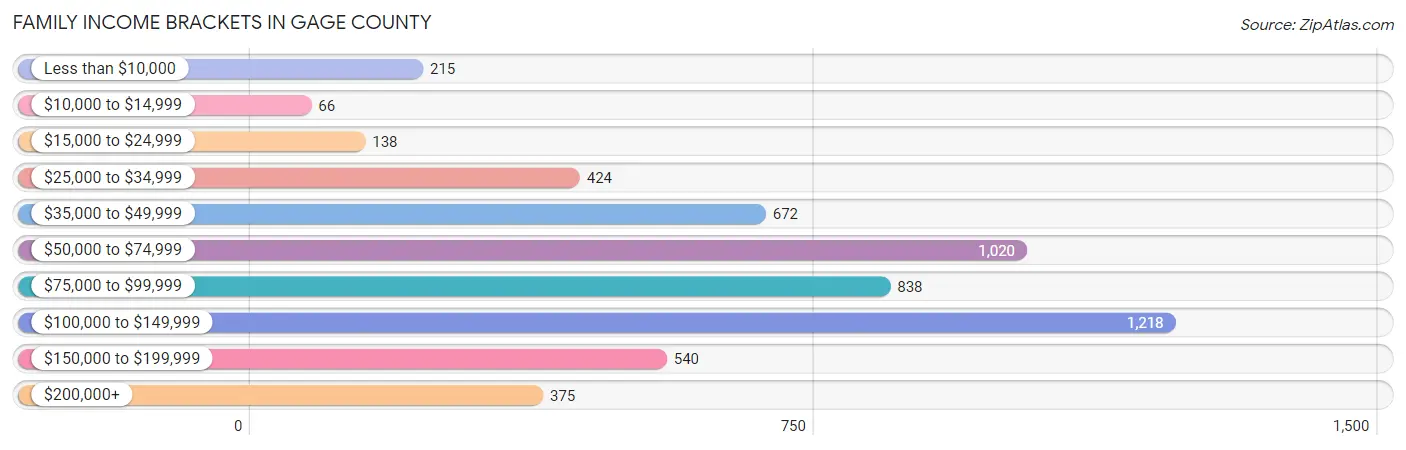
| Income Bracket | # Families | % Families |
| Less than $10,000 | 215 | 3.9% |
| $10,000 to $14,999 | 66 | 1.2% |
| $15,000 to $24,999 | 138 | 2.5% |
| $25,000 to $34,999 | 424 | 7.7% |
| $35,000 to $49,999 | 672 | 12.2% |
| $50,000 to $74,999 | 1,020 | 18.5% |
| $75,000 to $99,999 | 838 | 15.2% |
| $100,000 to $149,999 | 1,218 | 22.1% |
| $150,000 to $199,999 | 540 | 9.8% |
| $200,000+ | 375 | 6.8% |
Family Income by Famaliy Size in Gage County
7+ person families (35 | 0.6%) account for the highest median family income in Gage County with $160,865 per family, while 2-person families (3,159 | 57.3%) have the highest median income of $36,136 per family member.
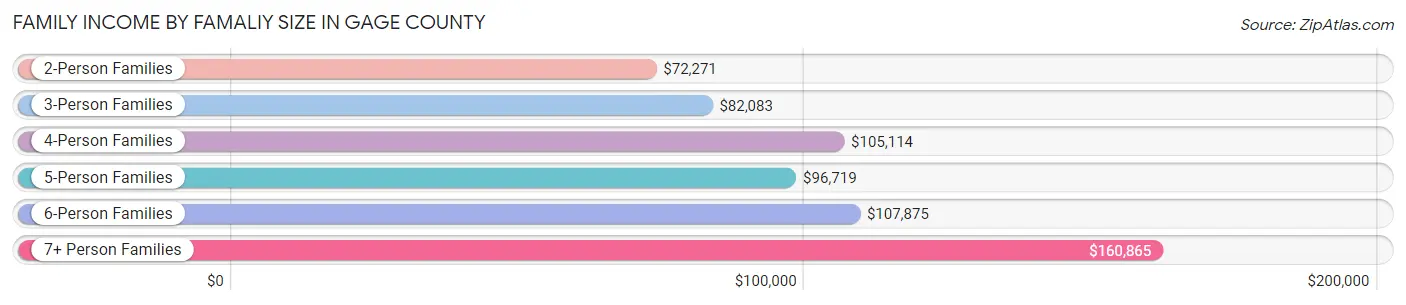
| Income Bracket | # Families | Median Income |
| 2-Person Families | 3,159 (57.3%) | $72,271 |
| 3-Person Families | 918 (16.7%) | $82,083 |
| 4-Person Families | 853 (15.5%) | $105,114 |
| 5-Person Families | 374 (6.8%) | $96,719 |
| 6-Person Families | 173 (3.1%) | $107,875 |
| 7+ Person Families | 35 (0.6%) | $160,865 |
| Total | 5,512 (100.0%) | $82,708 |
Family Income by Number of Earners in Gage County
The median family income in Gage County is $82,708, with families comprising 3+ earners (438) having the highest median family income of $141,364, while families with no earners (806) have the lowest median family income of $41,389, accounting for 8.0% and 14.6% of families, respectively.
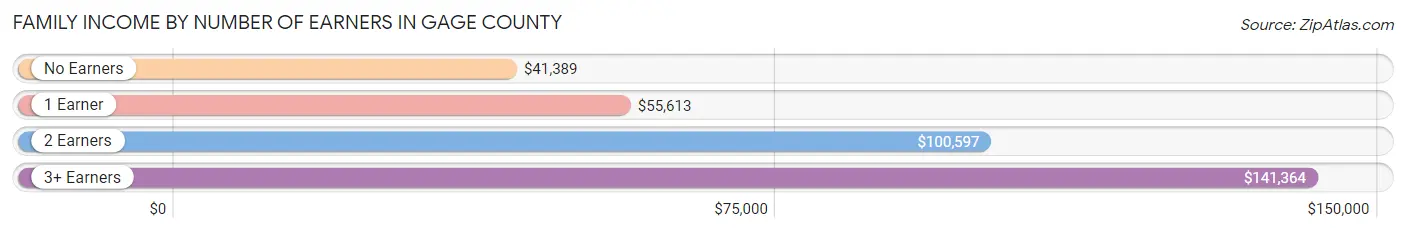
| Number of Earners | # Families | Median Income |
| No Earners | 806 (14.6%) | $41,389 |
| 1 Earner | 1,430 (25.9%) | $55,613 |
| 2 Earners | 2,838 (51.5%) | $100,597 |
| 3+ Earners | 438 (8.0%) | $141,364 |
| Total | 5,512 (100.0%) | $82,708 |
Household Income in Gage County
Household Income Brackets in Gage County
With 1,666 households falling in the category, the $50,000 to $74,999 income range is the most frequent in Gage County, accounting for 18.2% of all households. In contrast, only 412 households (4.5%) fall into the $10,000 to $14,999 income bracket, making it the least populous group.
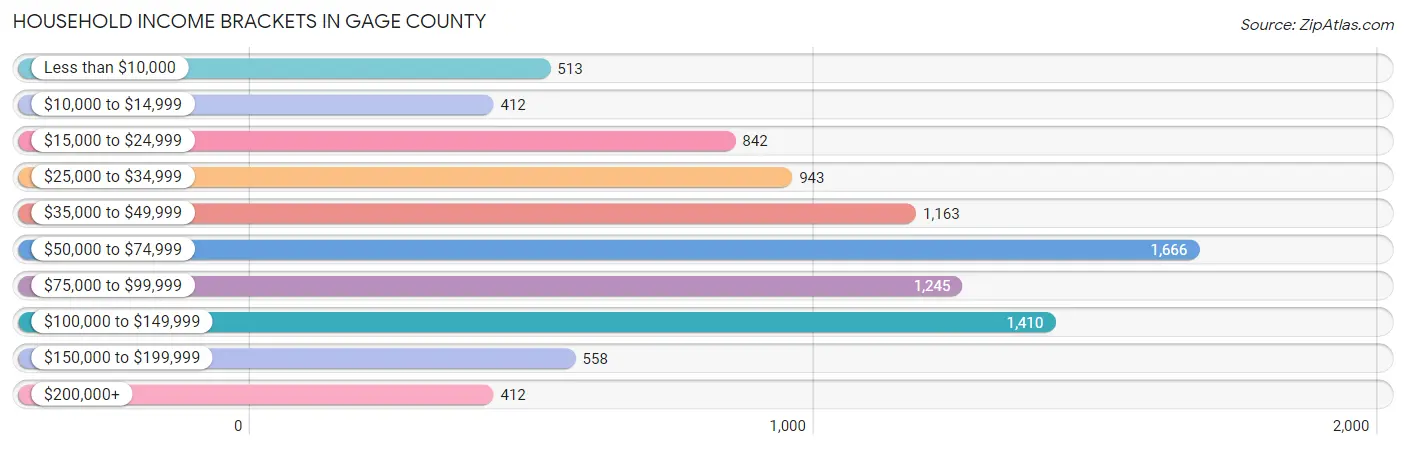
| Income Bracket | # Households | % Households |
| Less than $10,000 | 513 | 5.6% |
| $10,000 to $14,999 | 412 | 4.5% |
| $15,000 to $24,999 | 842 | 9.2% |
| $25,000 to $34,999 | 943 | 10.3% |
| $35,000 to $49,999 | 1,163 | 12.7% |
| $50,000 to $74,999 | 1,666 | 18.2% |
| $75,000 to $99,999 | 1,245 | 13.6% |
| $100,000 to $149,999 | 1,410 | 15.4% |
| $150,000 to $199,999 | 558 | 6.1% |
| $200,000+ | 412 | 4.5% |
Household Income by Householder Age in Gage County
The median household income in Gage County is $60,035, with the highest median household income of $73,795 found in the 45 to 64 years age bracket for the primary householder. A total of 3,305 households (36.1%) fall into this category. Meanwhile, the 15 to 24 years age bracket for the primary householder has the lowest median household income of $31,510, with 334 households (3.6%) in this group.
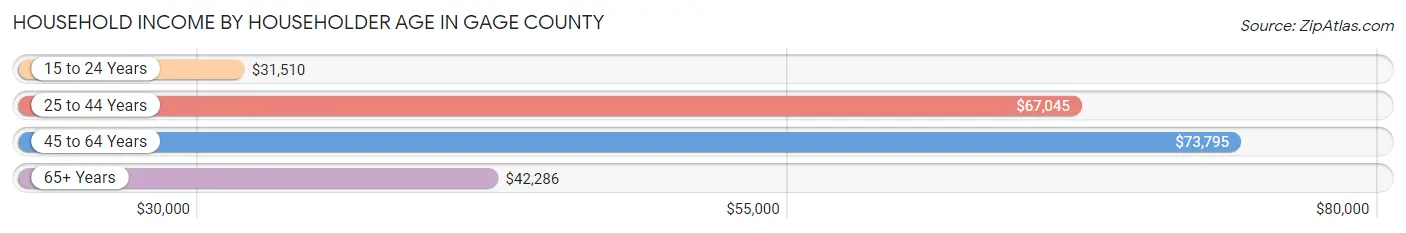
| Income Bracket | # Households | Median Income |
| 15 to 24 Years | 334 (3.6%) | $31,510 |
| 25 to 44 Years | 2,450 (26.8%) | $67,045 |
| 45 to 64 Years | 3,305 (36.1%) | $73,795 |
| 65+ Years | 3,065 (33.5%) | $42,286 |
| Total | 9,154 (100.0%) | $60,035 |
Poverty in Gage County
Income Below Poverty by Sex and Age in Gage County
With 10.9% poverty level for males and 15.9% for females among the residents of Gage County, under 5 year old males and under 5 year old females are the most vulnerable to poverty, with 154 males (24.6%) and 164 females (29.8%) in their respective age groups living below the poverty level.
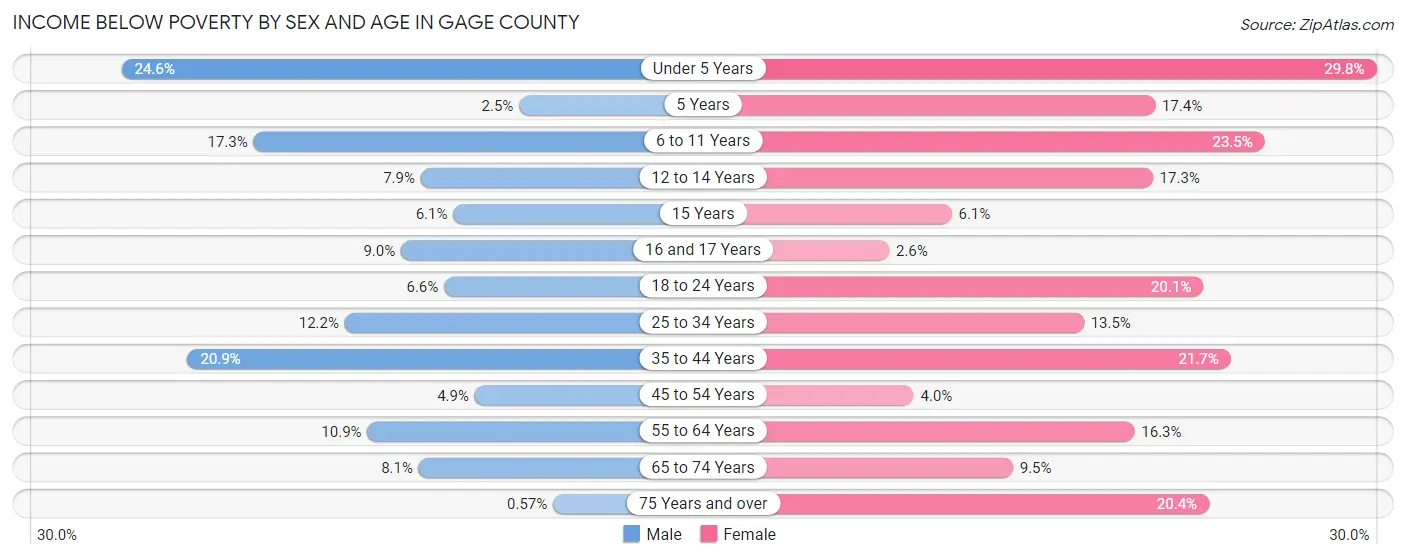
| Age Bracket | Male | Female |
| Under 5 Years | 154 (24.6%) | 164 (29.8%) |
| 5 Years | 3 (2.5%) | 30 (17.4%) |
| 6 to 11 Years | 139 (17.2%) | 161 (23.5%) |
| 12 to 14 Years | 34 (7.9%) | 76 (17.3%) |
| 15 Years | 10 (6.1%) | 8 (6.1%) |
| 16 and 17 Years | 32 (9.0%) | 7 (2.6%) |
| 18 to 24 Years | 60 (6.6%) | 139 (20.1%) |
| 25 to 34 Years | 138 (12.2%) | 148 (13.5%) |
| 35 to 44 Years | 270 (20.9%) | 262 (21.6%) |
| 45 to 54 Years | 63 (4.9%) | 49 (4.0%) |
| 55 to 64 Years | 174 (10.9%) | 277 (16.3%) |
| 65 to 74 Years | 99 (8.1%) | 112 (9.5%) |
| 75 Years and over | 5 (0.6%) | 221 (20.4%) |
| Total | 1,181 (10.9%) | 1,654 (15.9%) |
Income Above Poverty by Sex and Age in Gage County
According to the poverty statistics in Gage County, males aged 75 years and over and females aged 16 and 17 years are the age groups that are most secure financially, with 99.4% of males and 97.4% of females in these age groups living above the poverty line.
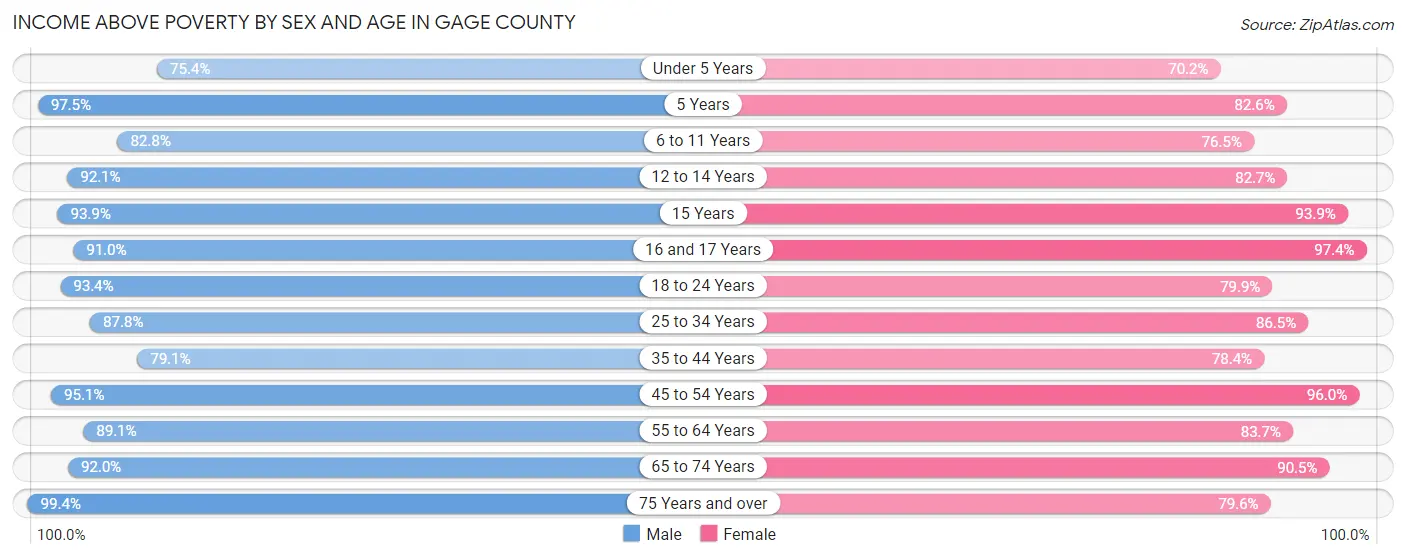
| Age Bracket | Male | Female |
| Under 5 Years | 472 (75.4%) | 387 (70.2%) |
| 5 Years | 119 (97.5%) | 142 (82.6%) |
| 6 to 11 Years | 667 (82.8%) | 523 (76.5%) |
| 12 to 14 Years | 394 (92.1%) | 363 (82.7%) |
| 15 Years | 153 (93.9%) | 123 (93.9%) |
| 16 and 17 Years | 322 (91.0%) | 259 (97.4%) |
| 18 to 24 Years | 843 (93.4%) | 552 (79.9%) |
| 25 to 34 Years | 996 (87.8%) | 951 (86.5%) |
| 35 to 44 Years | 1,020 (79.1%) | 948 (78.3%) |
| 45 to 54 Years | 1,216 (95.1%) | 1,175 (96.0%) |
| 55 to 64 Years | 1,421 (89.1%) | 1,423 (83.7%) |
| 65 to 74 Years | 1,131 (91.9%) | 1,065 (90.5%) |
| 75 Years and over | 873 (99.4%) | 860 (79.6%) |
| Total | 9,627 (89.1%) | 8,771 (84.1%) |
Income Below Poverty Among Married-Couple Families in Gage County
The poverty statistics for married-couple families in Gage County show that 4.8% or 214 of the total 4,425 families live below the poverty line. Families with 3 or 4 children have the highest poverty rate of 20.3%, comprising of 80 families. On the other hand, families with 5 or more children have the lowest poverty rate of 0.0%, which includes 0 families.
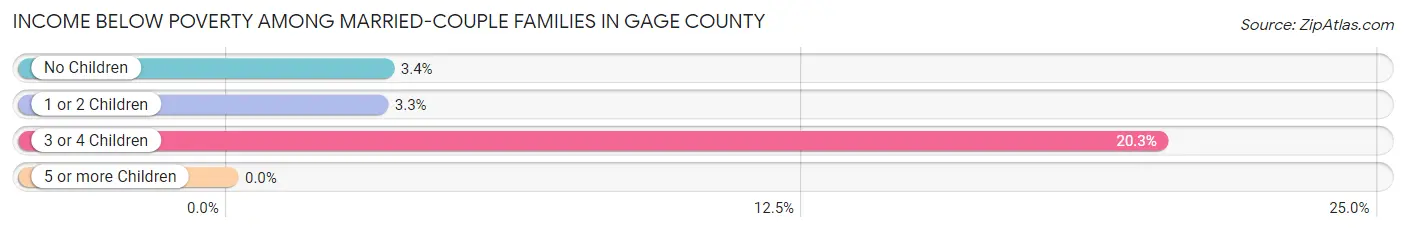
| Children | Above Poverty | Below Poverty |
| No Children | 2,710 (96.6%) | 95 (3.4%) |
| 1 or 2 Children | 1,159 (96.7%) | 39 (3.3%) |
| 3 or 4 Children | 315 (79.7%) | 80 (20.3%) |
| 5 or more Children | 27 (100.0%) | 0 (0.0%) |
| Total | 4,211 (95.2%) | 214 (4.8%) |
Income Below Poverty Among Single-Parent Households in Gage County
According to the poverty data in Gage County, 11.5% or 45 single-father households and 32.3% or 225 single-mother households are living below the poverty line. Among single-father households, those with 3 or 4 children have the highest poverty rate, with 2 households (22.2%) experiencing poverty. Likewise, among single-mother households, those with 3 or 4 children have the highest poverty rate, with 108 households (69.2%) falling below the poverty line.
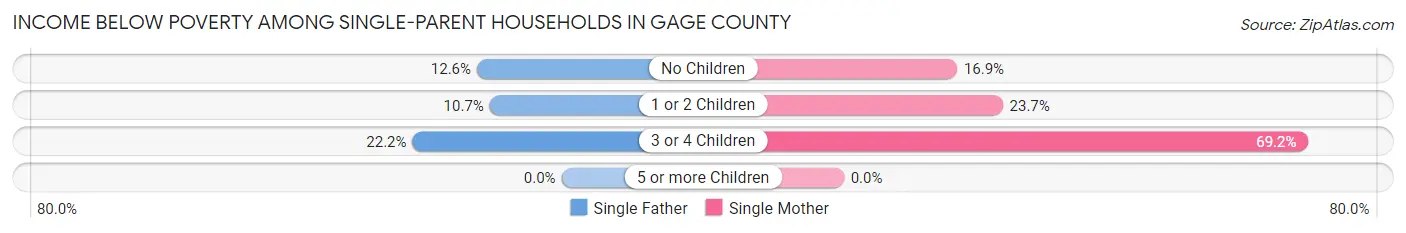
| Children | Single Father | Single Mother |
| No Children | 14 (12.6%) | 27 (16.9%) |
| 1 or 2 Children | 29 (10.7%) | 90 (23.7%) |
| 3 or 4 Children | 2 (22.2%) | 108 (69.2%) |
| 5 or more Children | 0 (0.0%) | 0 (0.0%) |
| Total | 45 (11.5%) | 225 (32.3%) |
Income Below Poverty Among Married-Couple vs Single-Parent Households in Gage County
The poverty data for Gage County shows that 214 of the married-couple family households (4.8%) and 270 of the single-parent households (24.8%) are living below the poverty level. Within the married-couple family households, those with 3 or 4 children have the highest poverty rate, with 80 households (20.3%) falling below the poverty line. Among the single-parent households, those with 3 or 4 children have the highest poverty rate, with 110 household (66.7%) living below poverty.
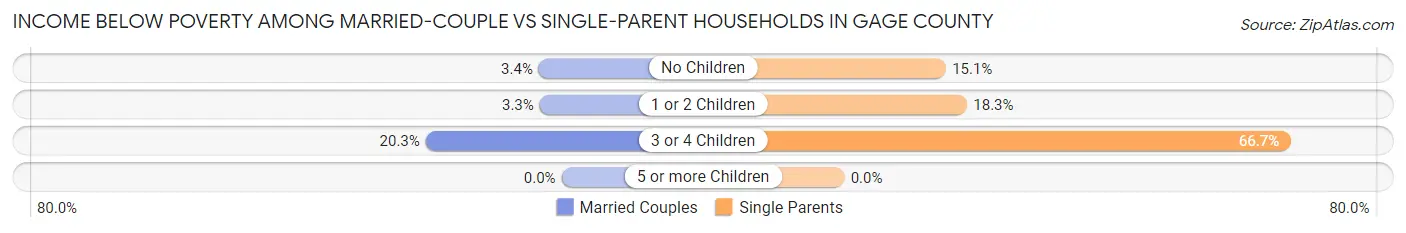
| Children | Married-Couple Families | Single-Parent Households |
| No Children | 95 (3.4%) | 41 (15.1%) |
| 1 or 2 Children | 39 (3.3%) | 119 (18.3%) |
| 3 or 4 Children | 80 (20.3%) | 110 (66.7%) |
| 5 or more Children | 0 (0.0%) | 0 (0.0%) |
| Total | 214 (4.8%) | 270 (24.8%) |
Employment Characteristics in Gage County
Employment by Class of Employer in Gage County
Among the 10,513 employed individuals in Gage County, private company employees (6,450 | 61.4%), not-for-profit organizations (1,105 | 10.5%), and self-employed (not incorporated) (865 | 8.2%) make up the most common classes of employment.
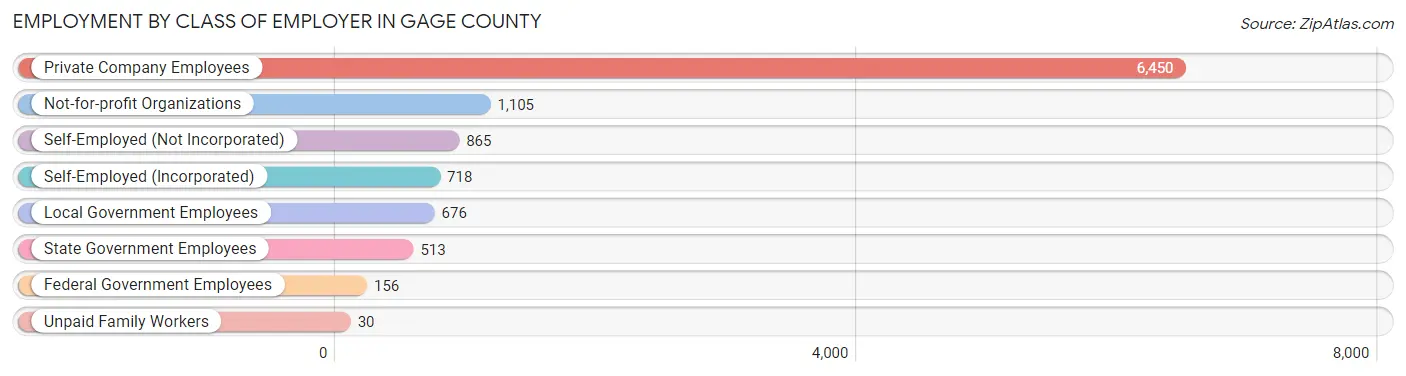
| Employer Class | # Employees | % Employees |
| Private Company Employees | 6,450 | 61.4% |
| Self-Employed (Incorporated) | 718 | 6.8% |
| Self-Employed (Not Incorporated) | 865 | 8.2% |
| Not-for-profit Organizations | 1,105 | 10.5% |
| Local Government Employees | 676 | 6.4% |
| State Government Employees | 513 | 4.9% |
| Federal Government Employees | 156 | 1.5% |
| Unpaid Family Workers | 30 | 0.3% |
| Total | 10,513 | 100.0% |
Employment Status by Age in Gage County
According to the labor force statistics for Gage County, out of the total population over 16 years of age (17,382), 63.4% or 11,020 individuals are in the labor force, with 2.0% or 220 of them unemployed. The age group with the highest labor force participation rate is 45 to 54 years, with 91.9% or 2,301 individuals in the labor force. Within the labor force, the 20 to 24 years age range has the highest percentage of unemployed individuals, with 5.9% or 57 of them being unemployed.
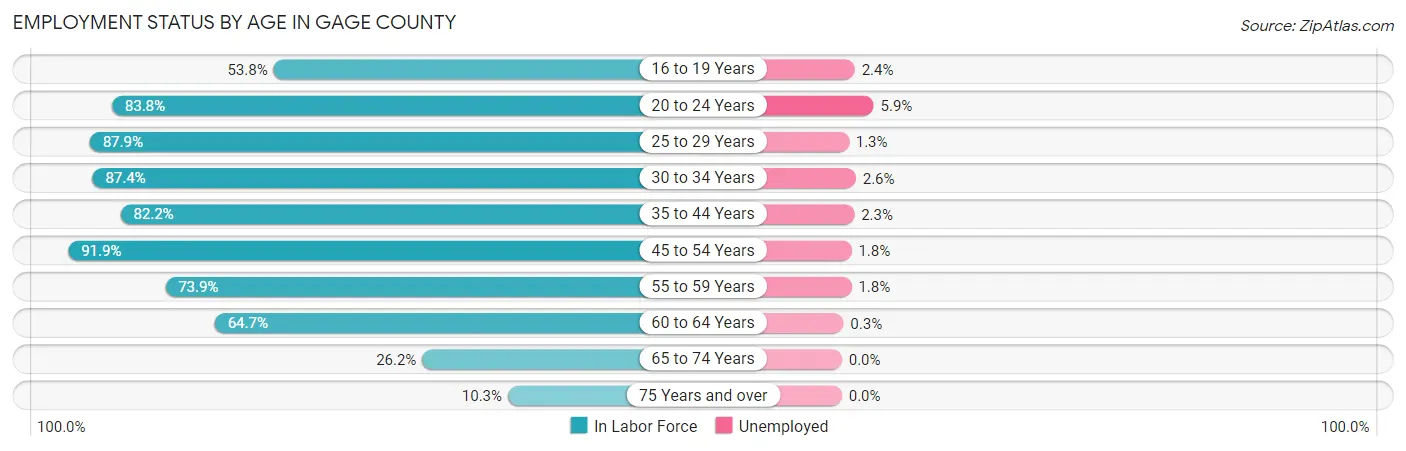
| Age Bracket | In Labor Force | Unemployed |
| 16 to 19 Years | 572 (53.8%) | 14 (2.4%) |
| 20 to 24 Years | 965 (83.8%) | 57 (5.9%) |
| 25 to 29 Years | 951 (87.9%) | 12 (1.3%) |
| 30 to 34 Years | 1,010 (87.4%) | 26 (2.6%) |
| 35 to 44 Years | 2,056 (82.2%) | 47 (2.3%) |
| 45 to 54 Years | 2,301 (91.9%) | 41 (1.8%) |
| 55 to 59 Years | 1,284 (73.9%) | 23 (1.8%) |
| 60 to 64 Years | 1,010 (64.7%) | 3 (0.3%) |
| 65 to 74 Years | 640 (26.2%) | 0 (0.0%) |
| 75 Years and over | 225 (10.3%) | 0 (0.0%) |
| Total | 11,020 (63.4%) | 220 (2.0%) |
Employment Status by Educational Attainment in Gage County
According to labor force statistics for Gage County, 81.7% of individuals (8,613) out of the total population between 25 and 64 years of age (10,542) are in the labor force, with 1.8% or 155 of them being unemployed. The group with the highest labor force participation rate are those with the educational attainment of bachelor's degree or higher, with 91.5% or 2,120 individuals in the labor force. Within the labor force, individuals with high school diploma education have the highest percentage of unemployment, with 2.4% or 69 of them being unemployed.
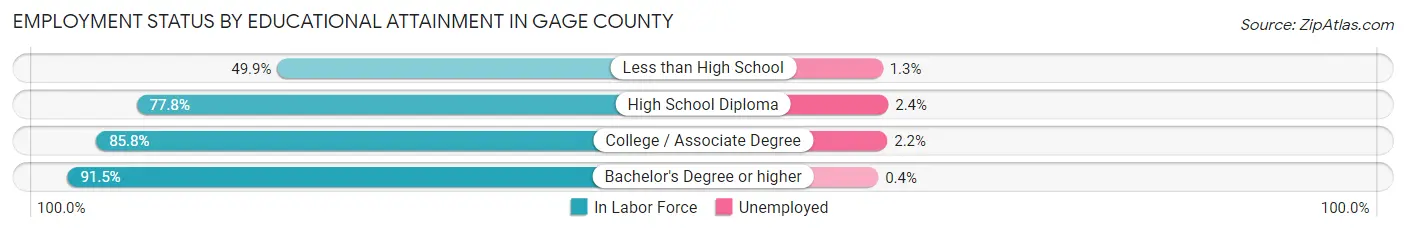
| Educational Attainment | In Labor Force | Unemployed |
| Less than High School | 371 (49.9%) | 10 (1.3%) |
| High School Diploma | 2,882 (77.8%) | 89 (2.4%) |
| College / Associate Degree | 3,241 (85.8%) | 83 (2.2%) |
| Bachelor's Degree or higher | 2,120 (91.5%) | 9 (0.4%) |
| Total | 8,613 (81.7%) | 190 (1.8%) |
Employment Occupations by Sex in Gage County
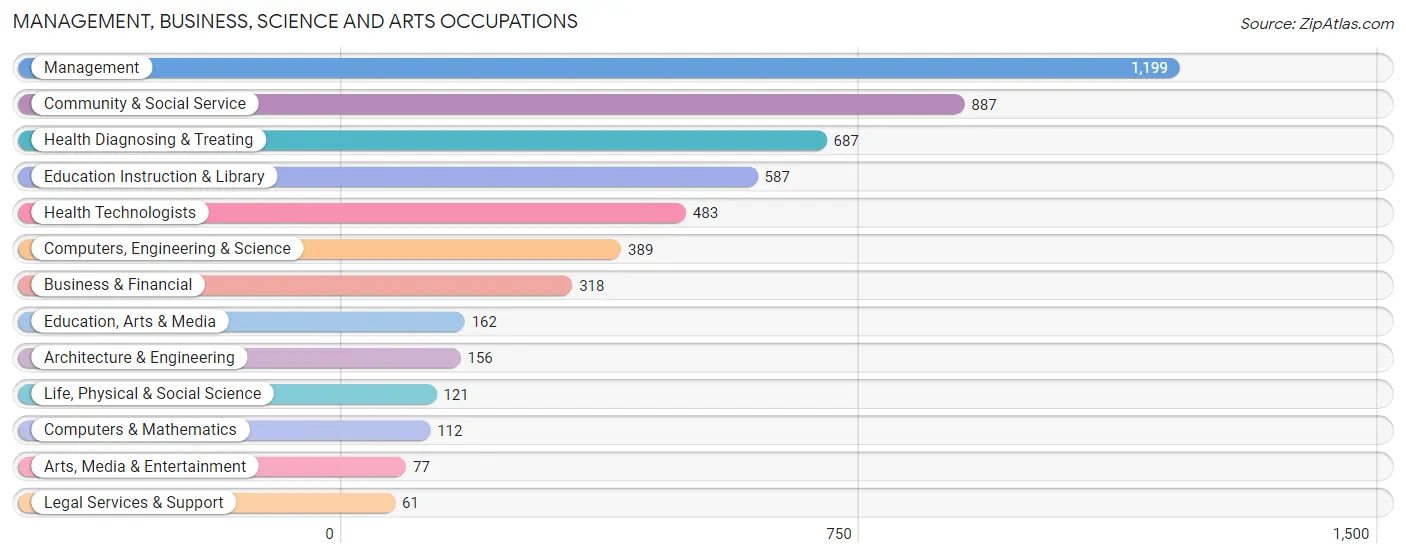
Management, Business, Science and Arts Occupations
The most common Management, Business, Science and Arts occupations in Gage County are Management (1,199 | 11.1%), Community & Social Service (887 | 8.2%), Health Diagnosing & Treating (687 | 6.4%), Education Instruction & Library (587 | 5.4%), and Health Technologists (483 | 4.5%).
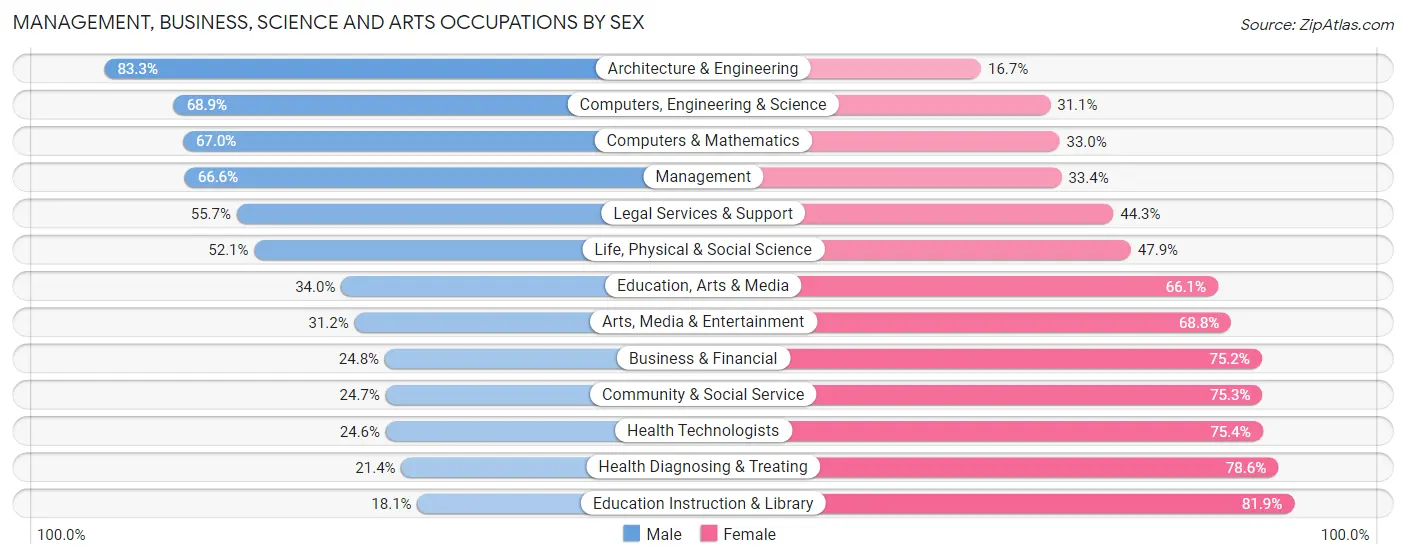
Management, Business, Science and Arts Occupations by Sex
Within the Management, Business, Science and Arts occupations in Gage County, the most male-oriented occupations are Architecture & Engineering (83.3%), Computers, Engineering & Science (68.9%), and Computers & Mathematics (67.0%), while the most female-oriented occupations are Education Instruction & Library (81.9%), Health Diagnosing & Treating (78.6%), and Health Technologists (75.4%).
| Occupation | Male | Female |
| Management | 798 (66.6%) | 401 (33.4%) |
| Business & Financial | 79 (24.8%) | 239 (75.2%) |
| Computers, Engineering & Science | 268 (68.9%) | 121 (31.1%) |
| Computers & Mathematics | 75 (67.0%) | 37 (33.0%) |
| Architecture & Engineering | 130 (83.3%) | 26 (16.7%) |
| Life, Physical & Social Science | 63 (52.1%) | 58 (47.9%) |
| Community & Social Service | 219 (24.7%) | 668 (75.3%) |
| Education, Arts & Media | 55 (34.0%) | 107 (66.0%) |
| Legal Services & Support | 34 (55.7%) | 27 (44.3%) |
| Education Instruction & Library | 106 (18.1%) | 481 (81.9%) |
| Arts, Media & Entertainment | 24 (31.2%) | 53 (68.8%) |
| Health Diagnosing & Treating | 147 (21.4%) | 540 (78.6%) |
| Health Technologists | 119 (24.6%) | 364 (75.4%) |
| Total (Category) | 1,511 (43.4%) | 1,969 (56.6%) |
| Total (Overall) | 5,684 (52.7%) | 5,097 (47.3%) |
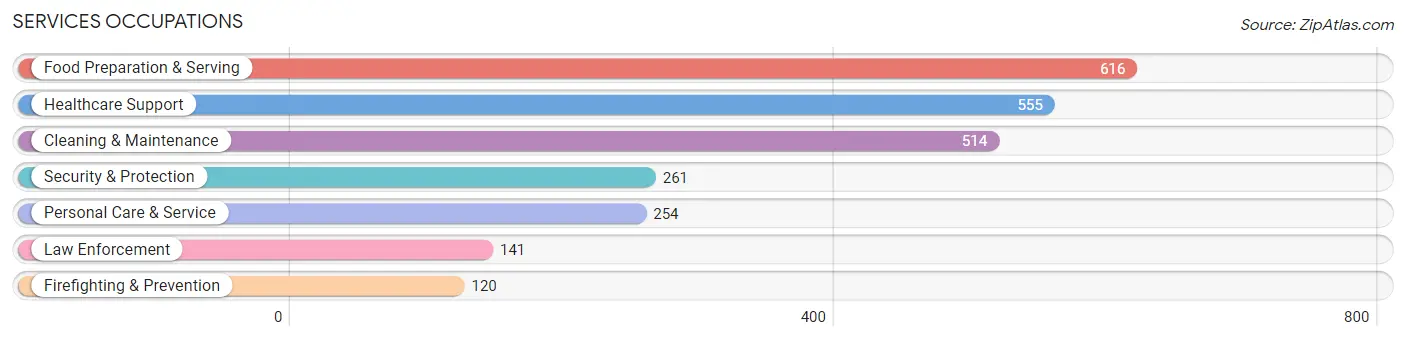
Services Occupations
The most common Services occupations in Gage County are Food Preparation & Serving (616 | 5.7%), Healthcare Support (555 | 5.1%), Cleaning & Maintenance (514 | 4.8%), Security & Protection (261 | 2.4%), and Personal Care & Service (254 | 2.4%).
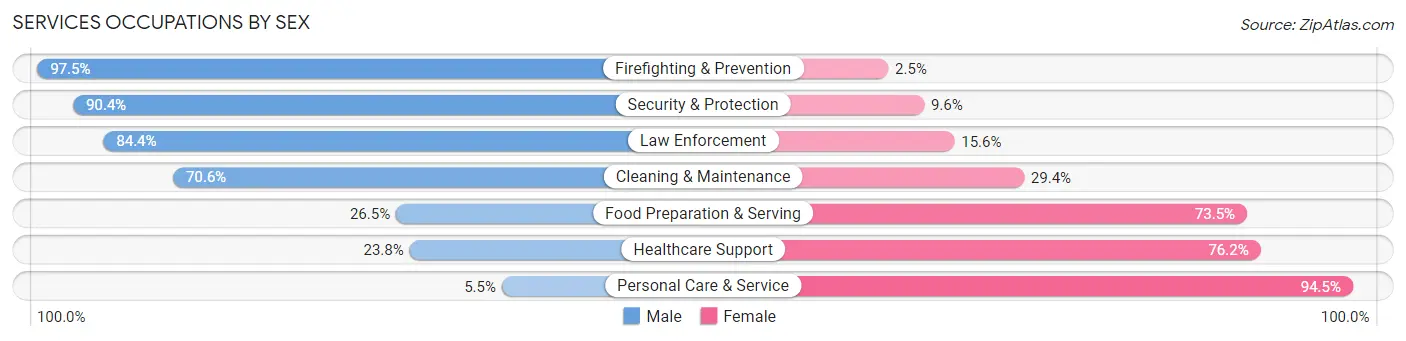
Services Occupations by Sex
Within the Services occupations in Gage County, the most male-oriented occupations are Firefighting & Prevention (97.5%), Security & Protection (90.4%), and Law Enforcement (84.4%), while the most female-oriented occupations are Personal Care & Service (94.5%), Healthcare Support (76.2%), and Food Preparation & Serving (73.5%).
| Occupation | Male | Female |
| Healthcare Support | 132 (23.8%) | 423 (76.2%) |
| Security & Protection | 236 (90.4%) | 25 (9.6%) |
| Firefighting & Prevention | 117 (97.5%) | 3 (2.5%) |
| Law Enforcement | 119 (84.4%) | 22 (15.6%) |
| Food Preparation & Serving | 163 (26.5%) | 453 (73.5%) |
| Cleaning & Maintenance | 363 (70.6%) | 151 (29.4%) |
| Personal Care & Service | 14 (5.5%) | 240 (94.5%) |
| Total (Category) | 908 (41.3%) | 1,292 (58.7%) |
| Total (Overall) | 5,684 (52.7%) | 5,097 (47.3%) |
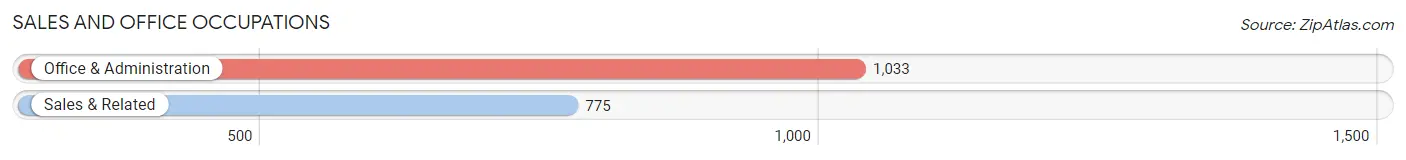
Sales and Office Occupations
The most common Sales and Office occupations in Gage County are Office & Administration (1,033 | 9.6%), and Sales & Related (775 | 7.2%).
Sales and Office Occupations by Sex
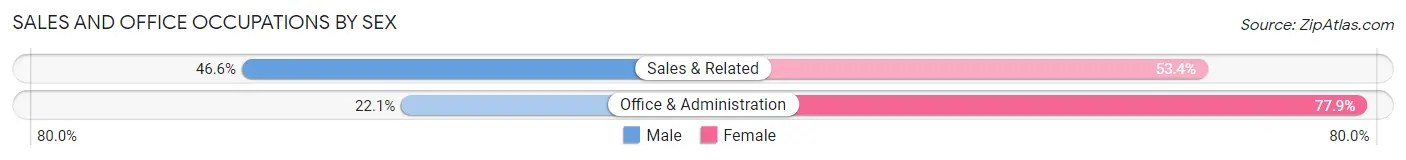
| Occupation | Male | Female |
| Sales & Related | 361 (46.6%) | 414 (53.4%) |
| Office & Administration | 228 (22.1%) | 805 (77.9%) |
| Total (Category) | 589 (32.6%) | 1,219 (67.4%) |
| Total (Overall) | 5,684 (52.7%) | 5,097 (47.3%) |
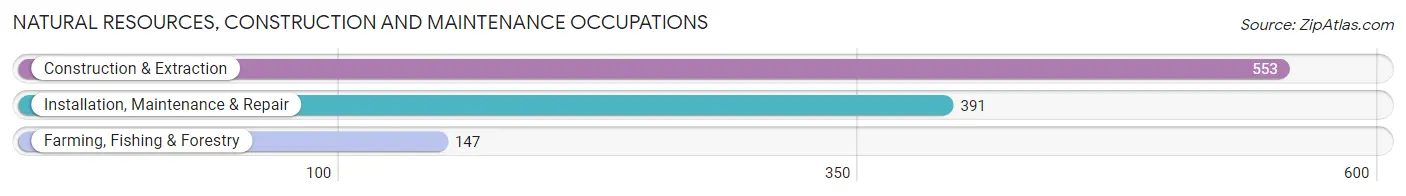
Natural Resources, Construction and Maintenance Occupations
The most common Natural Resources, Construction and Maintenance occupations in Gage County are Construction & Extraction (553 | 5.1%), Installation, Maintenance & Repair (391 | 3.6%), and Farming, Fishing & Forestry (147 | 1.4%).
Natural Resources, Construction and Maintenance Occupations by Sex
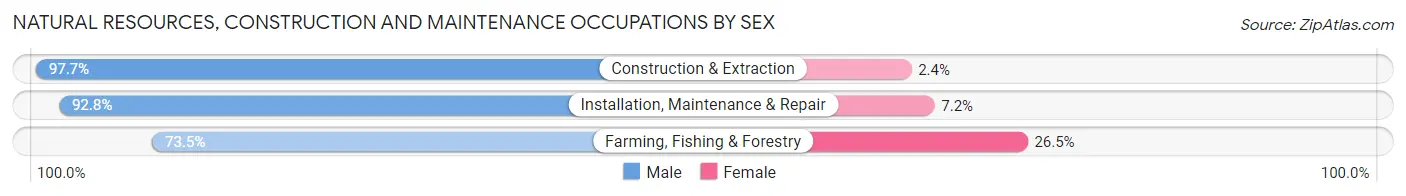
| Occupation | Male | Female |
| Farming, Fishing & Forestry | 108 (73.5%) | 39 (26.5%) |
| Construction & Extraction | 540 (97.7%) | 13 (2.4%) |
| Installation, Maintenance & Repair | 363 (92.8%) | 28 (7.2%) |
| Total (Category) | 1,011 (92.7%) | 80 (7.3%) |
| Total (Overall) | 5,684 (52.7%) | 5,097 (47.3%) |
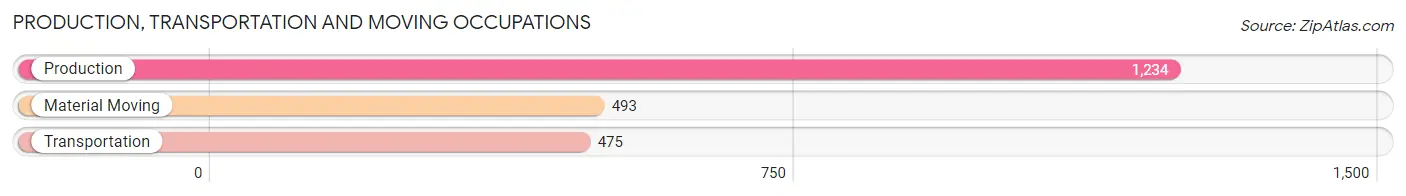
Production, Transportation and Moving Occupations
The most common Production, Transportation and Moving occupations in Gage County are Production (1,234 | 11.5%), Material Moving (493 | 4.6%), and Transportation (475 | 4.4%).
Production, Transportation and Moving Occupations by Sex
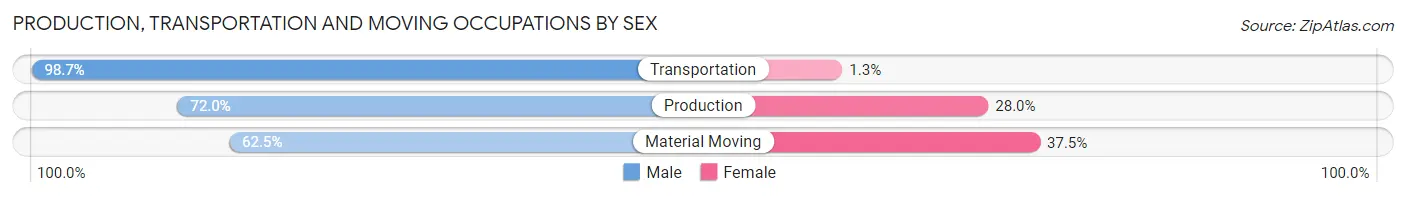
| Occupation | Male | Female |
| Production | 888 (72.0%) | 346 (28.0%) |
| Transportation | 469 (98.7%) | 6 (1.3%) |
| Material Moving | 308 (62.5%) | 185 (37.5%) |
| Total (Category) | 1,665 (75.6%) | 537 (24.4%) |
| Total (Overall) | 5,684 (52.7%) | 5,097 (47.3%) |
Employment Industries by Sex in Gage County
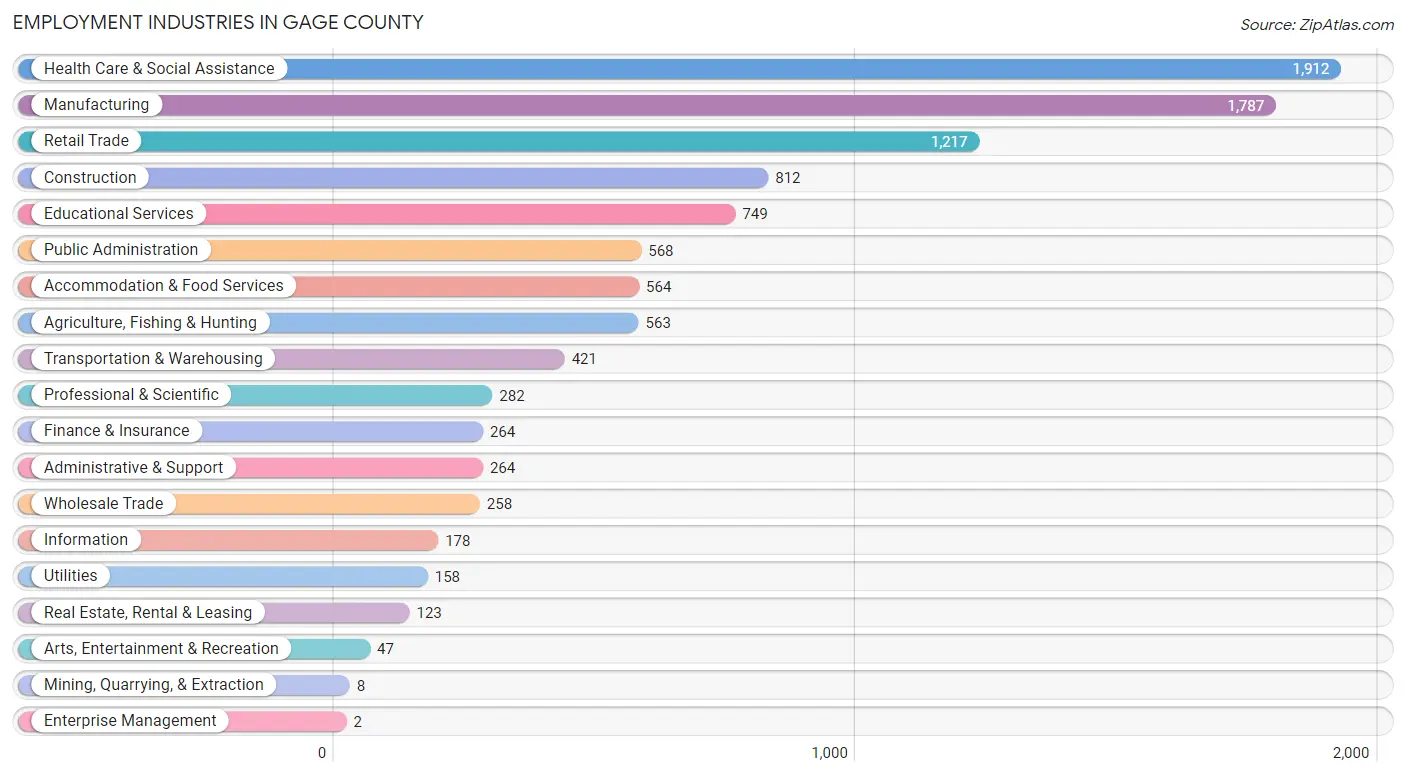
Employment Industries in Gage County
The major employment industries in Gage County include Health Care & Social Assistance (1,912 | 17.7%), Manufacturing (1,787 | 16.6%), Retail Trade (1,217 | 11.3%), Construction (812 | 7.5%), and Educational Services (749 | 7.0%).
Employment Industries by Sex in Gage County
The Gage County industries that see more men than women are Mining, Quarrying, & Extraction (100.0%), Enterprise Management (100.0%), and Construction (87.0%), whereas the industries that tend to have a higher number of women are Finance & Insurance (84.5%), Health Care & Social Assistance (84.0%), and Educational Services (72.8%).
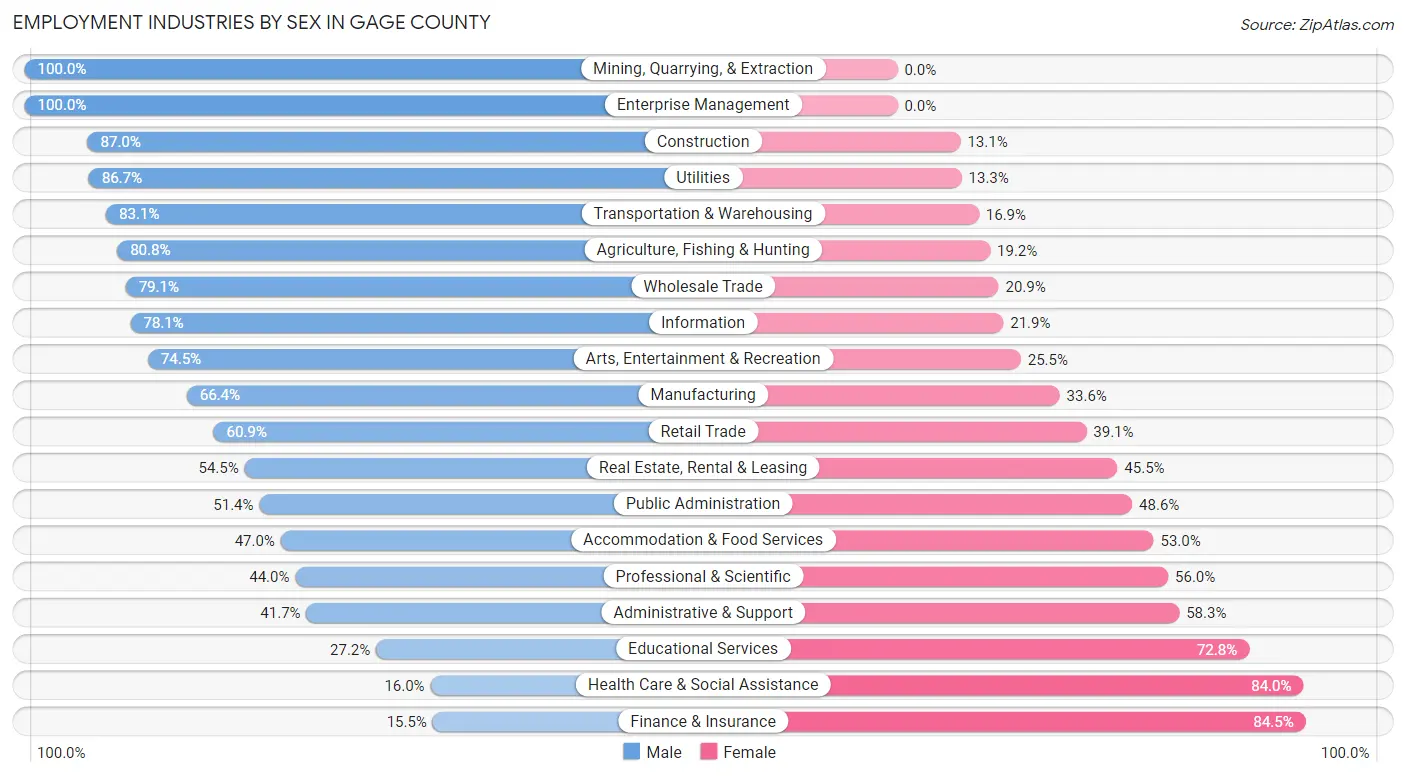
| Industry | Male | Female |
| Agriculture, Fishing & Hunting | 455 (80.8%) | 108 (19.2%) |
| Mining, Quarrying, & Extraction | 8 (100.0%) | 0 (0.0%) |
| Construction | 706 (87.0%) | 106 (13.1%) |
| Manufacturing | 1,187 (66.4%) | 600 (33.6%) |
| Wholesale Trade | 204 (79.1%) | 54 (20.9%) |
| Retail Trade | 741 (60.9%) | 476 (39.1%) |
| Transportation & Warehousing | 350 (83.1%) | 71 (16.9%) |
| Utilities | 137 (86.7%) | 21 (13.3%) |
| Information | 139 (78.1%) | 39 (21.9%) |
| Finance & Insurance | 41 (15.5%) | 223 (84.5%) |
| Real Estate, Rental & Leasing | 67 (54.5%) | 56 (45.5%) |
| Professional & Scientific | 124 (44.0%) | 158 (56.0%) |
| Enterprise Management | 2 (100.0%) | 0 (0.0%) |
| Administrative & Support | 110 (41.7%) | 154 (58.3%) |
| Educational Services | 204 (27.2%) | 545 (72.8%) |
| Health Care & Social Assistance | 306 (16.0%) | 1,606 (84.0%) |
| Arts, Entertainment & Recreation | 35 (74.5%) | 12 (25.5%) |
| Accommodation & Food Services | 265 (47.0%) | 299 (53.0%) |
| Public Administration | 292 (51.4%) | 276 (48.6%) |
| Total | 5,684 (52.7%) | 5,097 (47.3%) |
Education in Gage County
School Enrollment in Gage County
The most common levels of schooling among the 4,576 students in Gage County are middle school (1,273 | 27.8%), high school (1,212 | 26.5%), and elementary school (865 | 18.9%).
| School Level | # Students | % Students |
| Nursery / Preschool | 358 | 7.8% |
| Kindergarten | 322 | 7.0% |
| Elementary School | 865 | 18.9% |
| Middle School | 1,273 | 27.8% |
| High School | 1,212 | 26.5% |
| College / Undergraduate | 429 | 9.4% |
| Graduate / Professional | 117 | 2.6% |
| Total | 4,576 | 100.0% |
School Enrollment by Age by Funding Source in Gage County
Out of a total of 4,576 students who are enrolled in schools in Gage County, 426 (9.3%) attend a private institution, while the remaining 4,150 (90.7%) are enrolled in public schools. The age group of 3 to 4 year olds has the highest likelihood of being enrolled in private schools, with 50 (18.6% in the age bracket) enrolled. Conversely, the age group of 18 to 19 year olds has the lowest likelihood of being enrolled in a private school, with 275 (94.2% in the age bracket) attending a public institution.
| Age Bracket | Public School | Private School |
| 3 to 4 Year Olds | 219 (81.4%) | 50 (18.6%) |
| 5 to 9 Year Old | 1,034 (87.3%) | 151 (12.7%) |
| 10 to 14 Year Olds | 1,332 (92.4%) | 109 (7.6%) |
| 15 to 17 Year Olds | 818 (94.1%) | 51 (5.9%) |
| 18 to 19 Year Olds | 275 (94.2%) | 17 (5.8%) |
| 20 to 24 Year Olds | 183 (92.0%) | 16 (8.0%) |
| 25 to 34 Year Olds | 77 (89.5%) | 9 (10.5%) |
| 35 Years and over | 212 (90.2%) | 23 (9.8%) |
| Total | 4,150 (90.7%) | 426 (9.3%) |
Educational Attainment by Field of Study in Gage County
Business (727 | 22.3%), education (687 | 21.0%), science & technology (425 | 13.0%), bio, nature & agricultural (420 | 12.9%), and arts & humanities (178 | 5.5%) are the most common fields of study among 3,263 individuals in Gage County who have obtained a bachelor's degree or higher.
| Field of Study | # Graduates | % Graduates |
| Computers & Mathematics | 52 | 1.6% |
| Bio, Nature & Agricultural | 420 | 12.9% |
| Physical & Health Sciences | 43 | 1.3% |
| Psychology | 165 | 5.1% |
| Social Sciences | 151 | 4.6% |
| Engineering | 66 | 2.0% |
| Multidisciplinary Studies | 31 | 0.9% |
| Science & Technology | 425 | 13.0% |
| Business | 727 | 22.3% |
| Education | 687 | 21.0% |
| Literature & Languages | 9 | 0.3% |
| Liberal Arts & History | 140 | 4.3% |
| Visual & Performing Arts | 69 | 2.1% |
| Communications | 100 | 3.1% |
| Arts & Humanities | 178 | 5.5% |
| Total | 3,263 | 100.0% |
Transportation & Commute in Gage County
Vehicle Availability by Sex in Gage County
The most prevalent vehicle ownership categories in Gage County are males with 3 vehicles (1,794, accounting for 32.5%) and females with 3 vehicles (1,491, making up 36.1%).
| Vehicles Available | Male | Female |
| No Vehicle | 201 (3.6%) | 45 (0.9%) |
| 1 Vehicle | 498 (9.0%) | 657 (13.2%) |
| 2 Vehicles | 1,741 (31.5%) | 1,742 (35.1%) |
| 3 Vehicles | 1,794 (32.5%) | 1,491 (30.0%) |
| 4 Vehicles | 798 (14.4%) | 737 (14.8%) |
| 5 or more Vehicles | 491 (8.9%) | 296 (6.0%) |
| Total | 5,523 (100.0%) | 4,968 (100.0%) |
Commute Time in Gage County
The most frequently occuring commute durations in Gage County are 5 to 9 minutes (2,162 commuters, 22.1%), 10 to 14 minutes (1,588 commuters, 16.2%), and 15 to 19 minutes (1,075 commuters, 11.0%).
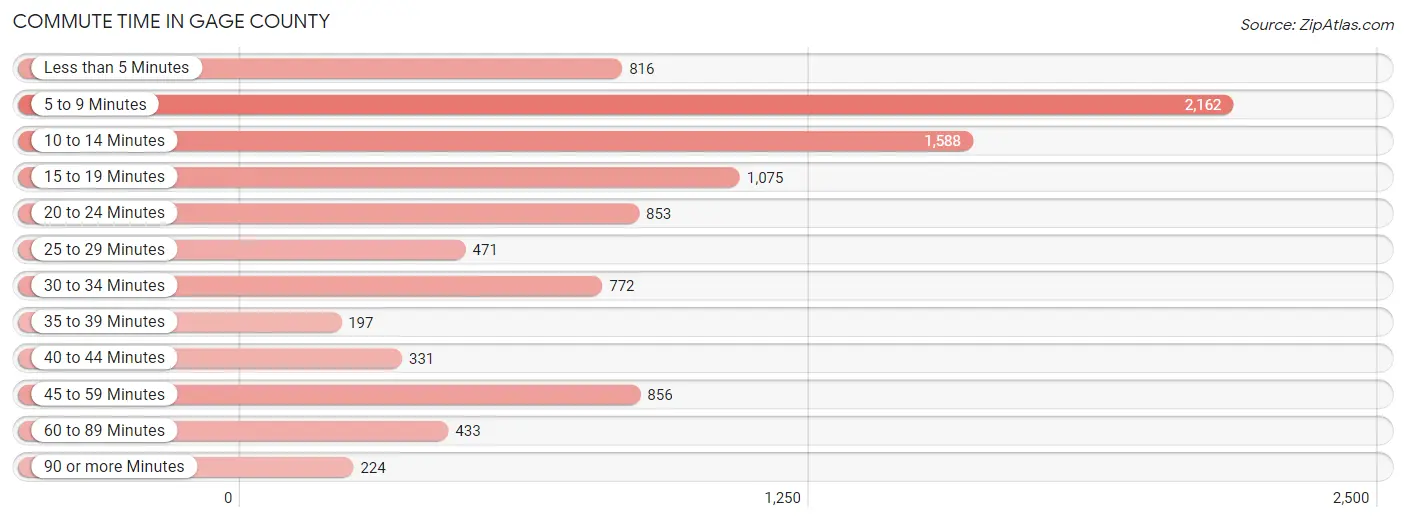
| Commute Time | # Commuters | % Commuters |
| Less than 5 Minutes | 816 | 8.4% |
| 5 to 9 Minutes | 2,162 | 22.1% |
| 10 to 14 Minutes | 1,588 | 16.2% |
| 15 to 19 Minutes | 1,075 | 11.0% |
| 20 to 24 Minutes | 853 | 8.7% |
| 25 to 29 Minutes | 471 | 4.8% |
| 30 to 34 Minutes | 772 | 7.9% |
| 35 to 39 Minutes | 197 | 2.0% |
| 40 to 44 Minutes | 331 | 3.4% |
| 45 to 59 Minutes | 856 | 8.7% |
| 60 to 89 Minutes | 433 | 4.4% |
| 90 or more Minutes | 224 | 2.3% |
Commute Time by Sex in Gage County
The most common commute times in Gage County are 5 to 9 minutes (1,144 commuters, 22.0%) for males and 5 to 9 minutes (1,018 commuters, 22.3%) for females.
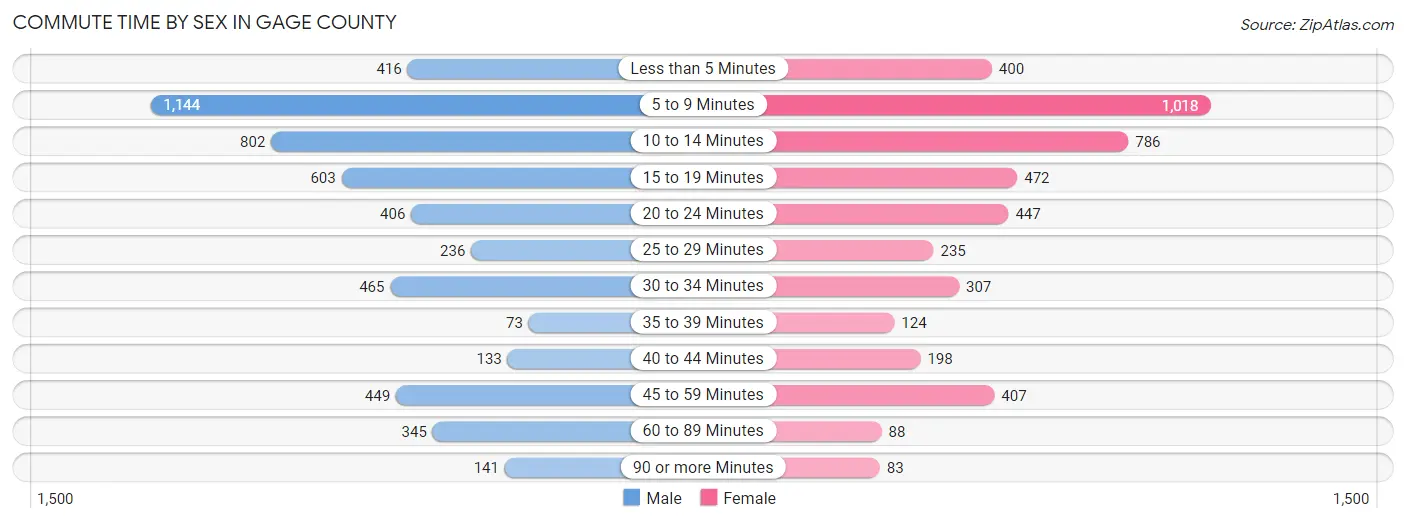
| Commute Time | Male | Female |
| Less than 5 Minutes | 416 (8.0%) | 400 (8.8%) |
| 5 to 9 Minutes | 1,144 (22.0%) | 1,018 (22.3%) |
| 10 to 14 Minutes | 802 (15.4%) | 786 (17.2%) |
| 15 to 19 Minutes | 603 (11.6%) | 472 (10.3%) |
| 20 to 24 Minutes | 406 (7.8%) | 447 (9.8%) |
| 25 to 29 Minutes | 236 (4.5%) | 235 (5.1%) |
| 30 to 34 Minutes | 465 (8.9%) | 307 (6.7%) |
| 35 to 39 Minutes | 73 (1.4%) | 124 (2.7%) |
| 40 to 44 Minutes | 133 (2.5%) | 198 (4.3%) |
| 45 to 59 Minutes | 449 (8.6%) | 407 (8.9%) |
| 60 to 89 Minutes | 345 (6.6%) | 88 (1.9%) |
| 90 or more Minutes | 141 (2.7%) | 83 (1.8%) |
Time of Departure to Work by Sex in Gage County
The most frequent times of departure to work in Gage County are 6:30 AM to 6:59 AM (1,014, 19.5%) for males and 7:30 AM to 7:59 AM (766, 16.8%) for females.
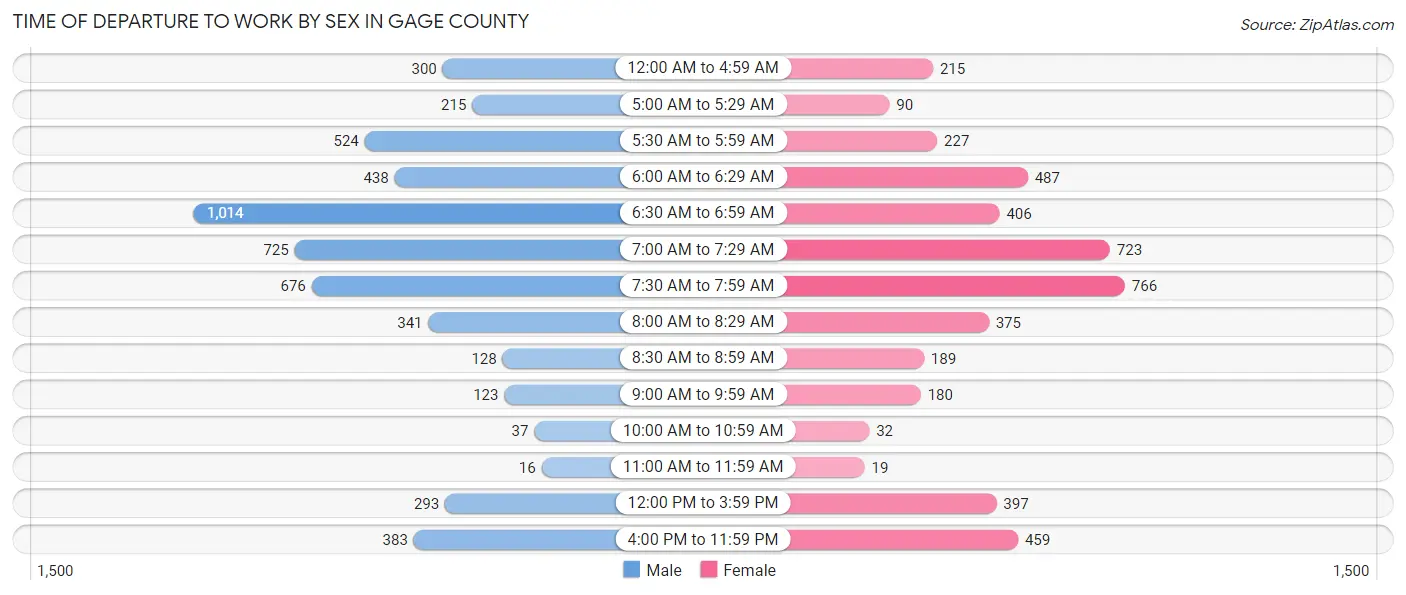
| Time of Departure | Male | Female |
| 12:00 AM to 4:59 AM | 300 (5.8%) | 215 (4.7%) |
| 5:00 AM to 5:29 AM | 215 (4.1%) | 90 (2.0%) |
| 5:30 AM to 5:59 AM | 524 (10.1%) | 227 (5.0%) |
| 6:00 AM to 6:29 AM | 438 (8.4%) | 487 (10.7%) |
| 6:30 AM to 6:59 AM | 1,014 (19.5%) | 406 (8.9%) |
| 7:00 AM to 7:29 AM | 725 (13.9%) | 723 (15.8%) |
| 7:30 AM to 7:59 AM | 676 (13.0%) | 766 (16.8%) |
| 8:00 AM to 8:29 AM | 341 (6.5%) | 375 (8.2%) |
| 8:30 AM to 8:59 AM | 128 (2.5%) | 189 (4.1%) |
| 9:00 AM to 9:59 AM | 123 (2.4%) | 180 (3.9%) |
| 10:00 AM to 10:59 AM | 37 (0.7%) | 32 (0.7%) |
| 11:00 AM to 11:59 AM | 16 (0.3%) | 19 (0.4%) |
| 12:00 PM to 3:59 PM | 293 (5.6%) | 397 (8.7%) |
| 4:00 PM to 11:59 PM | 383 (7.3%) | 459 (10.1%) |
| Total | 5,213 (100.0%) | 4,565 (100.0%) |
Housing Occupancy in Gage County
Occupancy by Ownership in Gage County
Of the total 9,154 dwellings in Gage County, owner-occupied units account for 6,469 (70.7%), while renter-occupied units make up 2,685 (29.3%).
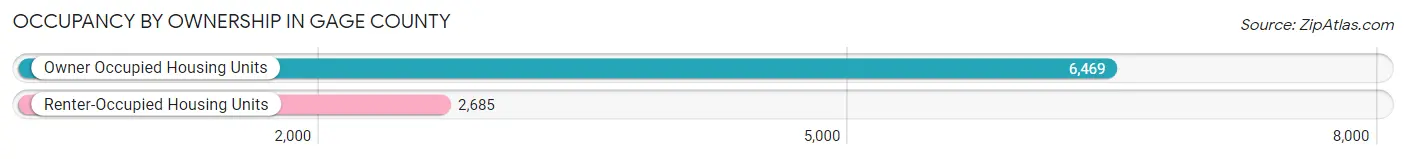
| Occupancy | # Housing Units | % Housing Units |
| Owner Occupied Housing Units | 6,469 | 70.7% |
| Renter-Occupied Housing Units | 2,685 | 29.3% |
| Total Occupied Housing Units | 9,154 | 100.0% |
Occupancy by Household Size in Gage County
| Household Size | # Housing Units | % Housing Units |
| 1-Person Household | 3,174 | 34.7% |
| 2-Person Household | 3,378 | 36.9% |
| 3-Person Household | 957 | 10.4% |
| 4+ Person Household | 1,645 | 18.0% |
| Total Housing Units | 9,154 | 100.0% |
Occupancy by Ownership by Household Size in Gage County
| Household Size | Owner-occupied | Renter-occupied |
| 1-Person Household | 1,718 (54.1%) | 1,456 (45.9%) |
| 2-Person Household | 2,887 (85.5%) | 491 (14.5%) |
| 3-Person Household | 671 (70.1%) | 286 (29.9%) |
| 4+ Person Household | 1,193 (72.5%) | 452 (27.5%) |
| Total Housing Units | 6,469 (70.7%) | 2,685 (29.3%) |
Occupancy by Educational Attainment in Gage County
| Household Size | Owner-occupied | Renter-occupied |
| Less than High School | 285 (48.1%) | 308 (51.9%) |
| High School Diploma | 2,284 (69.7%) | 992 (30.3%) |
| College/Associate Degree | 2,339 (67.3%) | 1,135 (32.7%) |
| Bachelor's Degree or higher | 1,561 (86.2%) | 250 (13.8%) |
Occupancy by Age of Householder in Gage County
| Age Bracket | # Households | % Households |
| Under 35 Years | 1,419 | 15.5% |
| 35 to 44 Years | 1,365 | 14.9% |
| 45 to 54 Years | 1,338 | 14.6% |
| 55 to 64 Years | 1,967 | 21.5% |
| 65 to 74 Years | 1,571 | 17.2% |
| 75 to 84 Years | 997 | 10.9% |
| 85 Years and Over | 497 | 5.4% |
| Total | 9,154 | 100.0% |
Housing Finances in Gage County
Median Income by Occupancy in Gage County
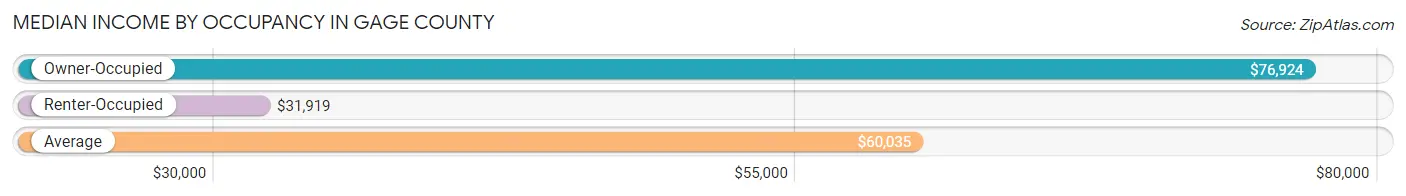
| Occupancy Type | # Households | Median Income |
| Owner-Occupied | 6,469 (70.7%) | $76,924 |
| Renter-Occupied | 2,685 (29.3%) | $31,919 |
| Average | 9,154 (100.0%) | $60,035 |
Occupancy by Householder Income Bracket in Gage County
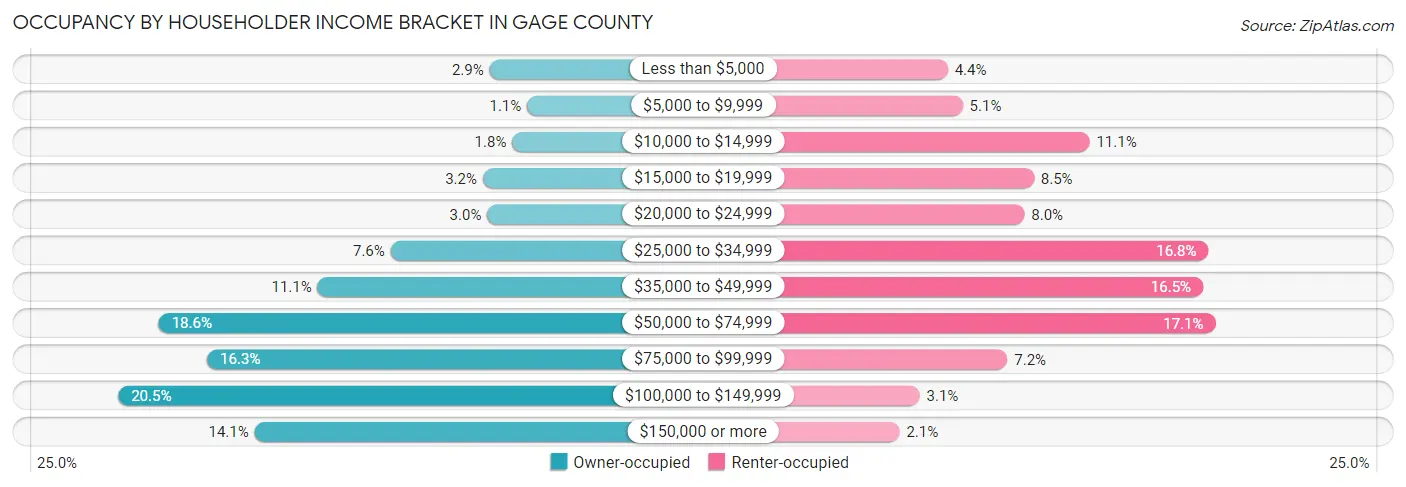
| Income Bracket | Owner-occupied | Renter-occupied |
| Less than $5,000 | 185 (2.9%) | 118 (4.4%) |
| $5,000 to $9,999 | 69 (1.1%) | 137 (5.1%) |
| $10,000 to $14,999 | 115 (1.8%) | 299 (11.1%) |
| $15,000 to $19,999 | 206 (3.2%) | 228 (8.5%) |
| $20,000 to $24,999 | 192 (3.0%) | 216 (8.0%) |
| $25,000 to $34,999 | 490 (7.6%) | 451 (16.8%) |
| $35,000 to $49,999 | 715 (11.1%) | 444 (16.5%) |
| $50,000 to $74,999 | 1,204 (18.6%) | 460 (17.1%) |
| $75,000 to $99,999 | 1,055 (16.3%) | 194 (7.2%) |
| $100,000 to $149,999 | 1,329 (20.5%) | 82 (3.0%) |
| $150,000 or more | 909 (14.1%) | 56 (2.1%) |
| Total | 6,469 (100.0%) | 2,685 (100.0%) |
Monthly Housing Cost Tiers in Gage County
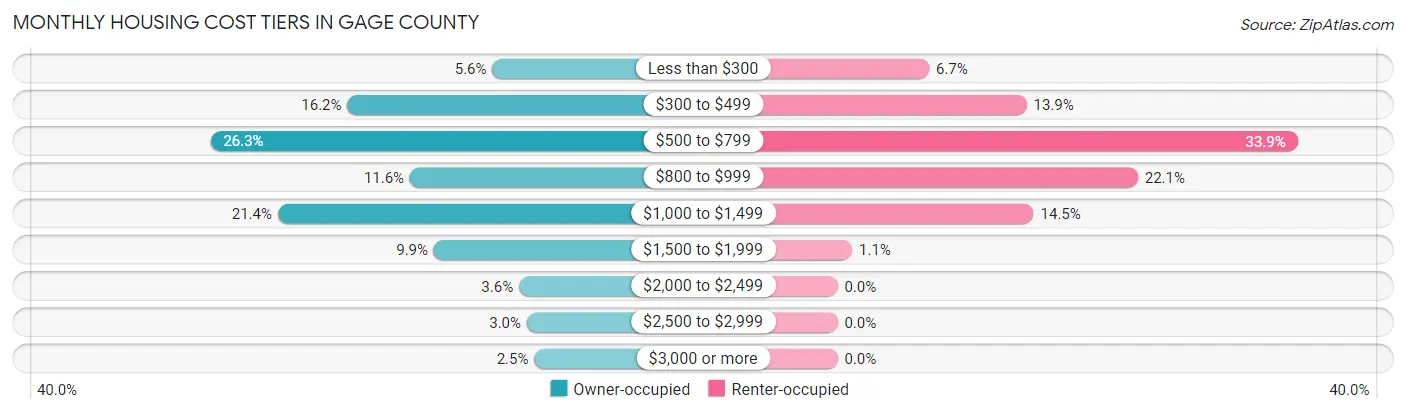
| Monthly Cost | Owner-occupied | Renter-occupied |
| Less than $300 | 359 (5.6%) | 181 (6.7%) |
| $300 to $499 | 1,050 (16.2%) | 374 (13.9%) |
| $500 to $799 | 1,703 (26.3%) | 910 (33.9%) |
| $800 to $999 | 752 (11.6%) | 594 (22.1%) |
| $1,000 to $1,499 | 1,381 (21.3%) | 388 (14.4%) |
| $1,500 to $1,999 | 638 (9.9%) | 29 (1.1%) |
| $2,000 to $2,499 | 232 (3.6%) | 0 (0.0%) |
| $2,500 to $2,999 | 195 (3.0%) | 0 (0.0%) |
| $3,000 or more | 159 (2.5%) | 0 (0.0%) |
| Total | 6,469 (100.0%) | 2,685 (100.0%) |
Physical Housing Characteristics in Gage County
Housing Structures in Gage County
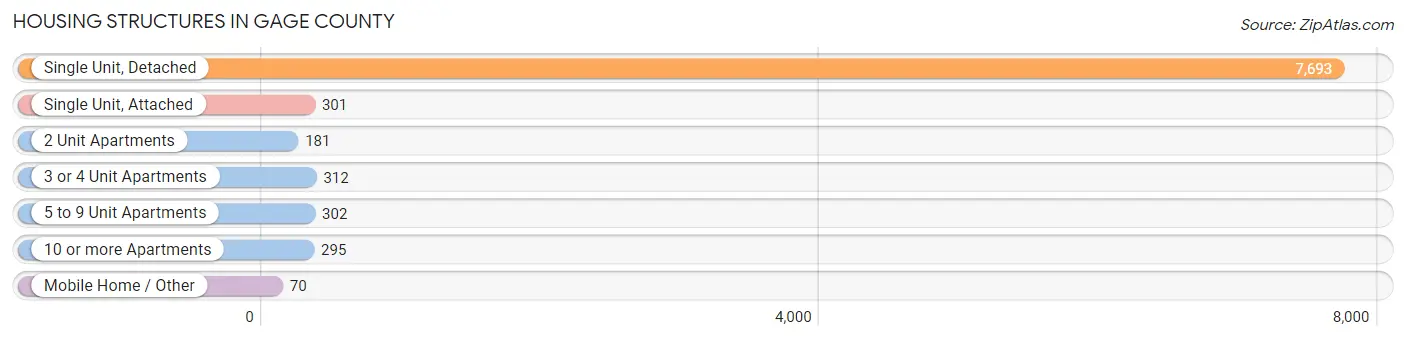
| Structure Type | # Housing Units | % Housing Units |
| Single Unit, Detached | 7,693 | 84.0% |
| Single Unit, Attached | 301 | 3.3% |
| 2 Unit Apartments | 181 | 2.0% |
| 3 or 4 Unit Apartments | 312 | 3.4% |
| 5 to 9 Unit Apartments | 302 | 3.3% |
| 10 or more Apartments | 295 | 3.2% |
| Mobile Home / Other | 70 | 0.8% |
| Total | 9,154 | 100.0% |
Housing Structures by Occupancy in Gage County
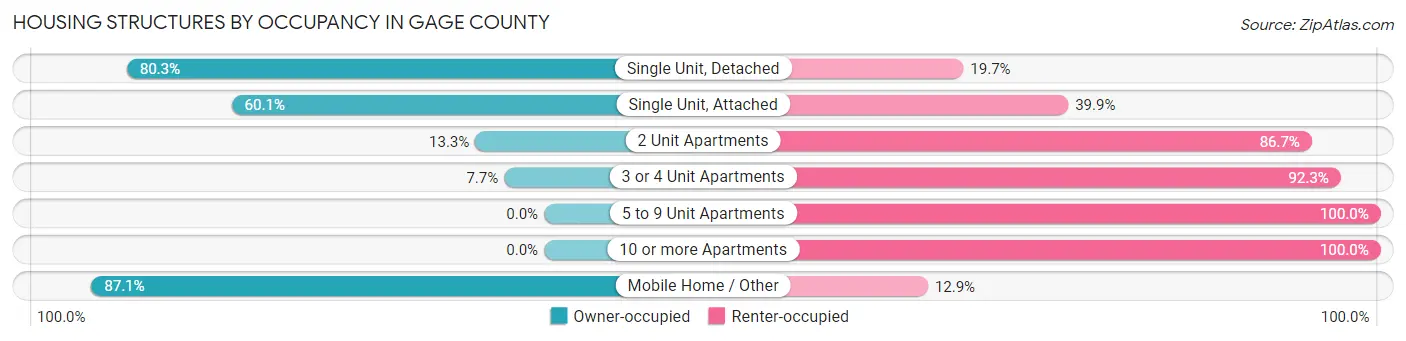
| Structure Type | Owner-occupied | Renter-occupied |
| Single Unit, Detached | 6,179 (80.3%) | 1,514 (19.7%) |
| Single Unit, Attached | 181 (60.1%) | 120 (39.9%) |
| 2 Unit Apartments | 24 (13.3%) | 157 (86.7%) |
| 3 or 4 Unit Apartments | 24 (7.7%) | 288 (92.3%) |
| 5 to 9 Unit Apartments | 0 (0.0%) | 302 (100.0%) |
| 10 or more Apartments | 0 (0.0%) | 295 (100.0%) |
| Mobile Home / Other | 61 (87.1%) | 9 (12.9%) |
| Total | 6,469 (70.7%) | 2,685 (29.3%) |
Housing Structures by Number of Rooms in Gage County
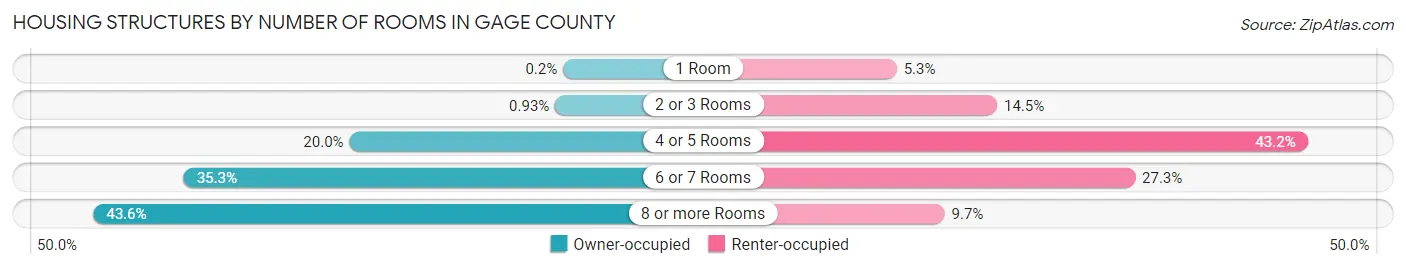
| Number of Rooms | Owner-occupied | Renter-occupied |
| 1 Room | 13 (0.2%) | 141 (5.2%) |
| 2 or 3 Rooms | 60 (0.9%) | 390 (14.5%) |
| 4 or 5 Rooms | 1,291 (20.0%) | 1,161 (43.2%) |
| 6 or 7 Rooms | 2,282 (35.3%) | 733 (27.3%) |
| 8 or more Rooms | 2,823 (43.6%) | 260 (9.7%) |
| Total | 6,469 (100.0%) | 2,685 (100.0%) |
Housing Structure by Heating Type in Gage County
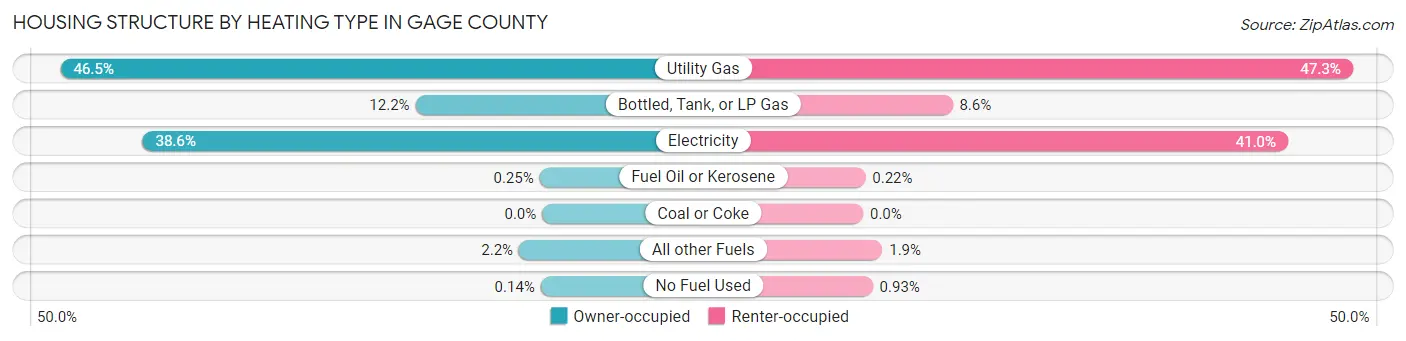
| Heating Type | Owner-occupied | Renter-occupied |
| Utility Gas | 3,010 (46.5%) | 1,270 (47.3%) |
| Bottled, Tank, or LP Gas | 792 (12.2%) | 232 (8.6%) |
| Electricity | 2,497 (38.6%) | 1,102 (41.0%) |
| Fuel Oil or Kerosene | 16 (0.3%) | 6 (0.2%) |
| Coal or Coke | 0 (0.0%) | 0 (0.0%) |
| All other Fuels | 145 (2.2%) | 50 (1.9%) |
| No Fuel Used | 9 (0.1%) | 25 (0.9%) |
| Total | 6,469 (100.0%) | 2,685 (100.0%) |
Household Vehicle Usage in Gage County
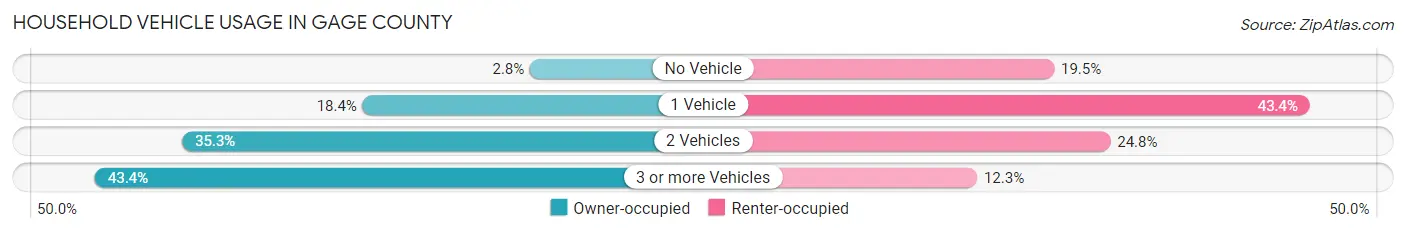
| Vehicles per Household | Owner-occupied | Renter-occupied |
| No Vehicle | 182 (2.8%) | 524 (19.5%) |
| 1 Vehicle | 1,193 (18.4%) | 1,165 (43.4%) |
| 2 Vehicles | 2,284 (35.3%) | 665 (24.8%) |
| 3 or more Vehicles | 2,810 (43.4%) | 331 (12.3%) |
| Total | 6,469 (100.0%) | 2,685 (100.0%) |
Real Estate & Mortgages in Gage County
Real Estate and Mortgage Overview in Gage County
| Characteristic | Without Mortgage | With Mortgage |
| Housing Units | 3,297 | 3,172 |
| Median Property Value | $146,700 | $163,900 |
| Median Household Income | $59,775 | $593 |
| Monthly Housing Costs | $547 | $159 |
| Real Estate Taxes | $2,194 | $56 |
Property Value by Mortgage Status in Gage County
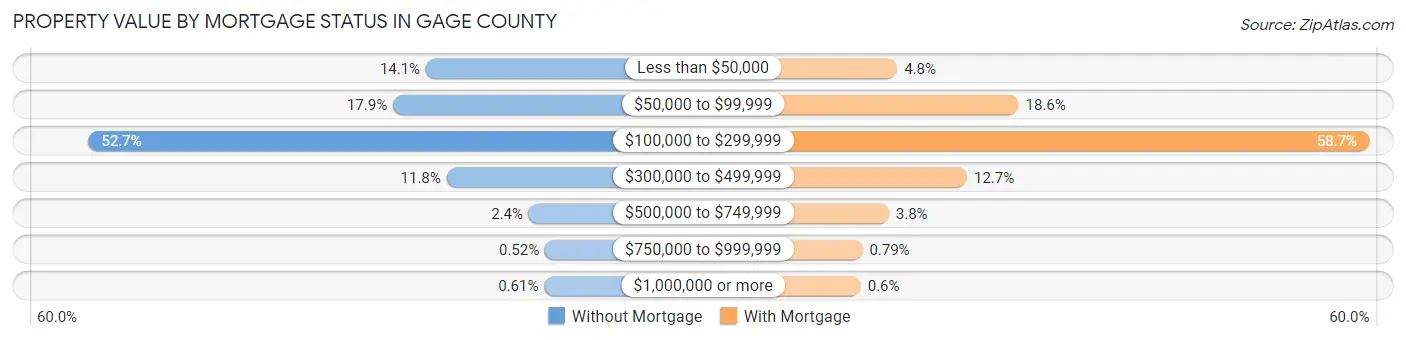
| Property Value | Without Mortgage | With Mortgage |
| Less than $50,000 | 466 (14.1%) | 151 (4.8%) |
| $50,000 to $99,999 | 590 (17.9%) | 591 (18.6%) |
| $100,000 to $299,999 | 1,738 (52.7%) | 1,861 (58.7%) |
| $300,000 to $499,999 | 388 (11.8%) | 404 (12.7%) |
| $500,000 to $749,999 | 78 (2.4%) | 121 (3.8%) |
| $750,000 to $999,999 | 17 (0.5%) | 25 (0.8%) |
| $1,000,000 or more | 20 (0.6%) | 19 (0.6%) |
| Total | 3,297 (100.0%) | 3,172 (100.0%) |
Household Income by Mortgage Status in Gage County
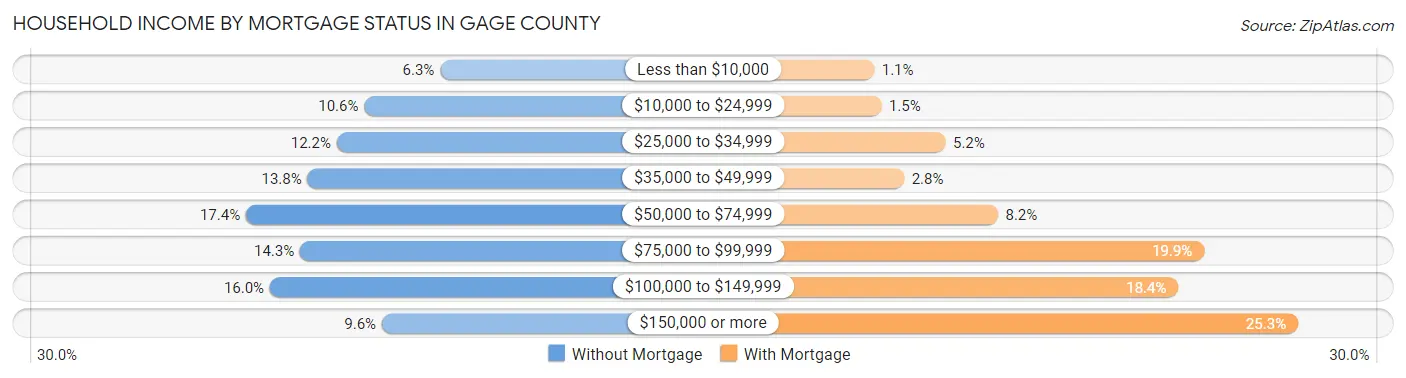
| Household Income | Without Mortgage | With Mortgage |
| Less than $10,000 | 206 (6.2%) | 35 (1.1%) |
| $10,000 to $24,999 | 349 (10.6%) | 48 (1.5%) |
| $25,000 to $34,999 | 401 (12.2%) | 164 (5.2%) |
| $35,000 to $49,999 | 456 (13.8%) | 89 (2.8%) |
| $50,000 to $74,999 | 572 (17.3%) | 259 (8.2%) |
| $75,000 to $99,999 | 470 (14.3%) | 632 (19.9%) |
| $100,000 to $149,999 | 527 (16.0%) | 585 (18.4%) |
| $150,000 or more | 316 (9.6%) | 802 (25.3%) |
| Total | 3,297 (100.0%) | 3,172 (100.0%) |
Property Value to Household Income Ratio in Gage County
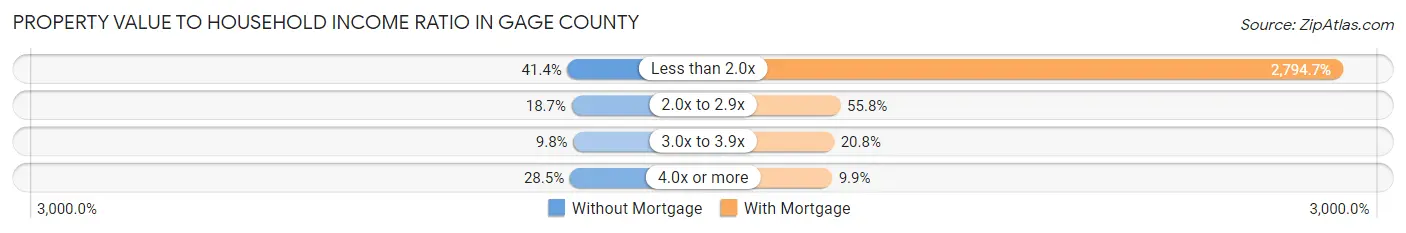
| Value-to-Income Ratio | Without Mortgage | With Mortgage |
| Less than 2.0x | 1,364 (41.4%) | 88,647 (2,794.7%) |
| 2.0x to 2.9x | 615 (18.6%) | 1,771 (55.8%) |
| 3.0x to 3.9x | 323 (9.8%) | 660 (20.8%) |
| 4.0x or more | 941 (28.5%) | 315 (9.9%) |
| Total | 3,297 (100.0%) | 3,172 (100.0%) |
Real Estate Taxes by Mortgage Status in Gage County
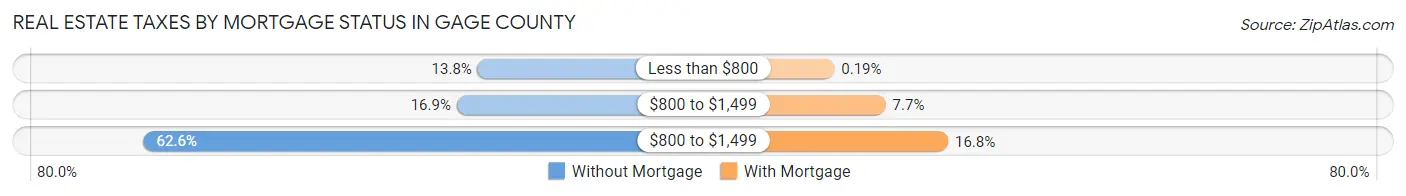
| Property Taxes | Without Mortgage | With Mortgage |
| Less than $800 | 455 (13.8%) | 6 (0.2%) |
| $800 to $1,499 | 556 (16.9%) | 244 (7.7%) |
| $800 to $1,499 | 2,064 (62.6%) | 533 (16.8%) |
| Total | 3,297 (100.0%) | 3,172 (100.0%) |
Health & Disability in Gage County
Health Insurance Coverage by Age in Gage County
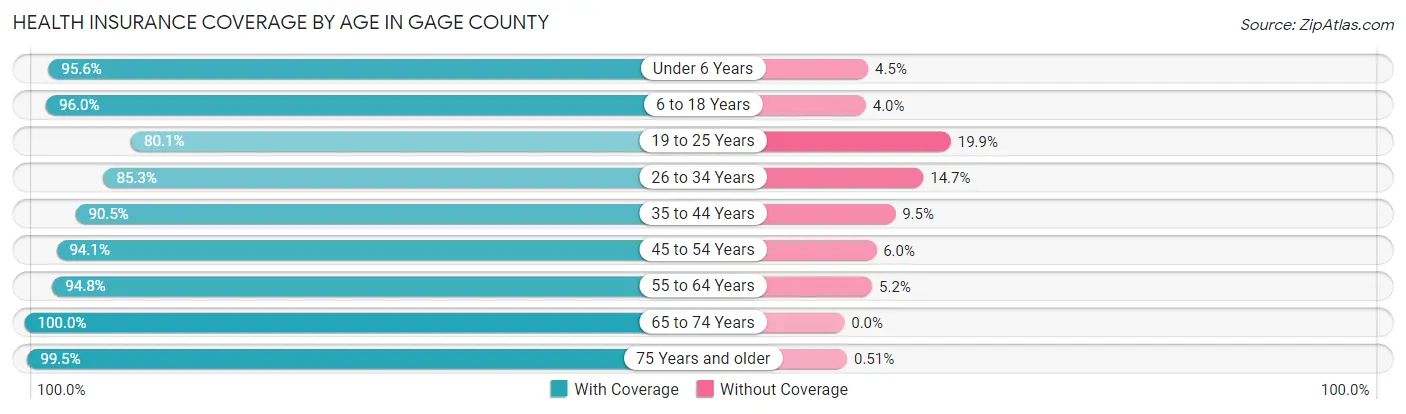
| Age Bracket | With Coverage | Without Coverage |
| Under 6 Years | 1,416 (95.6%) | 66 (4.4%) |
| 6 to 18 Years | 3,564 (96.0%) | 149 (4.0%) |
| 19 to 25 Years | 1,110 (80.1%) | 275 (19.9%) |
| 26 to 34 Years | 1,824 (85.3%) | 315 (14.7%) |
| 35 to 44 Years | 2,252 (90.5%) | 236 (9.5%) |
| 45 to 54 Years | 2,354 (94.1%) | 149 (5.9%) |
| 55 to 64 Years | 3,124 (94.8%) | 171 (5.2%) |
| 65 to 74 Years | 2,407 (100.0%) | 0 (0.0%) |
| 75 Years and older | 1,949 (99.5%) | 10 (0.5%) |
| Total | 20,000 (93.6%) | 1,371 (6.4%) |
Health Insurance Coverage by Citizenship Status in Gage County
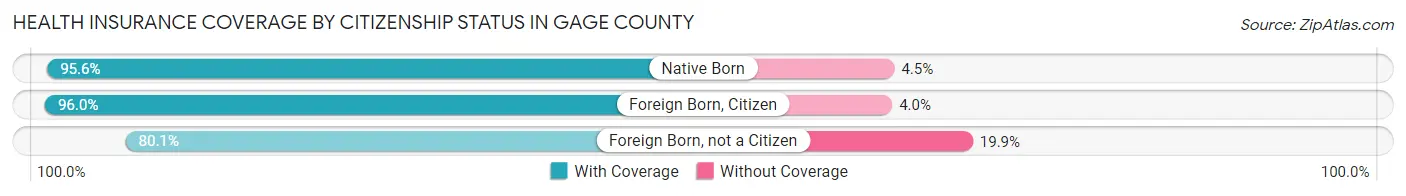
| Citizenship Status | With Coverage | Without Coverage |
| Native Born | 1,416 (95.6%) | 66 (4.4%) |
| Foreign Born, Citizen | 3,564 (96.0%) | 149 (4.0%) |
| Foreign Born, not a Citizen | 1,110 (80.1%) | 275 (19.9%) |
Health Insurance Coverage by Household Income in Gage County
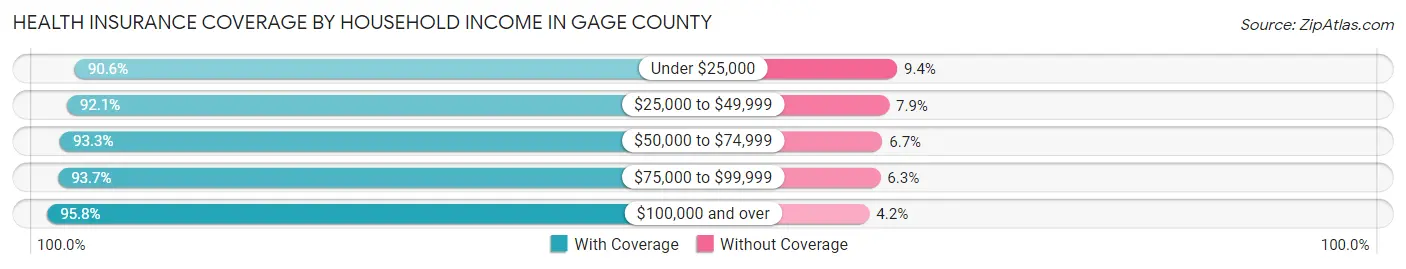
| Household Income | With Coverage | Without Coverage |
| Under $25,000 | 2,173 (90.6%) | 226 (9.4%) |
| $25,000 to $49,999 | 3,748 (92.1%) | 323 (7.9%) |
| $50,000 to $74,999 | 3,364 (93.3%) | 240 (6.7%) |
| $75,000 to $99,999 | 3,153 (93.7%) | 212 (6.3%) |
| $100,000 and over | 7,314 (95.8%) | 324 (4.2%) |
Public vs Private Health Insurance Coverage by Age in Gage County
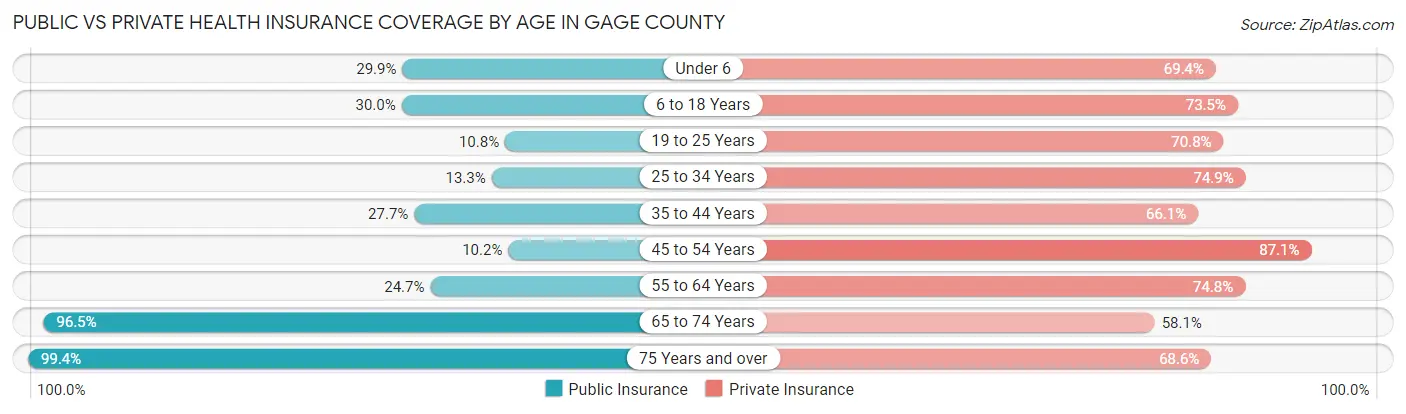
| Age Bracket | Public Insurance | Private Insurance |
| Under 6 | 443 (29.9%) | 1,029 (69.4%) |
| 6 to 18 Years | 1,115 (30.0%) | 2,729 (73.5%) |
| 19 to 25 Years | 150 (10.8%) | 981 (70.8%) |
| 25 to 34 Years | 285 (13.3%) | 1,603 (74.9%) |
| 35 to 44 Years | 689 (27.7%) | 1,645 (66.1%) |
| 45 to 54 Years | 256 (10.2%) | 2,181 (87.1%) |
| 55 to 64 Years | 814 (24.7%) | 2,466 (74.8%) |
| 65 to 74 Years | 2,323 (96.5%) | 1,398 (58.1%) |
| 75 Years and over | 1,947 (99.4%) | 1,343 (68.6%) |
| Total | 8,022 (37.5%) | 15,375 (71.9%) |
Disability Status by Sex by Age in Gage County
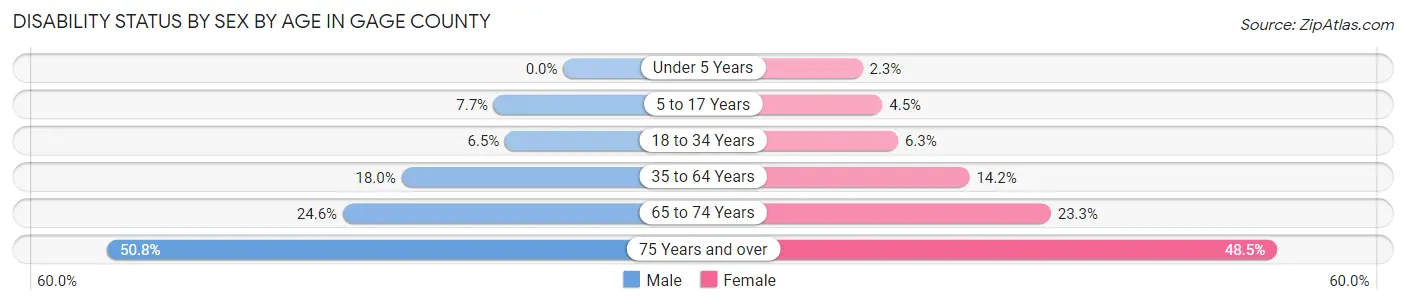
| Age Bracket | Male | Female |
| Under 5 Years | 0 (0.0%) | 13 (2.3%) |
| 5 to 17 Years | 153 (7.7%) | 78 (4.5%) |
| 18 to 34 Years | 132 (6.5%) | 112 (6.3%) |
| 35 to 64 Years | 748 (18.0%) | 588 (14.2%) |
| 65 to 74 Years | 302 (24.5%) | 274 (23.3%) |
| 75 Years and over | 446 (50.8%) | 524 (48.5%) |
Disability Class by Sex by Age in Gage County
Disability Class: Hearing Difficulty
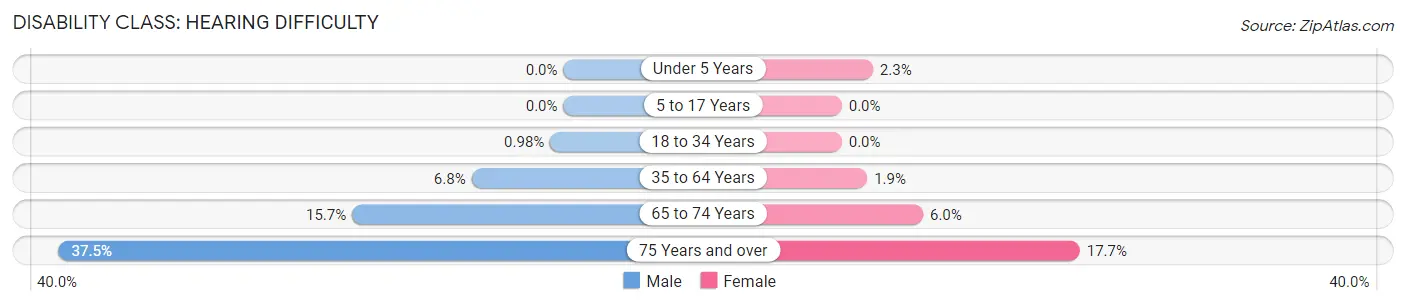
| Age Bracket | Male | Female |
| Under 5 Years | 0 (0.0%) | 13 (2.3%) |
| 5 to 17 Years | 0 (0.0%) | 0 (0.0%) |
| 18 to 34 Years | 20 (1.0%) | 0 (0.0%) |
| 35 to 64 Years | 283 (6.8%) | 78 (1.9%) |
| 65 to 74 Years | 193 (15.7%) | 71 (6.0%) |
| 75 Years and over | 329 (37.5%) | 191 (17.7%) |
Disability Class: Vision Difficulty
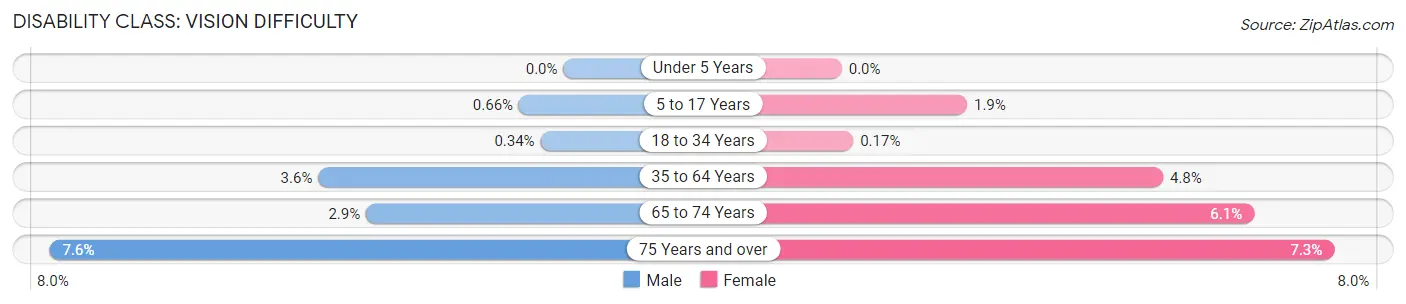
| Age Bracket | Male | Female |
| Under 5 Years | 0 (0.0%) | 0 (0.0%) |
| 5 to 17 Years | 13 (0.7%) | 32 (1.9%) |
| 18 to 34 Years | 7 (0.3%) | 3 (0.2%) |
| 35 to 64 Years | 151 (3.6%) | 197 (4.8%) |
| 65 to 74 Years | 36 (2.9%) | 72 (6.1%) |
| 75 Years and over | 67 (7.6%) | 79 (7.3%) |
Disability Class: Cognitive Difficulty
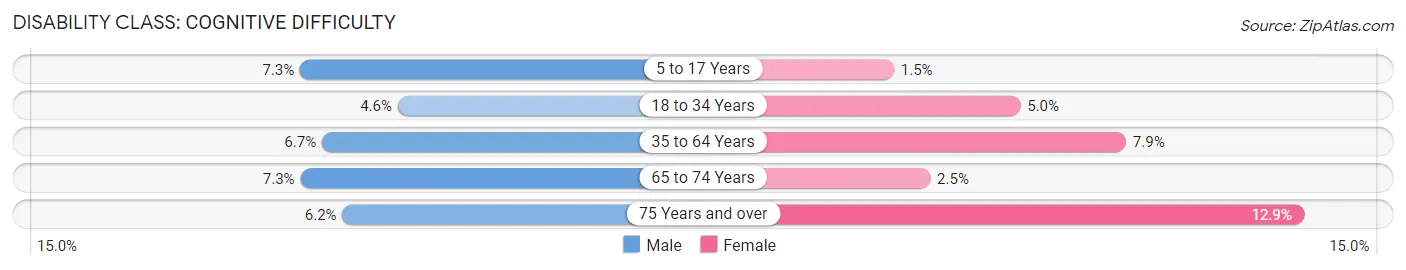
| Age Bracket | Male | Female |
| 5 to 17 Years | 145 (7.3%) | 25 (1.5%) |
| 18 to 34 Years | 94 (4.6%) | 89 (5.0%) |
| 35 to 64 Years | 279 (6.7%) | 327 (7.9%) |
| 65 to 74 Years | 90 (7.3%) | 29 (2.5%) |
| 75 Years and over | 54 (6.1%) | 139 (12.9%) |
Disability Class: Ambulatory Difficulty
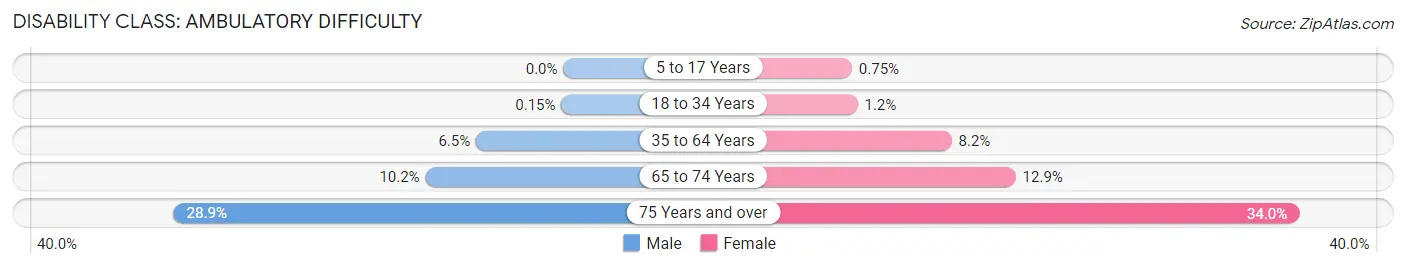
| Age Bracket | Male | Female |
| 5 to 17 Years | 0 (0.0%) | 13 (0.7%) |
| 18 to 34 Years | 3 (0.2%) | 21 (1.2%) |
| 35 to 64 Years | 269 (6.5%) | 337 (8.2%) |
| 65 to 74 Years | 126 (10.2%) | 152 (12.9%) |
| 75 Years and over | 254 (28.9%) | 367 (34.0%) |
Disability Class: Self-Care Difficulty
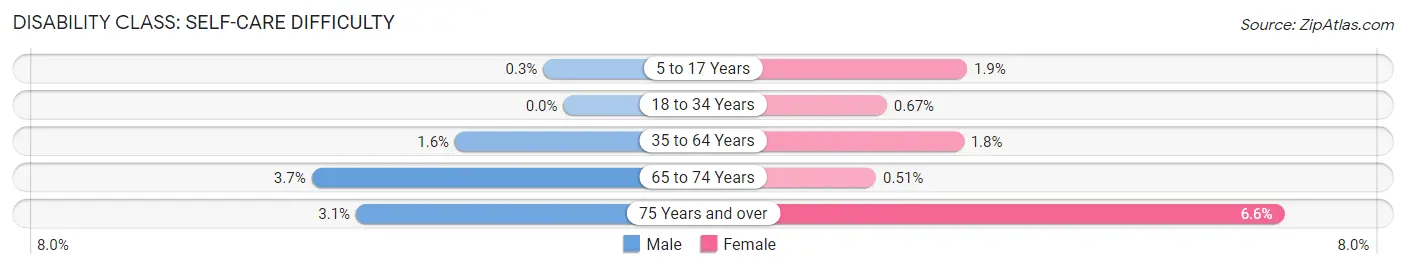
| Age Bracket | Male | Female |
| 5 to 17 Years | 6 (0.3%) | 32 (1.9%) |
| 18 to 34 Years | 0 (0.0%) | 12 (0.7%) |
| 35 to 64 Years | 67 (1.6%) | 75 (1.8%) |
| 65 to 74 Years | 46 (3.7%) | 6 (0.5%) |
| 75 Years and over | 27 (3.1%) | 71 (6.6%) |
Technology Access in Gage County
Computing Device Access in Gage County
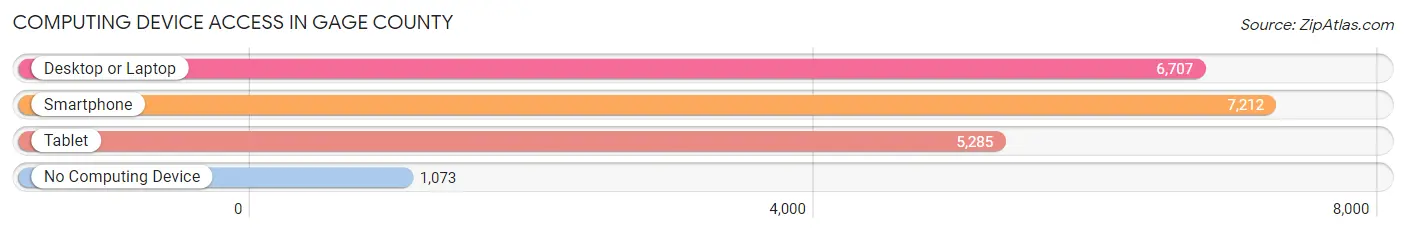
| Device Type | # Households | % Households |
| Desktop or Laptop | 6,707 | 73.3% |
| Smartphone | 7,212 | 78.8% |
| Tablet | 5,285 | 57.7% |
| No Computing Device | 1,073 | 11.7% |
| Total | 9,154 | 100.0% |
Internet Access in Gage County
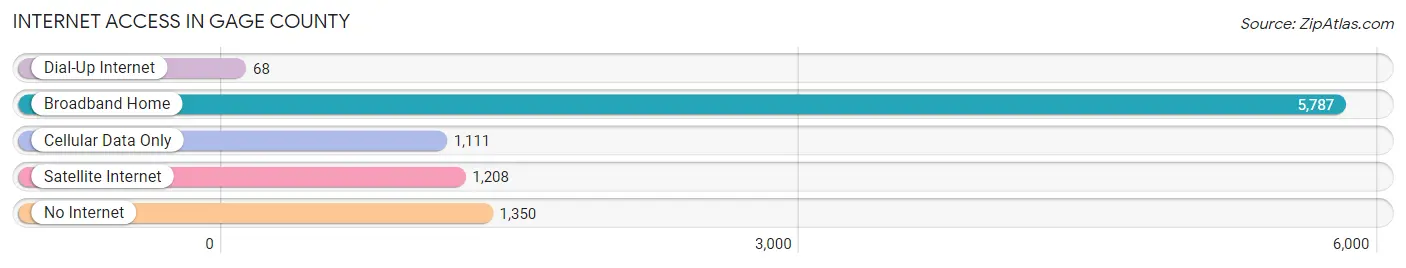
| Internet Type | # Households | % Households |
| Dial-Up Internet | 68 | 0.7% |
| Broadband Home | 5,787 | 63.2% |
| Cellular Data Only | 1,111 | 12.1% |
| Satellite Internet | 1,208 | 13.2% |
| No Internet | 1,350 | 14.7% |
| Total | 9,154 | 100.0% |
Gage County Summary
Gage County is located in the southeastern corner of Nebraska, and is bordered by the states of Iowa and Missouri. It is part of the Lincoln, NE Metropolitan Statistical Area. The county was established in 1855 and named after William Gage, a prominent early settler. As of the 2010 census, the population was 22,311.
Geography
Gage County covers an area of 576 square miles, making it the fourth smallest county in Nebraska. The county is located in the southeastern corner of the state, and is bordered by the states of Iowa and Missouri. The county is mostly flat, with some rolling hills in the northern and western parts. The county is drained by the Big Blue River, which flows through the county from north to south. The county also contains several small lakes and ponds, including Lake Wanahoo, which is located in the northern part of the county.
The county is divided into two distinct regions: the eastern part of the county is part of the Dissected Till Plains, while the western part is part of the Great Plains. The eastern part of the county is characterized by rolling hills and deep ravines, while the western part is mostly flat and covered in prairie grasses.
Climate
Gage County has a humid continental climate, with hot summers and cold winters. The average annual temperature is around 50°F, with an average high of around 80°F in the summer and an average low of around 20°F in the winter. The average annual precipitation is around 30 inches, with most of it falling in the spring and summer months.
Demographics
As of the 2010 census, the population of Gage County was 22,311. The population was spread out, with 51.2% of the population being female and 48.8% being male. The median age was 38.7 years. The racial makeup of the county was 94.2% White, 1.3% African American, 0.7% Native American, 0.7% Asian, 0.1% Pacific Islander, 1.7% from other races, and 1.2% from two or more races. Hispanic or Latino of any race were 4.2% of the population.
Economy
Gage County is largely agricultural, with the majority of the population employed in the farming and ranching industries. The county is also home to several manufacturing and industrial businesses, including a large ethanol plant. The county is also home to several small businesses, including restaurants, retail stores, and service providers.
The county is served by two major highways, Interstate 80 and U.S. Route 77. The county is also served by several smaller highways, including Nebraska Highway 8 and Nebraska Highway 50. The county is served by the Beatrice Municipal Airport, which is located in the city of Beatrice.
Gage County is home to several educational institutions, including the University of Nebraska at Lincoln, Southeast Community College, and Doane University. The county is also home to several museums, including the Gage County Historical Museum and the Beatrice Public Library.
Conclusion
Gage County is a rural county located in the southeastern corner of Nebraska. The county is largely agricultural, with the majority of the population employed in the farming and ranching industries. The county is also home to several manufacturing and industrial businesses, as well as several small businesses. The county is served by two major highways, Interstate 80 and U.S. Route 77, and is home to several educational institutions and museums. The population of Gage County was 22,311 as of the 2010 census.
Common Questions
What is the Total Population of Gage County?
Total Population of Gage County is 21,654.
What is the Total Male Population of Gage County?
Total Male Population of Gage County is 10,964.
What is the Total Female Population of Gage County?
Total Female Population of Gage County is 10,690.
What is the Ratio of Males per 100 Females in Gage County?
There are 102.56 Males per 100 Females in Gage County.
What is the Ratio of Females per 100 Males in Gage County?
There are 97.50 Females per 100 Males in Gage County.
What is the Median Population Age in Gage County?
Median Population Age in Gage County is 42.9 Years.
What is the Average Family Size in Gage County
Average Family Size in Gage County is 2.9 People.
What is the Average Household Size in Gage County
Average Household Size in Gage County is 2.3 People.
What is Per Capita Income in Gage County?
Per Capita income in Gage County is $33,435.
What is the Median Family Income in Gage County?
Median Family Income in Gage County is $82,708.
What is the Median Household income in Gage County?
Median Household Income in Gage County is $60,035.
What is Income or Wage Gap in Gage County?
Income or Wage Gap in Gage County is 32.3%.
Women in Gage County earn 67.7 cents for every dollar earned by a man.
What is Family Income Deficit in Gage County?
Family Income Deficit in Gage County is $10,726.
Families that are below poverty line in Gage County earn $10,726 less on average than the poverty threshold level.
What is Inequality or Gini Index in Gage County?
Inequality or Gini Index in Gage County is 0.44.
How Large is the Labor Force in Gage County?
There are 11,020 People in the Labor Forcein in Gage County.
What is the Percentage of People in the Labor Force in Gage County?
63.4% of People are in the Labor Force in Gage County.
What is the Unemployment Rate in Gage County?
Unemployment Rate in Gage County is 2.0%.