Bellevue, NE
Bellevue Map
Bellevue Overview
63,336
TOTAL POPULATION
32,813
MALE POPULATION
30,523
FEMALE POPULATION
107.50
MALES / 100 FEMALES
93.02
FEMALES / 100 MALES
35.5
MEDIAN AGE
3.1
AVG FAMILY SIZE
2.6
AVG HOUSEHOLD SIZE
$37,028
PER CAPITA INCOME
$96,282
AVG FAMILY INCOME
$79,839
AVG HOUSEHOLD INCOME
28.4%
WAGE / INCOME GAP [ % ]
71.6¢/ $1
WAGE / INCOME GAP [ $ ]
$10,323
FAMILY INCOME DEFICIT
0.39
INEQUALITY / GINI INDEX
33,659
LABOR FORCE [ PEOPLE ]
68.1%
PERCENT IN LABOR FORCE
2.9%
UNEMPLOYMENT RATE
Bellevue Area Codes
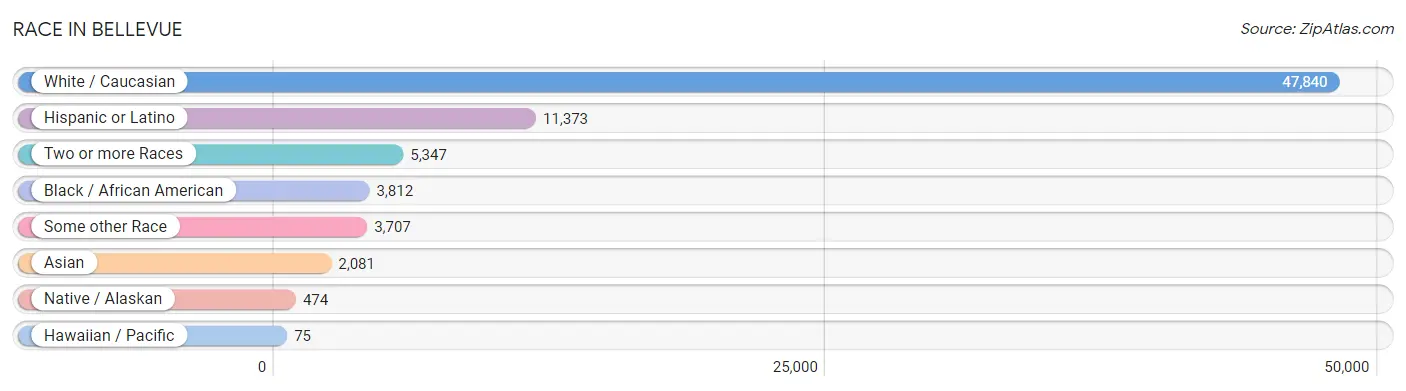
Race in Bellevue
The most populous races in Bellevue are White / Caucasian (47,840 | 75.5%), Hispanic or Latino (11,373 | 18.0%), and Two or more Races (5,347 | 8.4%).
| Race | # Population | % Population |
| Asian | 2,081 | 3.3% |
| Black / African American | 3,812 | 6.0% |
| Hawaiian / Pacific | 75 | 0.1% |
| Hispanic or Latino | 11,373 | 18.0% |
| Native / Alaskan | 474 | 0.7% |
| White / Caucasian | 47,840 | 75.5% |
| Two or more Races | 5,347 | 8.4% |
| Some other Race | 3,707 | 5.9% |
| Total | 63,336 | 100.0% |
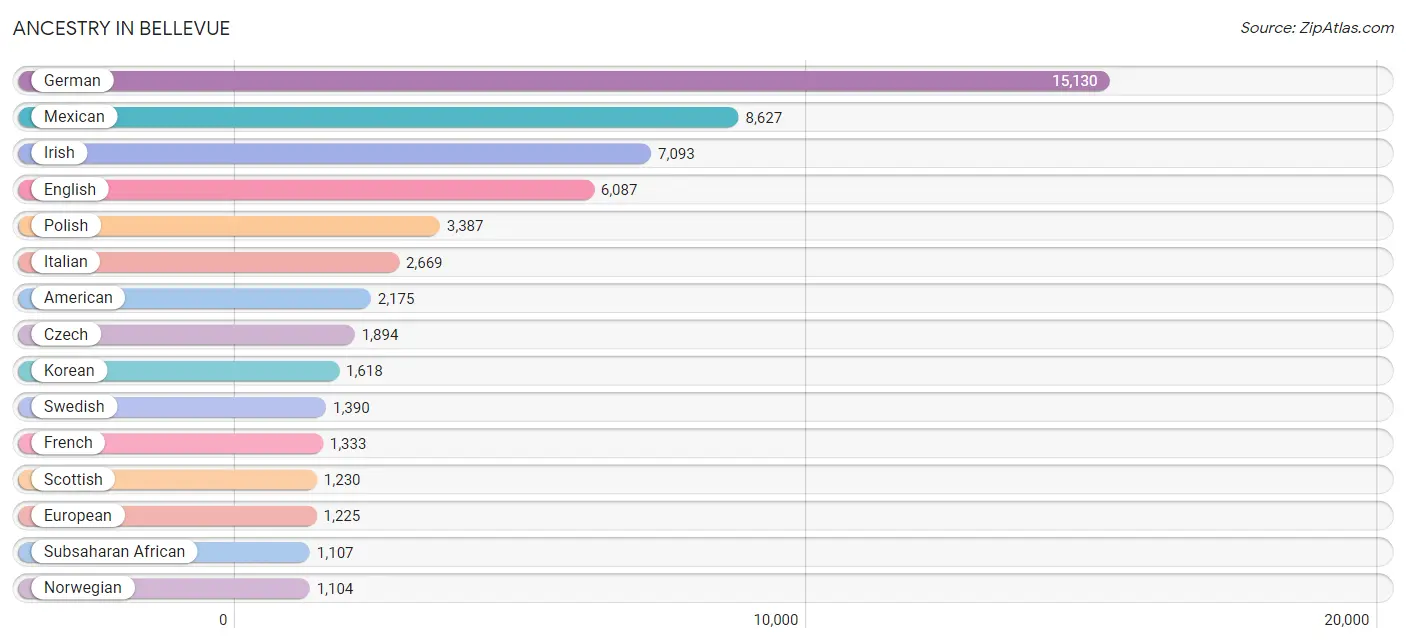
Ancestry in Bellevue
The most populous ancestries reported in Bellevue are German (15,130 | 23.9%), Mexican (8,627 | 13.6%), Irish (7,093 | 11.2%), English (6,087 | 9.6%), and Polish (3,387 | 5.3%), together accounting for 63.7% of all Bellevue residents.
| Ancestry | # Population | % Population |
| African | 100 | 0.2% |
| Albanian | 25 | 0.0% |
| American | 2,175 | 3.4% |
| Argentinean | 12 | 0.0% |
| Assyrian / Chaldean / Syriac | 11 | 0.0% |
| Australian | 7 | 0.0% |
| Austrian | 88 | 0.1% |
| Bahamian | 20 | 0.0% |
| Belgian | 61 | 0.1% |
| Belizean | 11 | 0.0% |
| Bhutanese | 334 | 0.5% |
| Bolivian | 22 | 0.0% |
| British | 380 | 0.6% |
| British West Indian | 53 | 0.1% |
| Burmese | 475 | 0.7% |
| Canadian | 71 | 0.1% |
| Celtic | 31 | 0.1% |
| Central American | 898 | 1.4% |
| Central American Indian | 16 | 0.0% |
| Cherokee | 223 | 0.4% |
| Cheyenne | 13 | 0.0% |
| Chickasaw | 7 | 0.0% |
| Chippewa | 28 | 0.0% |
| Choctaw | 11 | 0.0% |
| Colombian | 117 | 0.2% |
| Comanche | 36 | 0.1% |
| Costa Rican | 7 | 0.0% |
| Croatian | 195 | 0.3% |
| Crow | 8 | 0.0% |
| Cuban | 46 | 0.1% |
| Czech | 1,894 | 3.0% |
| Czechoslovakian | 230 | 0.4% |
| Danish | 733 | 1.2% |
| Delaware | 3 | 0.0% |
| Dominican | 83 | 0.1% |
| Dutch | 867 | 1.4% |
| Eastern European | 136 | 0.2% |
| Ecuadorian | 3 | 0.0% |
| English | 6,087 | 9.6% |
| European | 1,225 | 1.9% |
| Finnish | 145 | 0.2% |
| French | 1,333 | 2.1% |
| French American Indian | 22 | 0.0% |
| French Canadian | 273 | 0.4% |
| German | 15,130 | 23.9% |
| Ghanaian | 19 | 0.0% |
| Greek | 117 | 0.2% |
| Guatemalan | 257 | 0.4% |
| Honduran | 21 | 0.0% |
| Hungarian | 97 | 0.2% |
| Indian (Asian) | 380 | 0.6% |
| Inupiat | 11 | 0.0% |
| Iranian | 20 | 0.0% |
| Irish | 7,093 | 11.2% |
| Italian | 2,669 | 4.2% |
| Jamaican | 27 | 0.0% |
| Japanese | 78 | 0.1% |
| Kenyan | 119 | 0.2% |
| Korean | 1,618 | 2.5% |
| Latvian | 10 | 0.0% |
| Lithuanian | 139 | 0.2% |
| Lumbee | 5 | 0.0% |
| Mexican | 8,627 | 13.6% |
| Mexican American Indian | 88 | 0.1% |
| Native Hawaiian | 89 | 0.1% |
| Navajo | 50 | 0.1% |
| Nicaraguan | 76 | 0.1% |
| Northern European | 58 | 0.1% |
| Norwegian | 1,104 | 1.7% |
| Pakistani | 48 | 0.1% |
| Panamanian | 33 | 0.1% |
| Pennsylvania German | 18 | 0.0% |
| Peruvian | 78 | 0.1% |
| Polish | 3,387 | 5.3% |
| Portuguese | 94 | 0.2% |
| Puerto Rican | 596 | 0.9% |
| Romanian | 45 | 0.1% |
| Russian | 90 | 0.1% |
| Salvadoran | 504 | 0.8% |
| Scandinavian | 237 | 0.4% |
| Scotch-Irish | 550 | 0.9% |
| Scottish | 1,230 | 1.9% |
| Shoshone | 13 | 0.0% |
| Sioux | 100 | 0.2% |
| Slavic | 51 | 0.1% |
| Slovak | 13 | 0.0% |
| Slovene | 11 | 0.0% |
| South African | 11 | 0.0% |
| South American | 330 | 0.5% |
| South American Indian | 32 | 0.1% |
| Spaniard | 259 | 0.4% |
| Spanish | 163 | 0.3% |
| Spanish American | 107 | 0.2% |
| Sri Lankan | 413 | 0.6% |
| Subsaharan African | 1,107 | 1.8% |
| Sudanese | 524 | 0.8% |
| Swedish | 1,390 | 2.2% |
| Swiss | 139 | 0.2% |
| Thai | 56 | 0.1% |
| Tohono O'Odham | 1 | 0.0% |
| Ukrainian | 98 | 0.2% |
| Venezuelan | 98 | 0.2% |
| Welsh | 344 | 0.5% |
| West Indian | 9 | 0.0% |
| Yuman | 13 | 0.0% | View All 105 Rows |
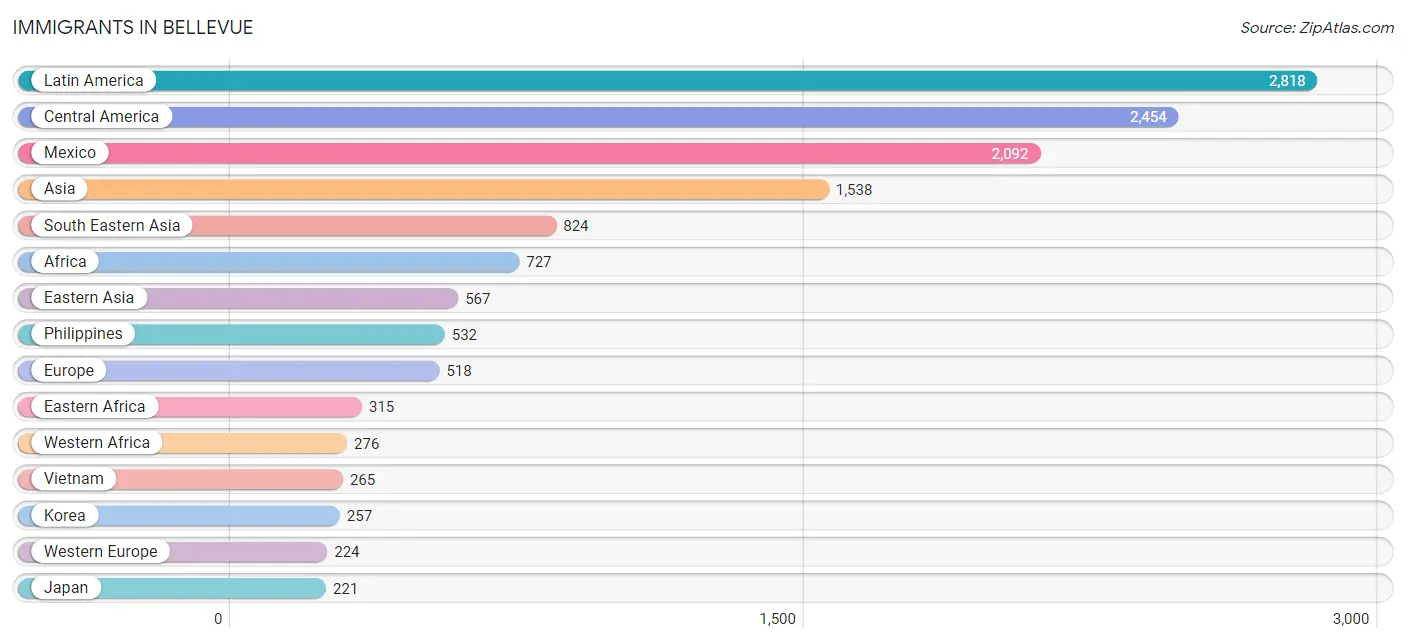
Immigrants in Bellevue
The most numerous immigrant groups reported in Bellevue came from Latin America (2,818 | 4.4%), Central America (2,454 | 3.9%), Mexico (2,092 | 3.3%), Asia (1,538 | 2.4%), and South Eastern Asia (824 | 1.3%), together accounting for 15.3% of all Bellevue residents.
| Immigration Origin | # Population | % Population |
| Africa | 727 | 1.1% |
| Argentina | 58 | 0.1% |
| Asia | 1,538 | 2.4% |
| Australia | 7 | 0.0% |
| Bahamas | 20 | 0.0% |
| Cameroon | 70 | 0.1% |
| Canada | 66 | 0.1% |
| Caribbean | 195 | 0.3% |
| Central America | 2,454 | 3.9% |
| China | 89 | 0.1% |
| Colombia | 34 | 0.1% |
| Costa Rica | 7 | 0.0% |
| Cuba | 16 | 0.0% |
| Dominican Republic | 83 | 0.1% |
| Eastern Africa | 315 | 0.5% |
| Eastern Asia | 567 | 0.9% |
| Eastern Europe | 84 | 0.1% |
| El Salvador | 199 | 0.3% |
| England | 56 | 0.1% |
| Ethiopia | 41 | 0.1% |
| Europe | 518 | 0.8% |
| Germany | 184 | 0.3% |
| Ghana | 19 | 0.0% |
| Guatemala | 91 | 0.1% |
| Honduras | 20 | 0.0% |
| Hungary | 6 | 0.0% |
| India | 50 | 0.1% |
| Iran | 20 | 0.0% |
| Ireland | 11 | 0.0% |
| Japan | 221 | 0.4% |
| Kenya | 128 | 0.2% |
| Korea | 257 | 0.4% |
| Latin America | 2,818 | 4.4% |
| Lithuania | 14 | 0.0% |
| Mexico | 2,092 | 3.3% |
| Middle Africa | 70 | 0.1% |
| Nepal | 41 | 0.1% |
| Netherlands | 40 | 0.1% |
| Nicaragua | 45 | 0.1% |
| Northern Europe | 181 | 0.3% |
| Oceania | 7 | 0.0% |
| Pakistan | 36 | 0.1% |
| Peru | 32 | 0.1% |
| Philippines | 532 | 0.8% |
| Poland | 10 | 0.0% |
| Russia | 42 | 0.1% |
| Scotland | 9 | 0.0% |
| South Africa | 34 | 0.1% |
| South America | 169 | 0.3% |
| South Central Asia | 147 | 0.2% |
| South Eastern Asia | 824 | 1.3% |
| Southern Europe | 29 | 0.1% |
| Spain | 29 | 0.1% |
| Sweden | 6 | 0.0% |
| Taiwan | 27 | 0.0% |
| Thailand | 23 | 0.0% |
| Trinidad and Tobago | 14 | 0.0% |
| Ukraine | 12 | 0.0% |
| Venezuela | 45 | 0.1% |
| Vietnam | 265 | 0.4% |
| Western Africa | 276 | 0.4% |
| Western Europe | 224 | 0.4% | View All 62 Rows |
Sex and Age in Bellevue
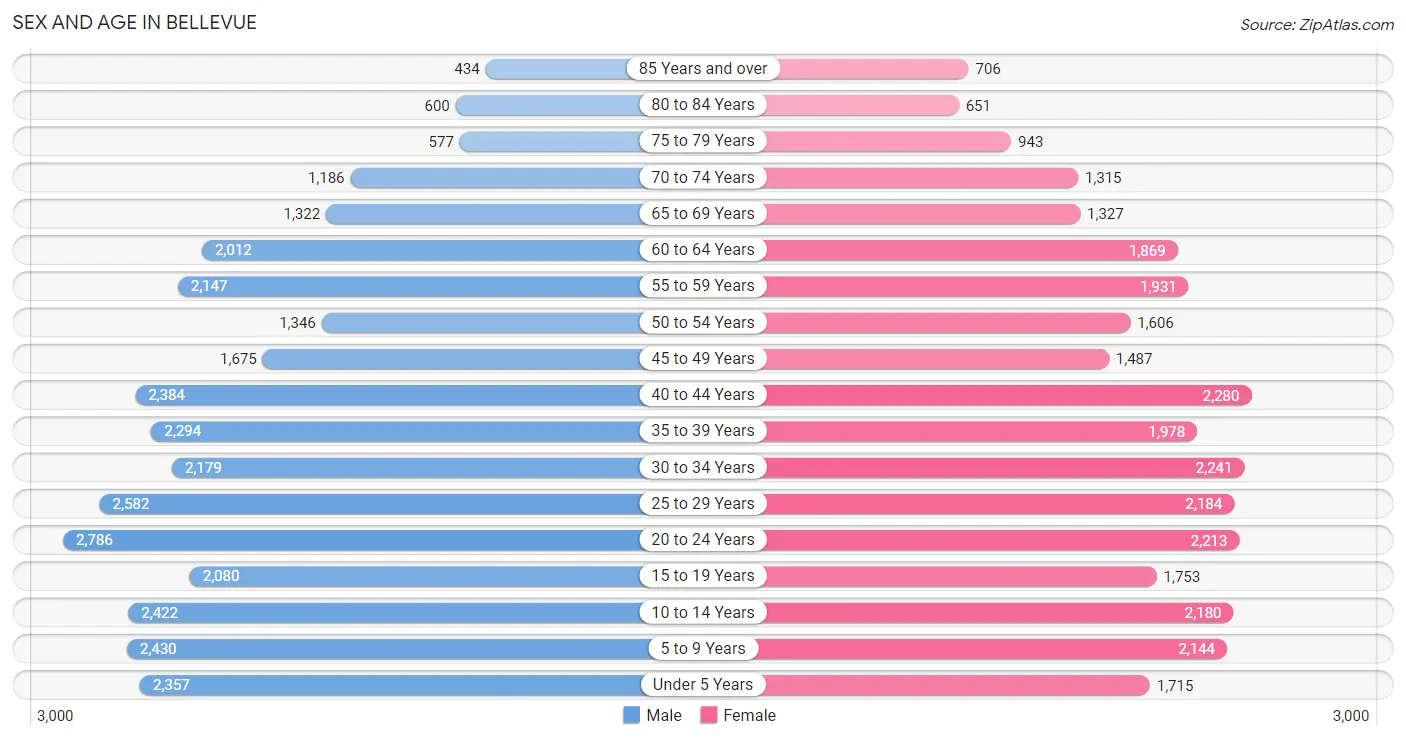
Sex and Age in Bellevue
The most populous age groups in Bellevue are 20 to 24 Years (2,786 | 8.5%) for men and 40 to 44 Years (2,280 | 7.5%) for women.
| Age Bracket | Male | Female |
| Under 5 Years | 2,357 (7.2%) | 1,715 (5.6%) |
| 5 to 9 Years | 2,430 (7.4%) | 2,144 (7.0%) |
| 10 to 14 Years | 2,422 (7.4%) | 2,180 (7.1%) |
| 15 to 19 Years | 2,080 (6.3%) | 1,753 (5.7%) |
| 20 to 24 Years | 2,786 (8.5%) | 2,213 (7.2%) |
| 25 to 29 Years | 2,582 (7.9%) | 2,184 (7.2%) |
| 30 to 34 Years | 2,179 (6.6%) | 2,241 (7.3%) |
| 35 to 39 Years | 2,294 (7.0%) | 1,978 (6.5%) |
| 40 to 44 Years | 2,384 (7.3%) | 2,280 (7.5%) |
| 45 to 49 Years | 1,675 (5.1%) | 1,487 (4.9%) |
| 50 to 54 Years | 1,346 (4.1%) | 1,606 (5.3%) |
| 55 to 59 Years | 2,147 (6.5%) | 1,931 (6.3%) |
| 60 to 64 Years | 2,012 (6.1%) | 1,869 (6.1%) |
| 65 to 69 Years | 1,322 (4.0%) | 1,327 (4.3%) |
| 70 to 74 Years | 1,186 (3.6%) | 1,315 (4.3%) |
| 75 to 79 Years | 577 (1.8%) | 943 (3.1%) |
| 80 to 84 Years | 600 (1.8%) | 651 (2.1%) |
| 85 Years and over | 434 (1.3%) | 706 (2.3%) |
| Total | 32,813 (100.0%) | 30,523 (100.0%) |
Families and Households in Bellevue
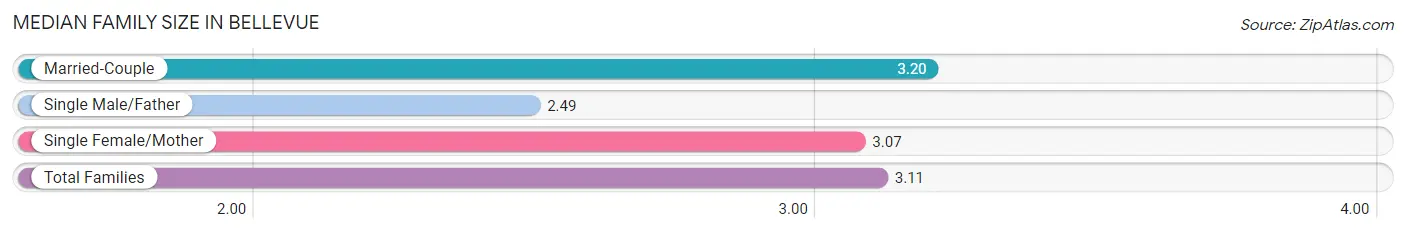
Median Family Size in Bellevue
The median family size in Bellevue is 3.11 persons per family, with married-couple families (11,769 | 72.3%) accounting for the largest median family size of 3.2 persons per family. On the other hand, single male/father families (1,629 | 10.0%) represent the smallest median family size with 2.49 persons per family.
| Family Type | # Families | Family Size |
| Married-Couple | 11,769 (72.3%) | 3.20 |
| Single Male/Father | 1,629 (10.0%) | 2.49 |
| Single Female/Mother | 2,874 (17.7%) | 3.07 |
| Total Families | 16,272 (100.0%) | 3.11 |
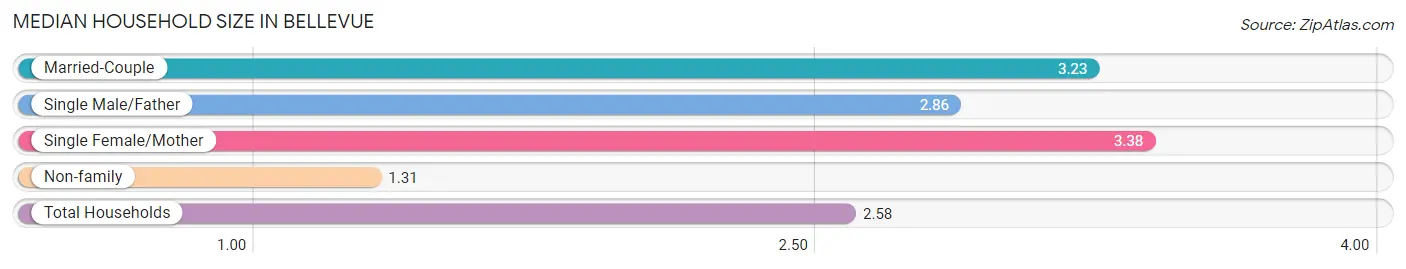
Median Household Size in Bellevue
The median household size in Bellevue is 2.58 persons per household, with single female/mother households (2,874 | 11.8%) accounting for the largest median household size of 3.38 persons per household. non-family households (8,170 | 33.4%) represent the smallest median household size with 1.31 persons per household.
| Household Type | # Households | Household Size |
| Married-Couple | 11,769 (48.1%) | 3.23 |
| Single Male/Father | 1,629 (6.7%) | 2.86 |
| Single Female/Mother | 2,874 (11.8%) | 3.38 |
| Non-family | 8,170 (33.4%) | 1.31 |
| Total Households | 24,442 (100.0%) | 2.58 |
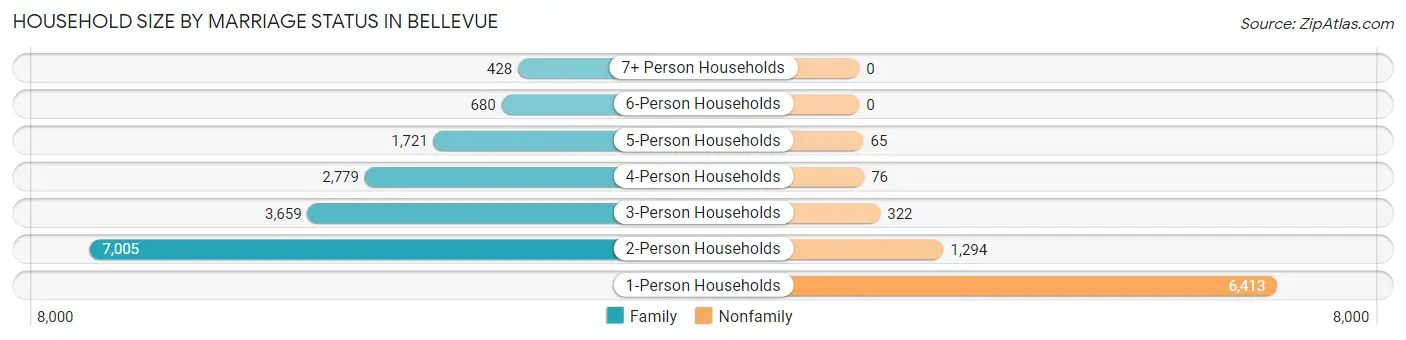
Household Size by Marriage Status in Bellevue
Out of a total of 24,442 households in Bellevue, 16,272 (66.6%) are family households, while 8,170 (33.4%) are nonfamily households. The most numerous type of family households are 2-person households, comprising 7,005, and the most common type of nonfamily households are 1-person households, comprising 6,413.
| Household Size | Family Households | Nonfamily Households |
| 1-Person Households | - | 6,413 (26.2%) |
| 2-Person Households | 7,005 (28.7%) | 1,294 (5.3%) |
| 3-Person Households | 3,659 (15.0%) | 322 (1.3%) |
| 4-Person Households | 2,779 (11.4%) | 76 (0.3%) |
| 5-Person Households | 1,721 (7.0%) | 65 (0.3%) |
| 6-Person Households | 680 (2.8%) | 0 (0.0%) |
| 7+ Person Households | 428 (1.8%) | 0 (0.0%) |
| Total | 16,272 (66.6%) | 8,170 (33.4%) |
Female Fertility in Bellevue
Fertility by Age in Bellevue
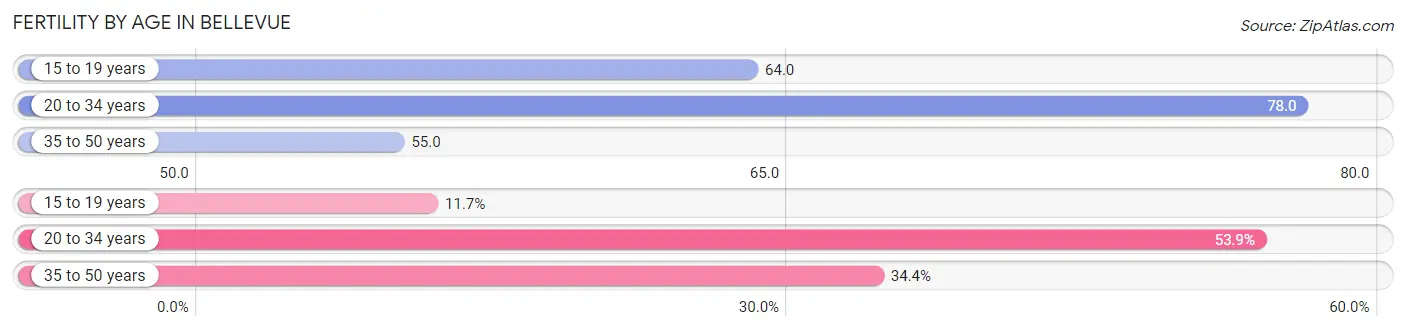
Average fertility rate in Bellevue is 67.0 births per 1,000 women. Women in the age bracket of 20 to 34 years have the highest fertility rate with 78.0 births per 1,000 women. Women in the age bracket of 20 to 34 years acount for 53.9% of all women with births.
| Age Bracket | Women with Births | Births / 1,000 Women |
| 15 to 19 years | 113 (11.7%) | 64.0 |
| 20 to 34 years | 520 (53.9%) | 78.0 |
| 35 to 50 years | 332 (34.4%) | 55.0 |
| Total | 965 (100.0%) | 67.0 |
Fertility by Age by Marriage Status in Bellevue
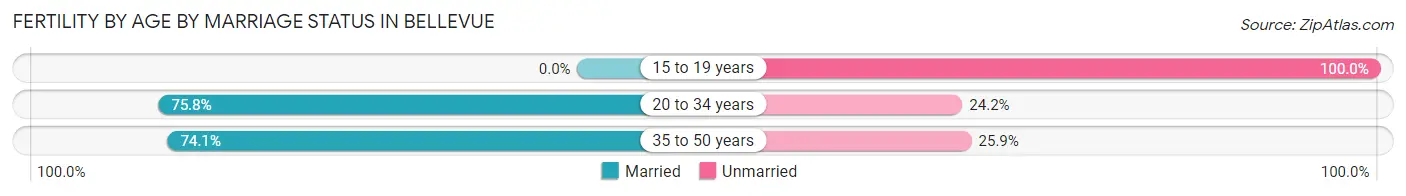
66.3% of women with births (965) in Bellevue are married. The highest percentage of unmarried women with births falls into 15 to 19 years age bracket with 100.0% of them unmarried at the time of birth, while the lowest percentage of unmarried women with births belong to 20 to 34 years age bracket with 24.2% of them unmarried.
| Age Bracket | Married | Unmarried |
| 15 to 19 years | 0 (0.0%) | 113 (100.0%) |
| 20 to 34 years | 394 (75.8%) | 126 (24.2%) |
| 35 to 50 years | 246 (74.1%) | 86 (25.9%) |
| Total | 640 (66.3%) | 325 (33.7%) |
Fertility by Education in Bellevue
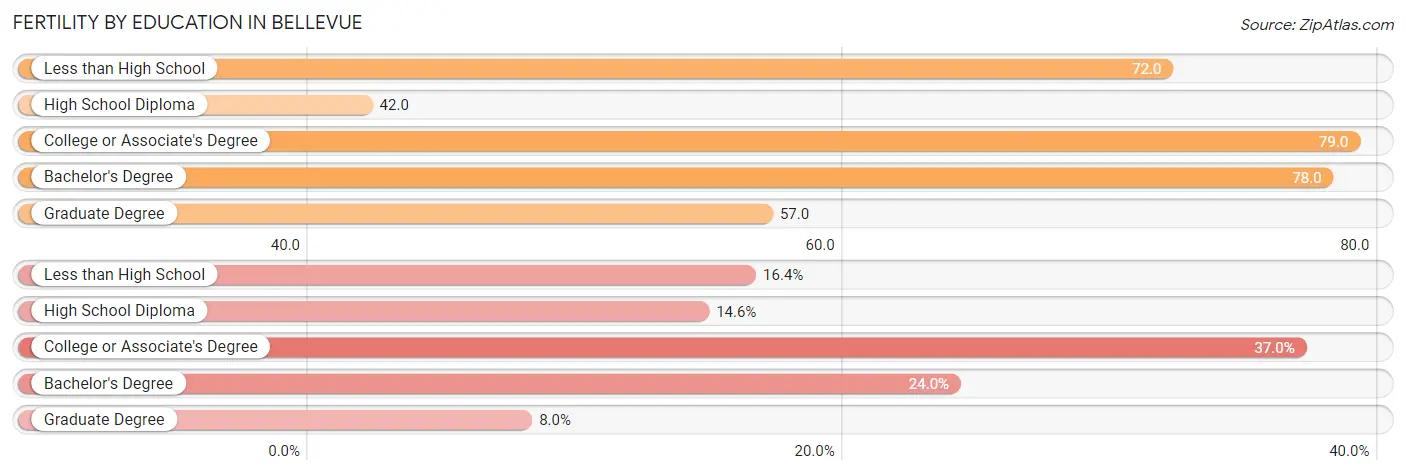
Average fertility rate in Bellevue is 67.0 births per 1,000 women. Women with the education attainment of college or associate's degree have the highest fertility rate of 79.0 births per 1,000 women, while women with the education attainment of high school diploma have the lowest fertility at 42.0 births per 1,000 women. Women with the education attainment of college or associate's degree represent 37.0% of all women with births.
| Educational Attainment | Women with Births | Births / 1,000 Women |
| Less than High School | 158 (16.4%) | 72.0 |
| High School Diploma | 141 (14.6%) | 42.0 |
| College or Associate's Degree | 357 (37.0%) | 79.0 |
| Bachelor's Degree | 232 (24.0%) | 78.0 |
| Graduate Degree | 77 (8.0%) | 57.0 |
| Total | 965 (100.0%) | 67.0 |
Fertility by Education by Marriage Status in Bellevue
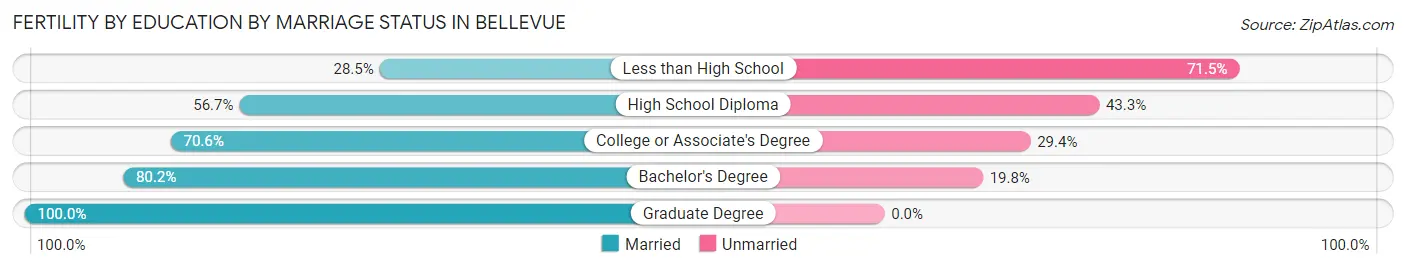
33.7% of women with births in Bellevue are unmarried. Women with the educational attainment of graduate degree are most likely to be married with 100.0% of them married at childbirth, while women with the educational attainment of less than high school are least likely to be married with 71.5% of them unmarried at childbirth.
| Educational Attainment | Married | Unmarried |
| Less than High School | 45 (28.5%) | 113 (71.5%) |
| High School Diploma | 80 (56.7%) | 61 (43.3%) |
| College or Associate's Degree | 252 (70.6%) | 105 (29.4%) |
| Bachelor's Degree | 186 (80.2%) | 46 (19.8%) |
| Graduate Degree | 77 (100.0%) | 0 (0.0%) |
| Total | 640 (66.3%) | 325 (33.7%) |
Income in Bellevue
Income Overview in Bellevue
Per Capita Income in Bellevue is $37,028, while median incomes of families and households are $96,282 and $79,839 respectively.
| Characteristic | Number | Measure |
| Per Capita Income | 63,336 | $37,028 |
| Median Family Income | 16,272 | $96,282 |
| Mean Family Income | 16,272 | $108,685 |
| Median Household Income | 24,442 | $79,839 |
| Mean Household Income | 24,442 | $94,118 |
| Income Deficit | 16,272 | $10,323 |
| Wage / Income Gap (%) | 63,336 | 28.45% |
| Wage / Income Gap ($) | 63,336 | 71.55¢ per $1 |
| Gini / Inequality Index | 63,336 | 0.39 |
Earnings by Sex in Bellevue
Average Earnings in Bellevue are $44,594, $50,623 for men and $36,222 for women, a difference of 28.4%.
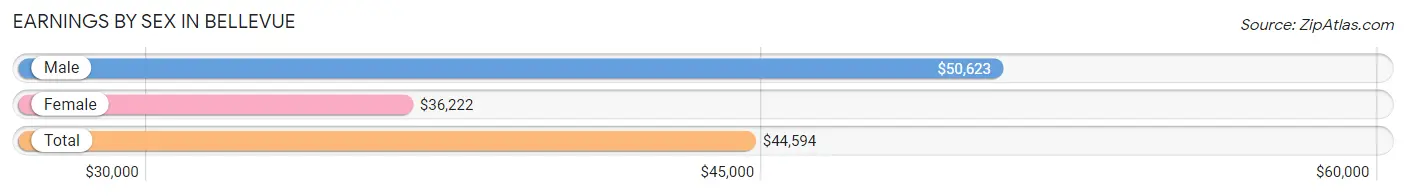
| Sex | Number | Average Earnings |
| Male | 19,383 (55.0%) | $50,623 |
| Female | 15,861 (45.0%) | $36,222 |
| Total | 35,244 (100.0%) | $44,594 |
Earnings by Sex by Income Bracket in Bellevue
The most common earnings brackets in Bellevue are $100,000+ for men (2,827 | 14.6%) and $55,000 to $64,999 for women (1,365 | 8.6%).
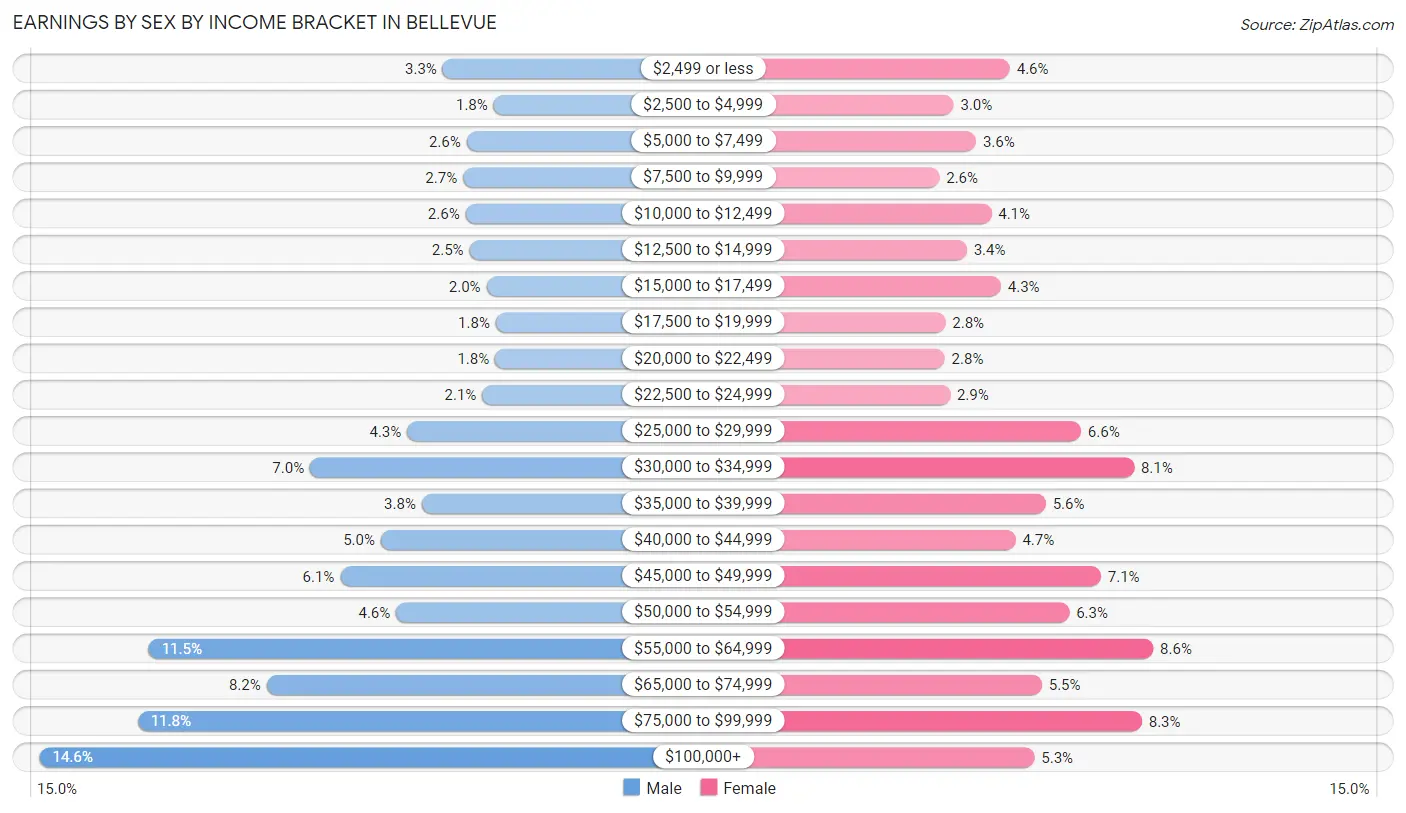
| Income | Male | Female |
| $2,499 or less | 630 (3.3%) | 727 (4.6%) |
| $2,500 to $4,999 | 352 (1.8%) | 476 (3.0%) |
| $5,000 to $7,499 | 501 (2.6%) | 575 (3.6%) |
| $7,500 to $9,999 | 519 (2.7%) | 413 (2.6%) |
| $10,000 to $12,499 | 505 (2.6%) | 644 (4.1%) |
| $12,500 to $14,999 | 484 (2.5%) | 535 (3.4%) |
| $15,000 to $17,499 | 392 (2.0%) | 686 (4.3%) |
| $17,500 to $19,999 | 341 (1.8%) | 439 (2.8%) |
| $20,000 to $22,499 | 345 (1.8%) | 436 (2.8%) |
| $22,500 to $24,999 | 414 (2.1%) | 460 (2.9%) |
| $25,000 to $29,999 | 823 (4.3%) | 1,044 (6.6%) |
| $30,000 to $34,999 | 1,353 (7.0%) | 1,280 (8.1%) |
| $35,000 to $39,999 | 745 (3.8%) | 886 (5.6%) |
| $40,000 to $44,999 | 968 (5.0%) | 752 (4.7%) |
| $45,000 to $49,999 | 1,189 (6.1%) | 1,132 (7.1%) |
| $50,000 to $54,999 | 884 (4.6%) | 991 (6.2%) |
| $55,000 to $64,999 | 2,231 (11.5%) | 1,365 (8.6%) |
| $65,000 to $74,999 | 1,589 (8.2%) | 869 (5.5%) |
| $75,000 to $99,999 | 2,291 (11.8%) | 1,315 (8.3%) |
| $100,000+ | 2,827 (14.6%) | 836 (5.3%) |
| Total | 19,383 (100.0%) | 15,861 (100.0%) |
Earnings by Sex by Educational Attainment in Bellevue
Average earnings in Bellevue are $58,398 for men and $42,327 for women, a difference of 27.5%. Men with an educational attainment of graduate degree enjoy the highest average annual earnings of $100,455, while those with high school diploma education earn the least with $41,933. Women with an educational attainment of graduate degree earn the most with the average annual earnings of $62,228, while those with less than high school education have the smallest earnings of $19,948.
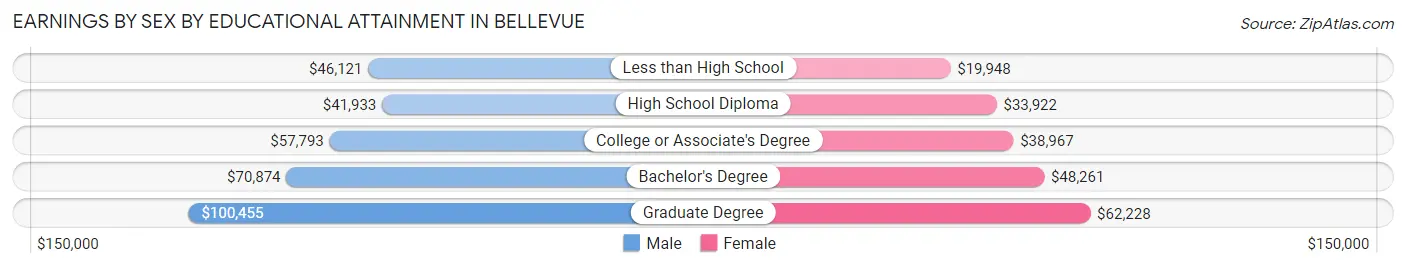
| Educational Attainment | Male Income | Female Income |
| Less than High School | $46,121 | $19,948 |
| High School Diploma | $41,933 | $33,922 |
| College or Associate's Degree | $57,793 | $38,967 |
| Bachelor's Degree | $70,874 | $48,261 |
| Graduate Degree | $100,455 | $62,228 |
| Total | $58,398 | $42,327 |
Family Income in Bellevue
Family Income Brackets in Bellevue
According to the Bellevue family income data, there are 4,377 families falling into the $100,000 to $149,999 income range, which is the most common income bracket and makes up 26.9% of all families. Conversely, the $10,000 to $14,999 income bracket is the least frequent group with only 228 families (1.4%) belonging to this category.
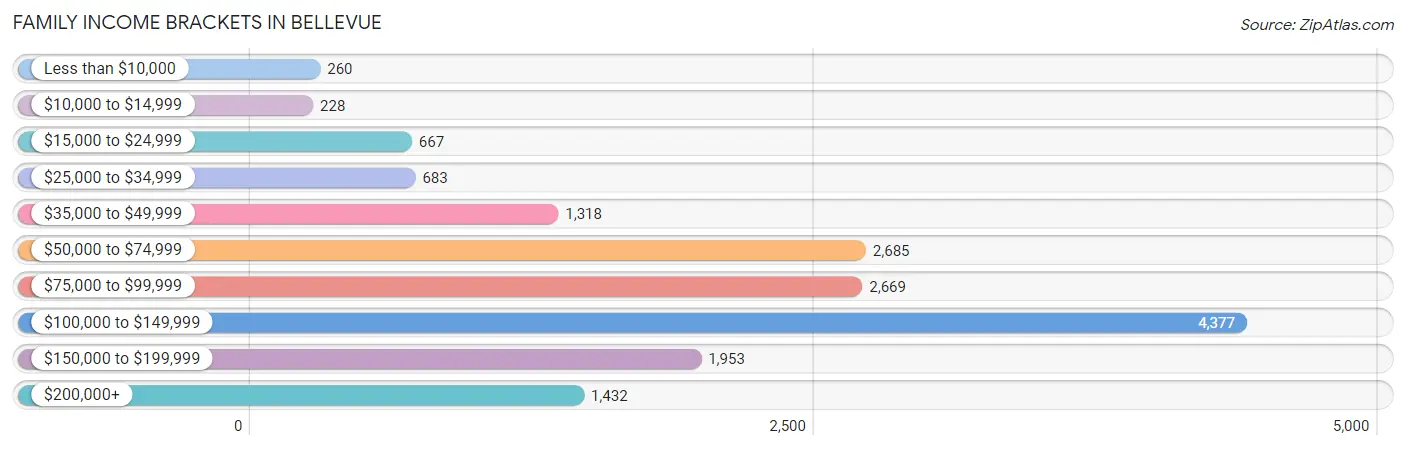
| Income Bracket | # Families | % Families |
| Less than $10,000 | 260 | 1.6% |
| $10,000 to $14,999 | 228 | 1.4% |
| $15,000 to $24,999 | 667 | 4.1% |
| $25,000 to $34,999 | 683 | 4.2% |
| $35,000 to $49,999 | 1,318 | 8.1% |
| $50,000 to $74,999 | 2,685 | 16.5% |
| $75,000 to $99,999 | 2,669 | 16.4% |
| $100,000 to $149,999 | 4,377 | 26.9% |
| $150,000 to $199,999 | 1,953 | 12.0% |
| $200,000+ | 1,432 | 8.8% |
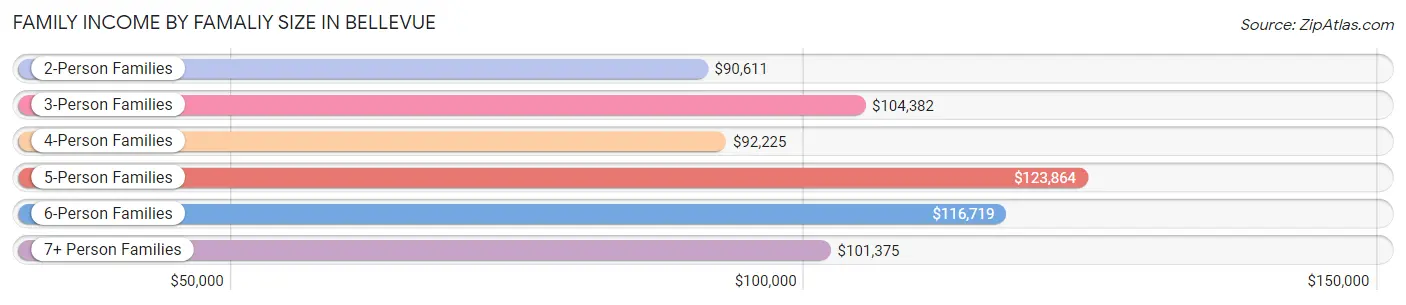
Family Income by Famaliy Size in Bellevue
5-person families (1,502 | 9.2%) account for the highest median family income in Bellevue with $123,864 per family, while 2-person families (7,423 | 45.6%) have the highest median income of $45,306 per family member.
| Income Bracket | # Families | Median Income |
| 2-Person Families | 7,423 (45.6%) | $90,611 |
| 3-Person Families | 3,678 (22.6%) | $104,382 |
| 4-Person Families | 2,795 (17.2%) | $92,225 |
| 5-Person Families | 1,502 (9.2%) | $123,864 |
| 6-Person Families | 583 (3.6%) | $116,719 |
| 7+ Person Families | 291 (1.8%) | $101,375 |
| Total | 16,272 (100.0%) | $96,282 |
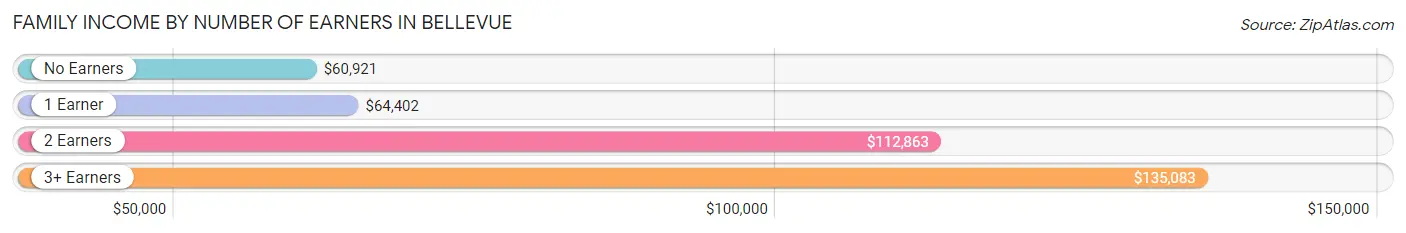
Family Income by Number of Earners in Bellevue
The median family income in Bellevue is $96,282, with families comprising 3+ earners (2,108) having the highest median family income of $135,083, while families with no earners (2,188) have the lowest median family income of $60,921, accounting for 13.0% and 13.5% of families, respectively.
| Number of Earners | # Families | Median Income |
| No Earners | 2,188 (13.5%) | $60,921 |
| 1 Earner | 5,197 (31.9%) | $64,402 |
| 2 Earners | 6,779 (41.7%) | $112,863 |
| 3+ Earners | 2,108 (13.0%) | $135,083 |
| Total | 16,272 (100.0%) | $96,282 |
Household Income in Bellevue
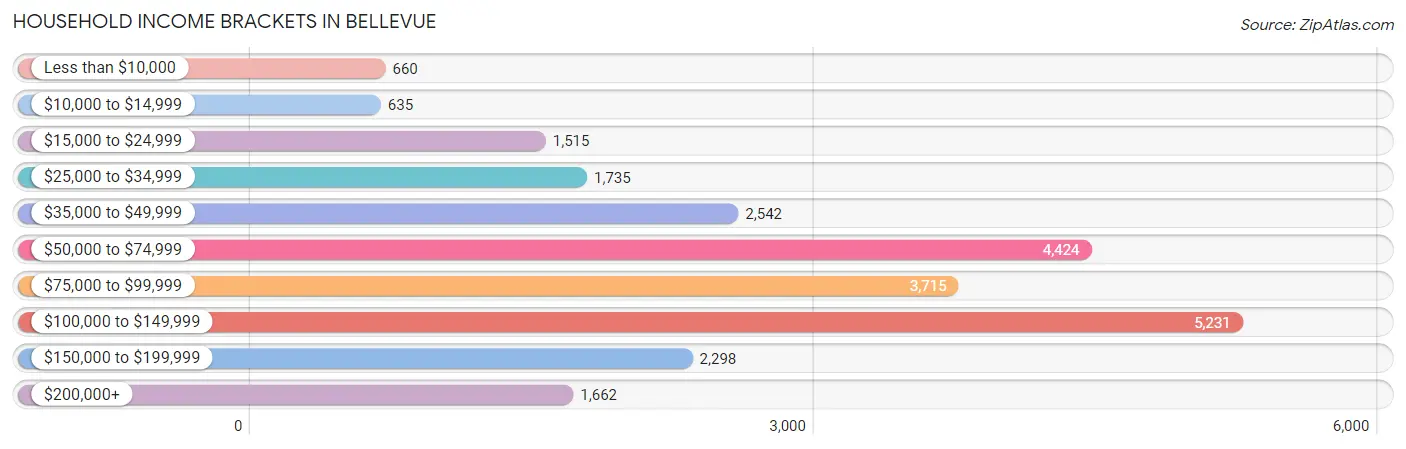
Household Income Brackets in Bellevue
With 5,231 households falling in the category, the $100,000 to $149,999 income range is the most frequent in Bellevue, accounting for 21.4% of all households. In contrast, only 635 households (2.6%) fall into the $10,000 to $14,999 income bracket, making it the least populous group.
| Income Bracket | # Households | % Households |
| Less than $10,000 | 660 | 2.7% |
| $10,000 to $14,999 | 635 | 2.6% |
| $15,000 to $24,999 | 1,515 | 6.2% |
| $25,000 to $34,999 | 1,735 | 7.1% |
| $35,000 to $49,999 | 2,542 | 10.4% |
| $50,000 to $74,999 | 4,424 | 18.1% |
| $75,000 to $99,999 | 3,715 | 15.2% |
| $100,000 to $149,999 | 5,231 | 21.4% |
| $150,000 to $199,999 | 2,298 | 9.4% |
| $200,000+ | 1,662 | 6.8% |
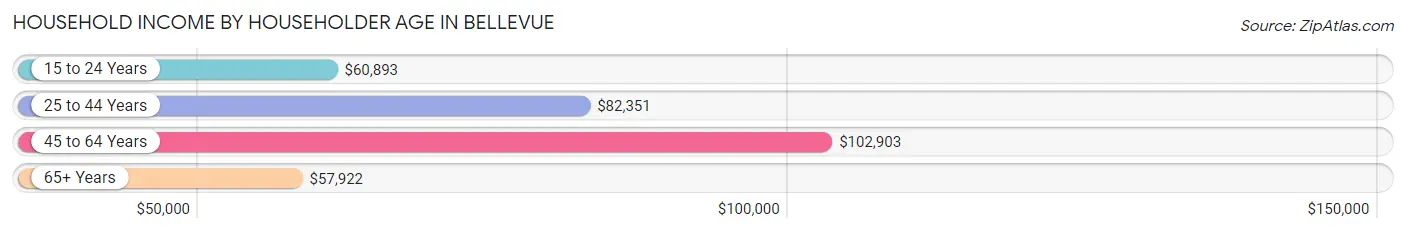
Household Income by Householder Age in Bellevue
The median household income in Bellevue is $79,839, with the highest median household income of $102,903 found in the 45 to 64 years age bracket for the primary householder. A total of 8,087 households (33.1%) fall into this category. Meanwhile, the 65+ years age bracket for the primary householder has the lowest median household income of $57,922, with 5,614 households (23.0%) in this group.
| Income Bracket | # Households | Median Income |
| 15 to 24 Years | 1,424 (5.8%) | $60,893 |
| 25 to 44 Years | 9,317 (38.1%) | $82,351 |
| 45 to 64 Years | 8,087 (33.1%) | $102,903 |
| 65+ Years | 5,614 (23.0%) | $57,922 |
| Total | 24,442 (100.0%) | $79,839 |
Poverty in Bellevue
Income Below Poverty by Sex and Age in Bellevue
With 8.1% poverty level for males and 8.7% for females among the residents of Bellevue, 5 year old males and under 5 year old females are the most vulnerable to poverty, with 67 males (19.8%) and 242 females (15.1%) in their respective age groups living below the poverty level.
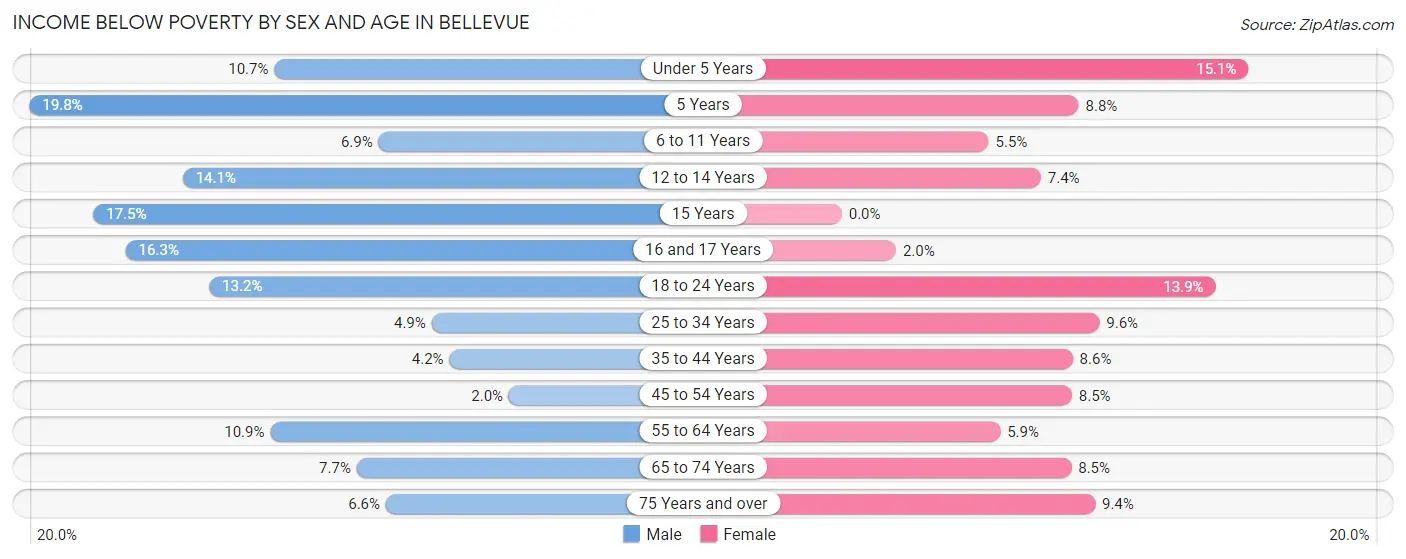
| Age Bracket | Male | Female |
| Under 5 Years | 247 (10.7%) | 242 (15.1%) |
| 5 Years | 67 (19.8%) | 40 (8.8%) |
| 6 to 11 Years | 202 (6.9%) | 139 (5.4%) |
| 12 to 14 Years | 204 (14.1%) | 87 (7.4%) |
| 15 Years | 56 (17.4%) | 0 (0.0%) |
| 16 and 17 Years | 137 (16.3%) | 15 (2.0%) |
| 18 to 24 Years | 485 (13.2%) | 396 (13.9%) |
| 25 to 34 Years | 233 (4.9%) | 423 (9.6%) |
| 35 to 44 Years | 198 (4.2%) | 365 (8.6%) |
| 45 to 54 Years | 61 (2.0%) | 264 (8.5%) |
| 55 to 64 Years | 452 (10.9%) | 223 (5.9%) |
| 65 to 74 Years | 191 (7.7%) | 225 (8.5%) |
| 75 Years and over | 103 (6.6%) | 207 (9.4%) |
| Total | 2,636 (8.1%) | 2,626 (8.7%) |
Income Above Poverty by Sex and Age in Bellevue
According to the poverty statistics in Bellevue, males aged 45 to 54 years and females aged 15 years are the age groups that are most secure financially, with 98.0% of males and 100.0% of females in these age groups living above the poverty line.
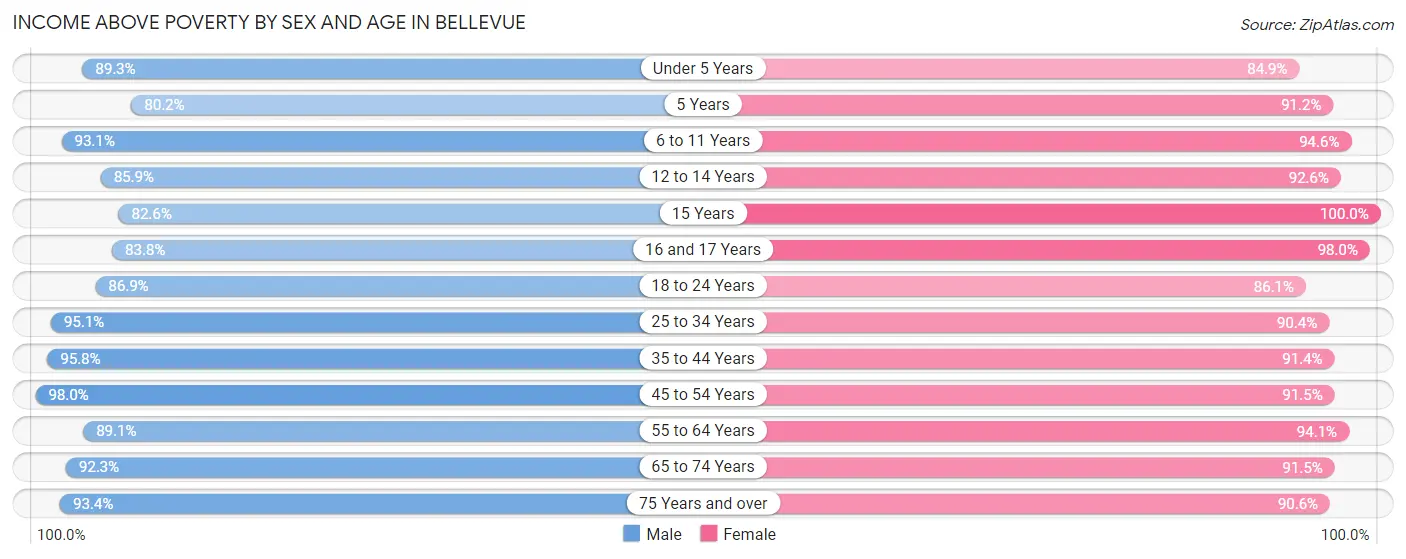
| Age Bracket | Male | Female |
| Under 5 Years | 2,054 (89.3%) | 1,362 (84.9%) |
| 5 Years | 271 (80.2%) | 415 (91.2%) |
| 6 to 11 Years | 2,744 (93.1%) | 2,410 (94.6%) |
| 12 to 14 Years | 1,240 (85.9%) | 1,090 (92.6%) |
| 15 Years | 265 (82.6%) | 340 (100.0%) |
| 16 and 17 Years | 706 (83.8%) | 733 (98.0%) |
| 18 to 24 Years | 3,203 (86.9%) | 2,459 (86.1%) |
| 25 to 34 Years | 4,528 (95.1%) | 4,002 (90.4%) |
| 35 to 44 Years | 4,480 (95.8%) | 3,893 (91.4%) |
| 45 to 54 Years | 2,960 (98.0%) | 2,829 (91.5%) |
| 55 to 64 Years | 3,701 (89.1%) | 3,570 (94.1%) |
| 65 to 74 Years | 2,299 (92.3%) | 2,417 (91.5%) |
| 75 Years and over | 1,459 (93.4%) | 1,994 (90.6%) |
| Total | 29,910 (91.9%) | 27,514 (91.3%) |
Income Below Poverty Among Married-Couple Families in Bellevue
The poverty statistics for married-couple families in Bellevue show that 3.1% or 369 of the total 11,769 families live below the poverty line. Families with 3 or 4 children have the highest poverty rate of 3.9%, comprising of 54 families. On the other hand, families with 5 or more children have the lowest poverty rate of 0.0%, which includes 0 families.
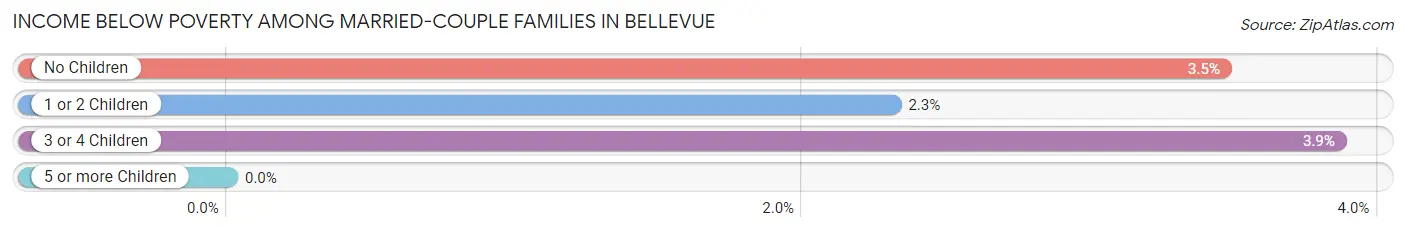
| Children | Above Poverty | Below Poverty |
| No Children | 6,588 (96.5%) | 236 (3.5%) |
| 1 or 2 Children | 3,339 (97.7%) | 79 (2.3%) |
| 3 or 4 Children | 1,344 (96.1%) | 54 (3.9%) |
| 5 or more Children | 129 (100.0%) | 0 (0.0%) |
| Total | 11,400 (96.9%) | 369 (3.1%) |
Income Below Poverty Among Single-Parent Households in Bellevue
According to the poverty data in Bellevue, 4.4% or 71 single-father households and 19.7% or 566 single-mother households are living below the poverty line. Among single-father households, those with 1 or 2 children have the highest poverty rate, with 59 households (9.5%) experiencing poverty. Likewise, among single-mother households, those with 5 or more children have the highest poverty rate, with 10 households (100.0%) falling below the poverty line.
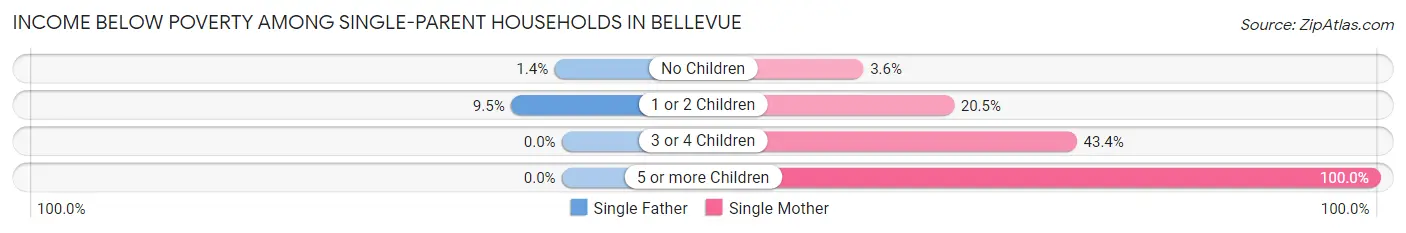
| Children | Single Father | Single Mother |
| No Children | 12 (1.4%) | 28 (3.6%) |
| 1 or 2 Children | 59 (9.5%) | 341 (20.5%) |
| 3 or 4 Children | 0 (0.0%) | 187 (43.4%) |
| 5 or more Children | 0 (0.0%) | 10 (100.0%) |
| Total | 71 (4.4%) | 566 (19.7%) |
Income Below Poverty Among Married-Couple vs Single-Parent Households in Bellevue
The poverty data for Bellevue shows that 369 of the married-couple family households (3.1%) and 637 of the single-parent households (14.1%) are living below the poverty level. Within the married-couple family households, those with 3 or 4 children have the highest poverty rate, with 54 households (3.9%) falling below the poverty line. Among the single-parent households, those with 5 or more children have the highest poverty rate, with 10 household (100.0%) living below poverty.
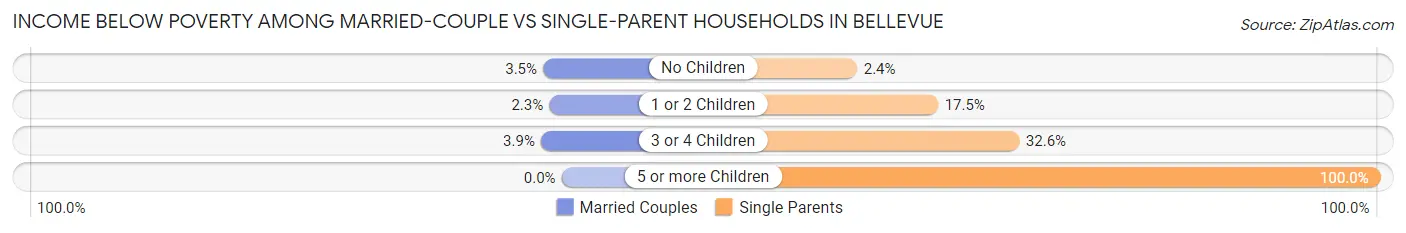
| Children | Married-Couple Families | Single-Parent Households |
| No Children | 236 (3.5%) | 40 (2.4%) |
| 1 or 2 Children | 79 (2.3%) | 400 (17.5%) |
| 3 or 4 Children | 54 (3.9%) | 187 (32.6%) |
| 5 or more Children | 0 (0.0%) | 10 (100.0%) |
| Total | 369 (3.1%) | 637 (14.1%) |
Employment Characteristics in Bellevue
Employment by Class of Employer in Bellevue
Among the 32,126 employed individuals in Bellevue, private company employees (20,473 | 63.7%), federal government employees (3,763 | 11.7%), and local government employees (2,821 | 8.8%) make up the most common classes of employment.
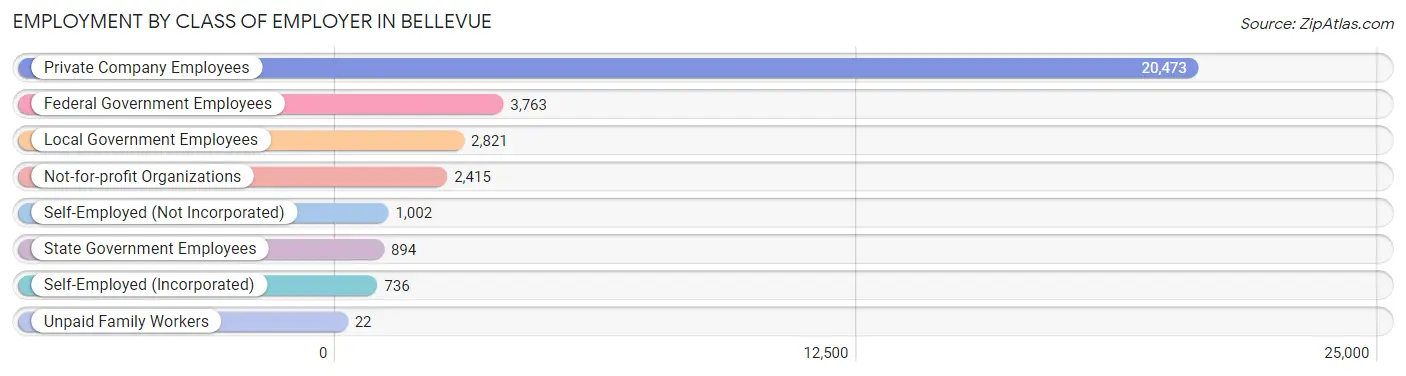
| Employer Class | # Employees | % Employees |
| Private Company Employees | 20,473 | 63.7% |
| Self-Employed (Incorporated) | 736 | 2.3% |
| Self-Employed (Not Incorporated) | 1,002 | 3.1% |
| Not-for-profit Organizations | 2,415 | 7.5% |
| Local Government Employees | 2,821 | 8.8% |
| State Government Employees | 894 | 2.8% |
| Federal Government Employees | 3,763 | 11.7% |
| Unpaid Family Workers | 22 | 0.1% |
| Total | 32,126 | 100.0% |
Employment Status by Age in Bellevue
According to the labor force statistics for Bellevue, out of the total population over 16 years of age (49,426), 68.1% or 33,659 individuals are in the labor force, with 2.9% or 976 of them unemployed. The age group with the highest labor force participation rate is 35 to 44 years, with 89.3% or 7,980 individuals in the labor force. Within the labor force, the 16 to 19 years age range has the highest percentage of unemployed individuals, with 10.0% or 158 of them being unemployed.
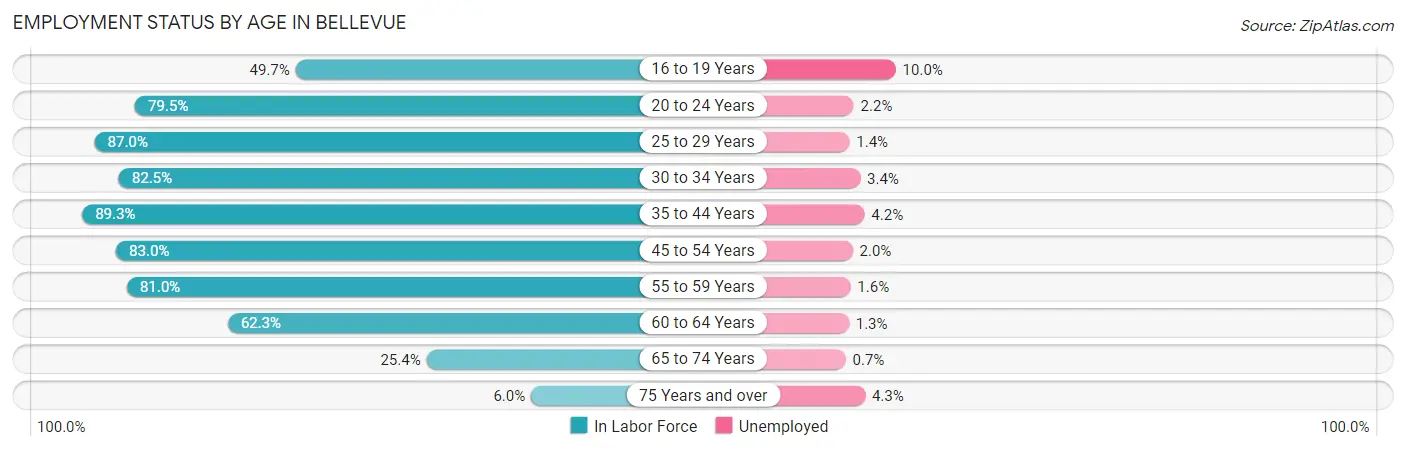
| Age Bracket | In Labor Force | Unemployed |
| 16 to 19 Years | 1,576 (49.7%) | 158 (10.0%) |
| 20 to 24 Years | 3,974 (79.5%) | 87 (2.2%) |
| 25 to 29 Years | 4,146 (87.0%) | 58 (1.4%) |
| 30 to 34 Years | 3,646 (82.5%) | 124 (3.4%) |
| 35 to 44 Years | 7,980 (89.3%) | 335 (4.2%) |
| 45 to 54 Years | 5,075 (83.0%) | 102 (2.0%) |
| 55 to 59 Years | 3,303 (81.0%) | 53 (1.6%) |
| 60 to 64 Years | 2,418 (62.3%) | 31 (1.3%) |
| 65 to 74 Years | 1,308 (25.4%) | 9 (0.7%) |
| 75 Years and over | 235 (6.0%) | 10 (4.3%) |
| Total | 33,659 (68.1%) | 976 (2.9%) |
Employment Status by Educational Attainment in Bellevue
According to labor force statistics for Bellevue, 82.5% of individuals (26,561) out of the total population between 25 and 64 years of age (32,195) are in the labor force, with 2.6% or 691 of them being unemployed. The group with the highest labor force participation rate are those with the educational attainment of bachelor's degree or higher, with 87.9% or 9,658 individuals in the labor force. Within the labor force, individuals with less than high school education have the highest percentage of unemployment, with 4.4% or 59 of them being unemployed.
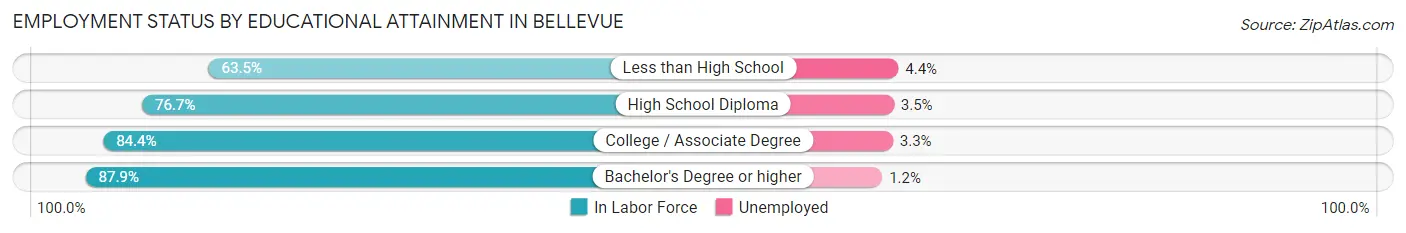
| Educational Attainment | In Labor Force | Unemployed |
| Less than High School | 1,347 (63.5%) | 93 (4.4%) |
| High School Diploma | 5,488 (76.7%) | 250 (3.5%) |
| College / Associate Degree | 10,070 (84.4%) | 394 (3.3%) |
| Bachelor's Degree or higher | 9,658 (87.9%) | 132 (1.2%) |
| Total | 26,561 (82.5%) | 837 (2.6%) |
Employment Occupations by Sex in Bellevue
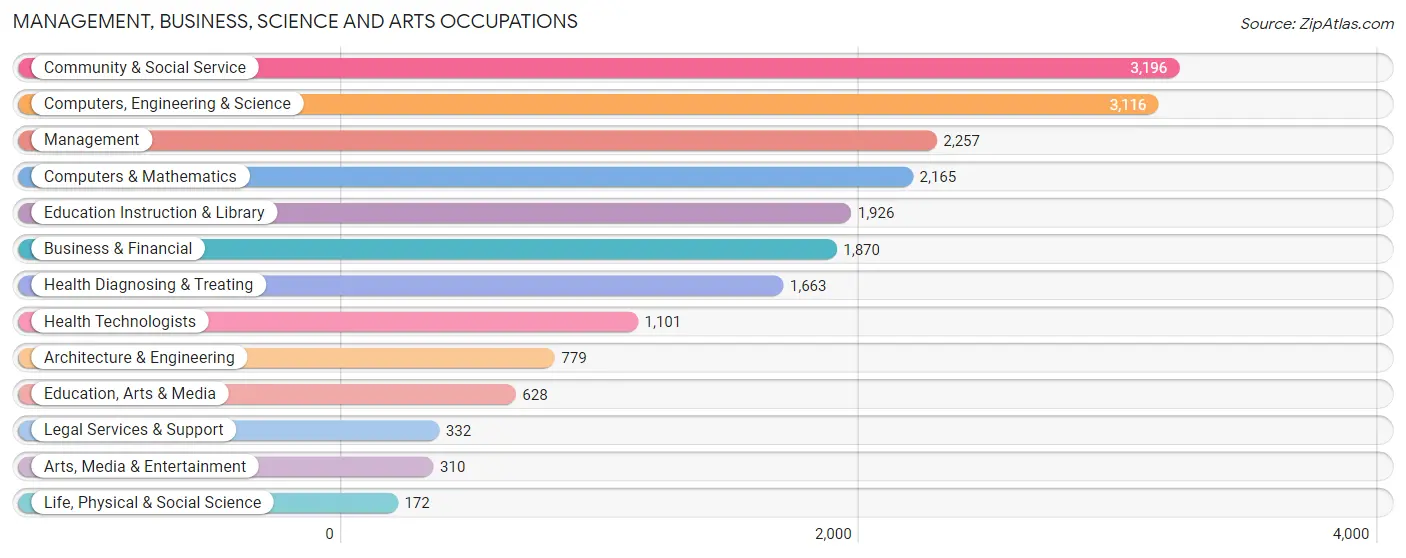
Management, Business, Science and Arts Occupations
The most common Management, Business, Science and Arts occupations in Bellevue are Community & Social Service (3,196 | 10.2%), Computers, Engineering & Science (3,116 | 10.0%), Management (2,257 | 7.2%), Computers & Mathematics (2,165 | 6.9%), and Education Instruction & Library (1,926 | 6.2%).
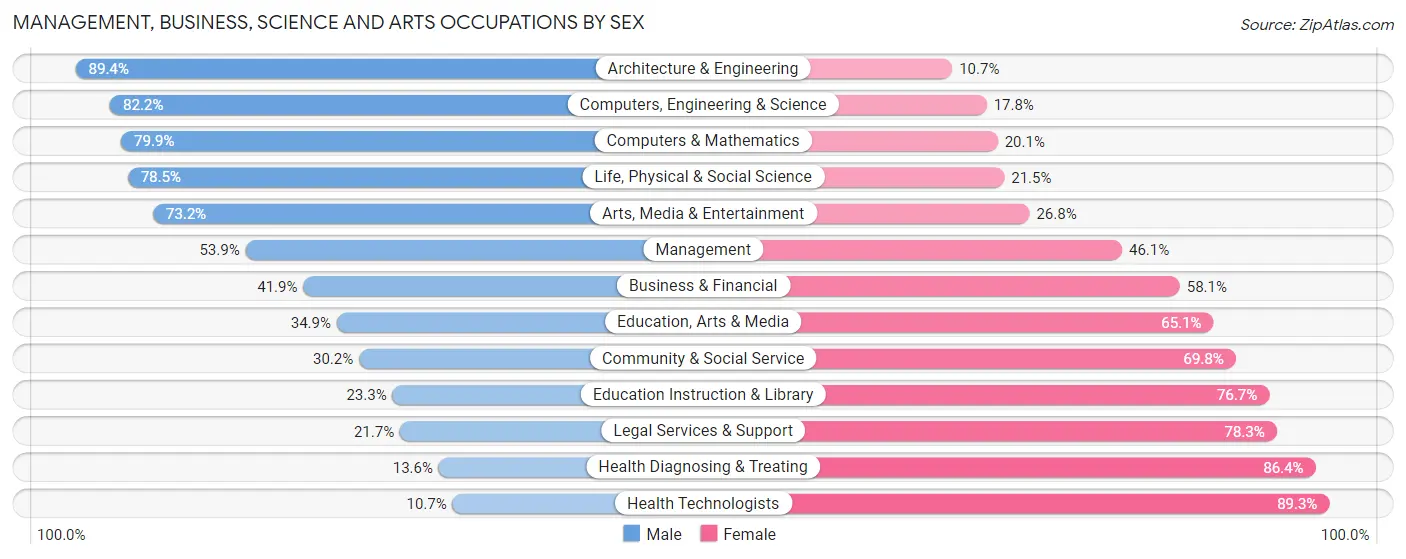
Management, Business, Science and Arts Occupations by Sex
Within the Management, Business, Science and Arts occupations in Bellevue, the most male-oriented occupations are Architecture & Engineering (89.3%), Computers, Engineering & Science (82.2%), and Computers & Mathematics (79.9%), while the most female-oriented occupations are Health Technologists (89.3%), Health Diagnosing & Treating (86.4%), and Legal Services & Support (78.3%).
| Occupation | Male | Female |
| Management | 1,217 (53.9%) | 1,040 (46.1%) |
| Business & Financial | 783 (41.9%) | 1,087 (58.1%) |
| Computers, Engineering & Science | 2,560 (82.2%) | 556 (17.8%) |
| Computers & Mathematics | 1,729 (79.9%) | 436 (20.1%) |
| Architecture & Engineering | 696 (89.3%) | 83 (10.6%) |
| Life, Physical & Social Science | 135 (78.5%) | 37 (21.5%) |
| Community & Social Service | 966 (30.2%) | 2,230 (69.8%) |
| Education, Arts & Media | 219 (34.9%) | 409 (65.1%) |
| Legal Services & Support | 72 (21.7%) | 260 (78.3%) |
| Education Instruction & Library | 448 (23.3%) | 1,478 (76.7%) |
| Arts, Media & Entertainment | 227 (73.2%) | 83 (26.8%) |
| Health Diagnosing & Treating | 226 (13.6%) | 1,437 (86.4%) |
| Health Technologists | 118 (10.7%) | 983 (89.3%) |
| Total (Category) | 5,752 (47.5%) | 6,350 (52.5%) |
| Total (Overall) | 16,739 (53.7%) | 14,440 (46.3%) |
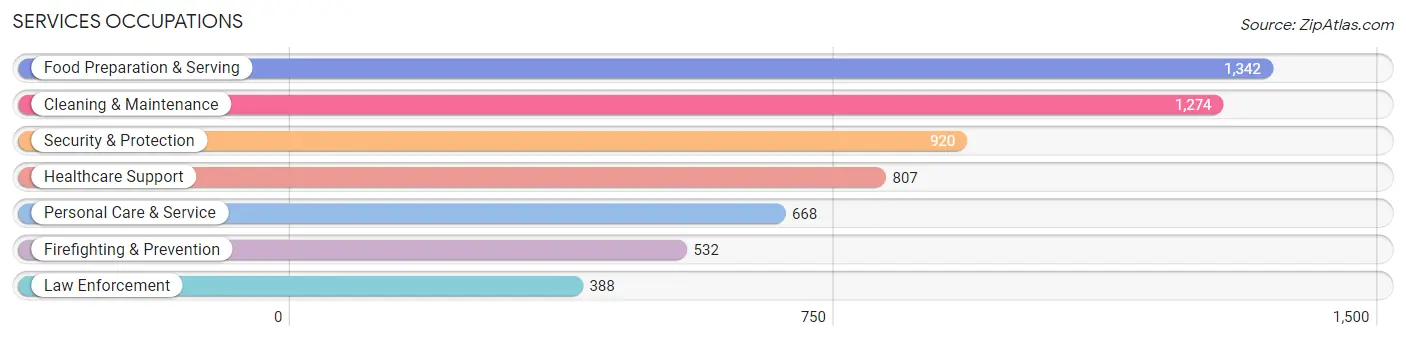
Services Occupations
The most common Services occupations in Bellevue are Food Preparation & Serving (1,342 | 4.3%), Cleaning & Maintenance (1,274 | 4.1%), Security & Protection (920 | 2.9%), Healthcare Support (807 | 2.6%), and Personal Care & Service (668 | 2.1%).
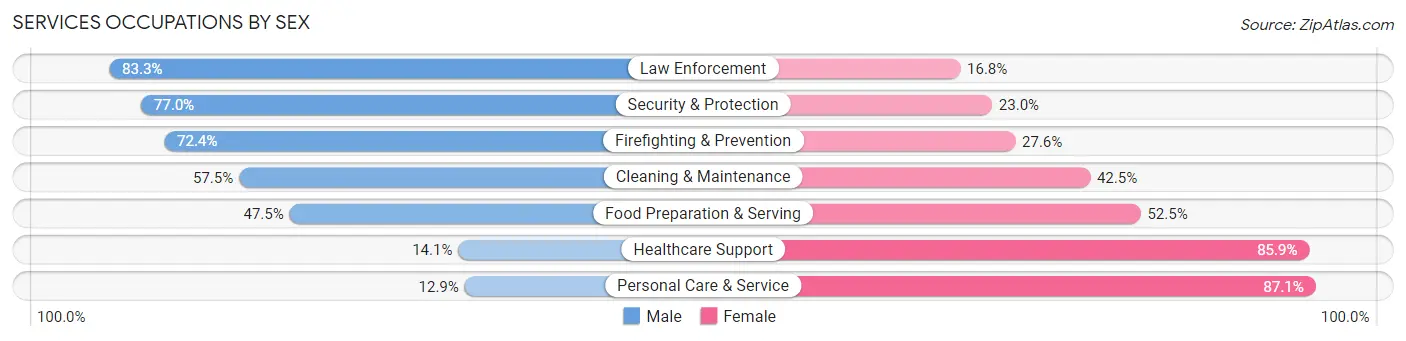
Services Occupations by Sex
Within the Services occupations in Bellevue, the most male-oriented occupations are Law Enforcement (83.3%), Security & Protection (77.0%), and Firefighting & Prevention (72.4%), while the most female-oriented occupations are Personal Care & Service (87.1%), Healthcare Support (85.9%), and Food Preparation & Serving (52.5%).
| Occupation | Male | Female |
| Healthcare Support | 114 (14.1%) | 693 (85.9%) |
| Security & Protection | 708 (77.0%) | 212 (23.0%) |
| Firefighting & Prevention | 385 (72.4%) | 147 (27.6%) |
| Law Enforcement | 323 (83.3%) | 65 (16.8%) |
| Food Preparation & Serving | 638 (47.5%) | 704 (52.5%) |
| Cleaning & Maintenance | 733 (57.5%) | 541 (42.5%) |
| Personal Care & Service | 86 (12.9%) | 582 (87.1%) |
| Total (Category) | 2,279 (45.5%) | 2,732 (54.5%) |
| Total (Overall) | 16,739 (53.7%) | 14,440 (46.3%) |
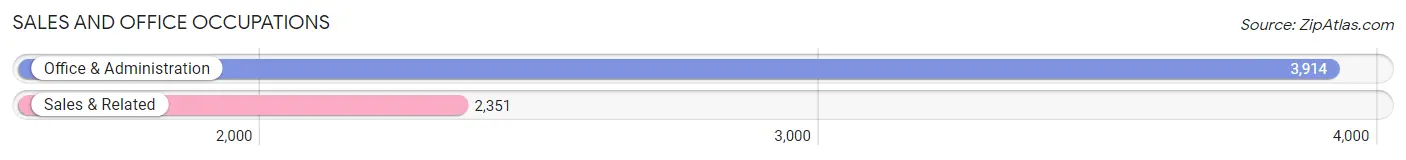
Sales and Office Occupations
The most common Sales and Office occupations in Bellevue are Office & Administration (3,914 | 12.6%), and Sales & Related (2,351 | 7.5%).
Sales and Office Occupations by Sex
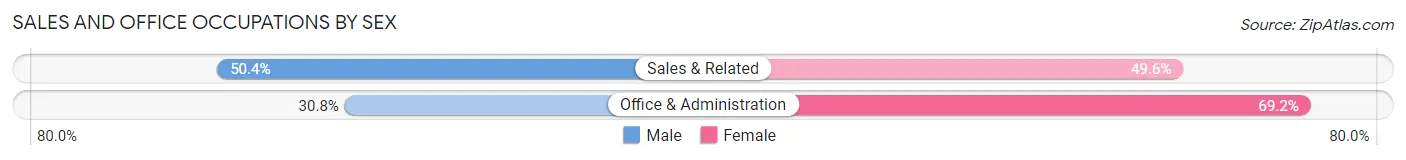
| Occupation | Male | Female |
| Sales & Related | 1,184 (50.4%) | 1,167 (49.6%) |
| Office & Administration | 1,204 (30.8%) | 2,710 (69.2%) |
| Total (Category) | 2,388 (38.1%) | 3,877 (61.9%) |
| Total (Overall) | 16,739 (53.7%) | 14,440 (46.3%) |
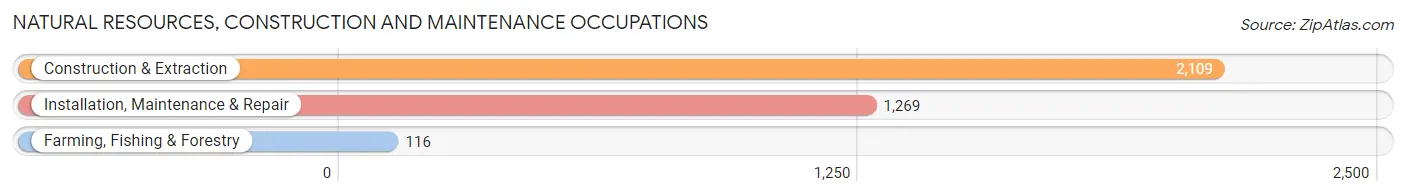
Natural Resources, Construction and Maintenance Occupations
The most common Natural Resources, Construction and Maintenance occupations in Bellevue are Construction & Extraction (2,109 | 6.8%), Installation, Maintenance & Repair (1,269 | 4.1%), and Farming, Fishing & Forestry (116 | 0.4%).
Natural Resources, Construction and Maintenance Occupations by Sex
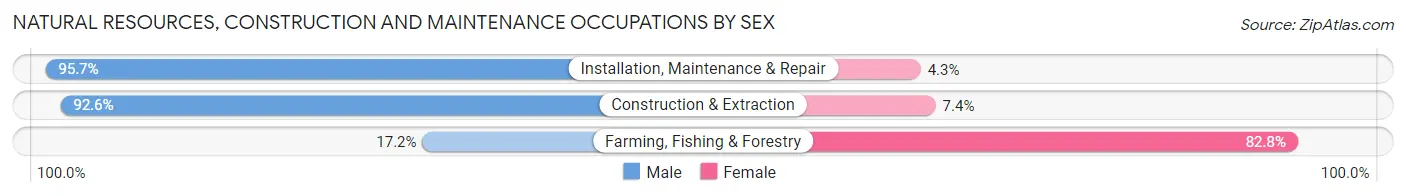
| Occupation | Male | Female |
| Farming, Fishing & Forestry | 20 (17.2%) | 96 (82.8%) |
| Construction & Extraction | 1,952 (92.6%) | 157 (7.4%) |
| Installation, Maintenance & Repair | 1,214 (95.7%) | 55 (4.3%) |
| Total (Category) | 3,186 (91.2%) | 308 (8.8%) |
| Total (Overall) | 16,739 (53.7%) | 14,440 (46.3%) |
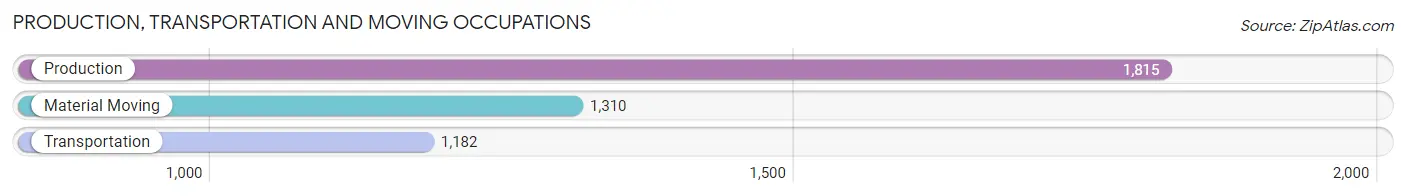
Production, Transportation and Moving Occupations
The most common Production, Transportation and Moving occupations in Bellevue are Production (1,815 | 5.8%), Material Moving (1,310 | 4.2%), and Transportation (1,182 | 3.8%).
Production, Transportation and Moving Occupations by Sex
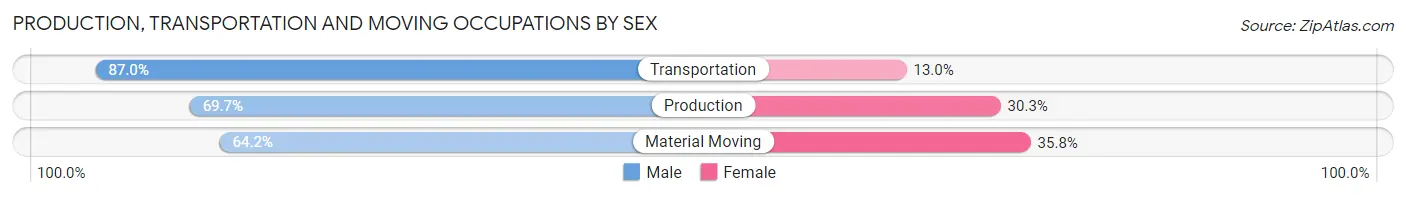
| Occupation | Male | Female |
| Production | 1,265 (69.7%) | 550 (30.3%) |
| Transportation | 1,028 (87.0%) | 154 (13.0%) |
| Material Moving | 841 (64.2%) | 469 (35.8%) |
| Total (Category) | 3,134 (72.8%) | 1,173 (27.2%) |
| Total (Overall) | 16,739 (53.7%) | 14,440 (46.3%) |
Employment Industries by Sex in Bellevue
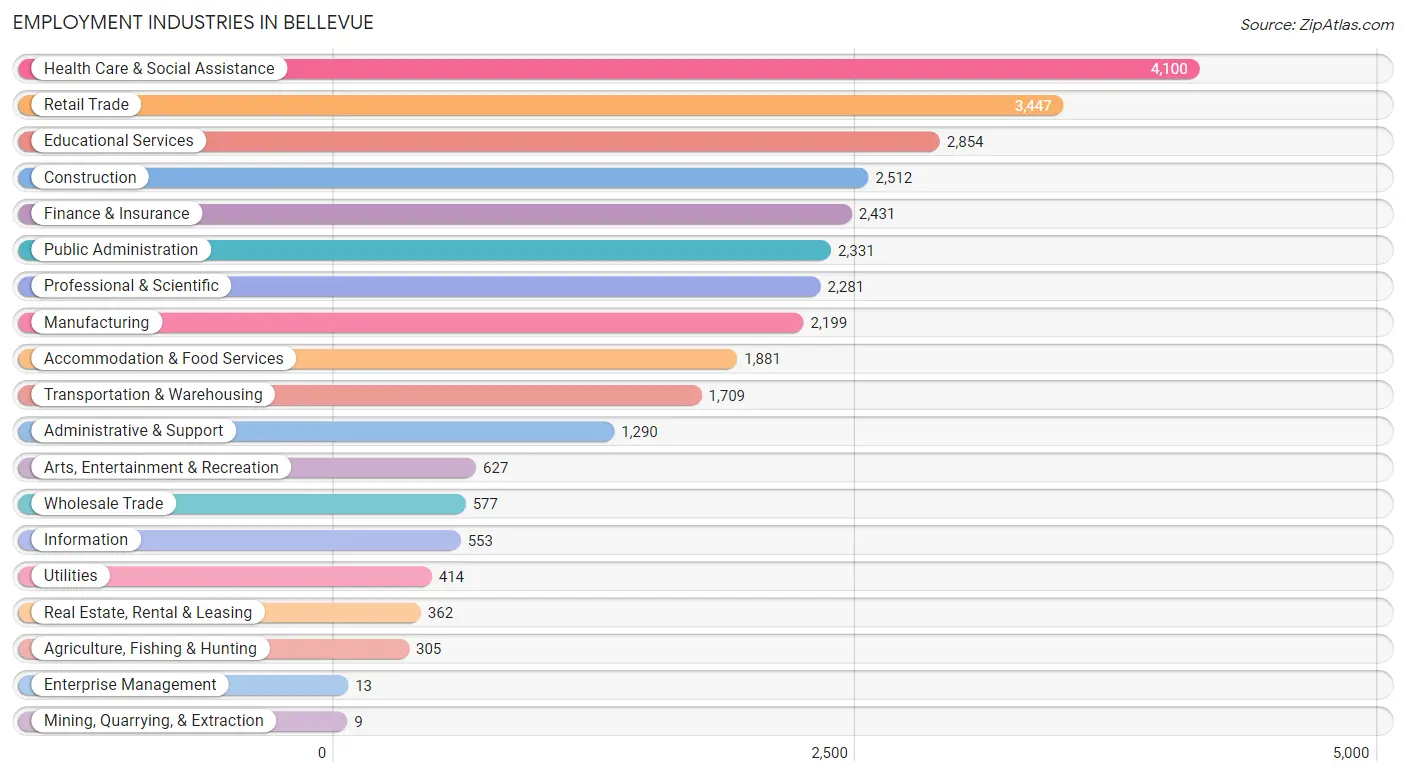
Employment Industries in Bellevue
The major employment industries in Bellevue include Health Care & Social Assistance (4,100 | 13.2%), Retail Trade (3,447 | 11.1%), Educational Services (2,854 | 9.1%), Construction (2,512 | 8.1%), and Finance & Insurance (2,431 | 7.8%).
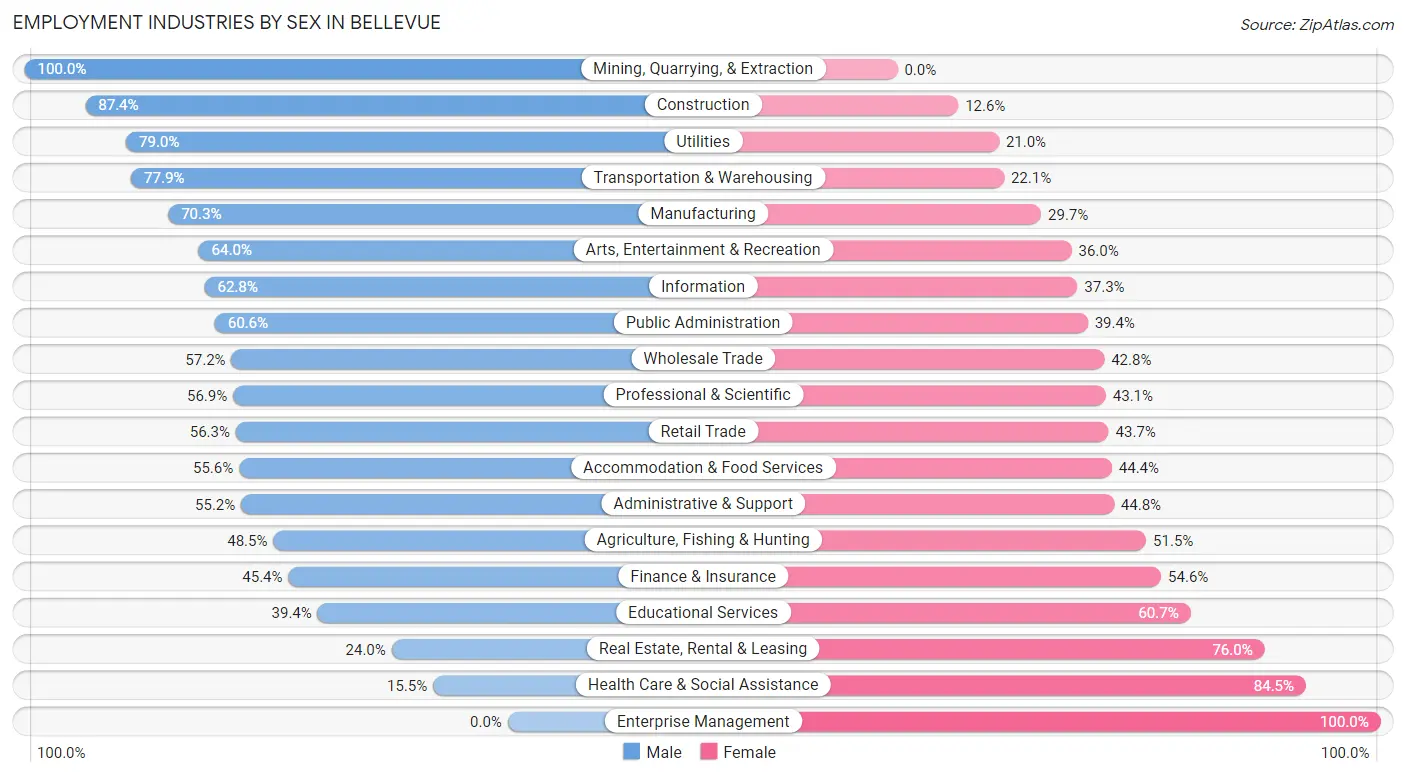
Employment Industries by Sex in Bellevue
The Bellevue industries that see more men than women are Mining, Quarrying, & Extraction (100.0%), Construction (87.4%), and Utilities (79.0%), whereas the industries that tend to have a higher number of women are Enterprise Management (100.0%), Health Care & Social Assistance (84.5%), and Real Estate, Rental & Leasing (76.0%).
| Industry | Male | Female |
| Agriculture, Fishing & Hunting | 148 (48.5%) | 157 (51.5%) |
| Mining, Quarrying, & Extraction | 9 (100.0%) | 0 (0.0%) |
| Construction | 2,196 (87.4%) | 316 (12.6%) |
| Manufacturing | 1,545 (70.3%) | 654 (29.7%) |
| Wholesale Trade | 330 (57.2%) | 247 (42.8%) |
| Retail Trade | 1,940 (56.3%) | 1,507 (43.7%) |
| Transportation & Warehousing | 1,332 (77.9%) | 377 (22.1%) |
| Utilities | 327 (79.0%) | 87 (21.0%) |
| Information | 347 (62.7%) | 206 (37.2%) |
| Finance & Insurance | 1,104 (45.4%) | 1,327 (54.6%) |
| Real Estate, Rental & Leasing | 87 (24.0%) | 275 (76.0%) |
| Professional & Scientific | 1,297 (56.9%) | 984 (43.1%) |
| Enterprise Management | 0 (0.0%) | 13 (100.0%) |
| Administrative & Support | 712 (55.2%) | 578 (44.8%) |
| Educational Services | 1,123 (39.4%) | 1,731 (60.7%) |
| Health Care & Social Assistance | 634 (15.5%) | 3,466 (84.5%) |
| Arts, Entertainment & Recreation | 401 (64.0%) | 226 (36.0%) |
| Accommodation & Food Services | 1,046 (55.6%) | 835 (44.4%) |
| Public Administration | 1,413 (60.6%) | 918 (39.4%) |
| Total | 16,739 (53.7%) | 14,440 (46.3%) |
Education in Bellevue
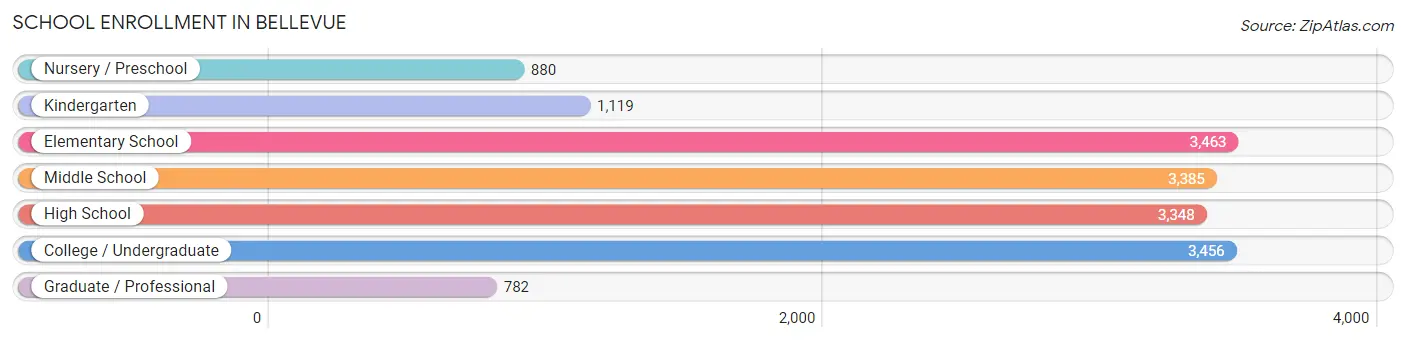
School Enrollment in Bellevue
The most common levels of schooling among the 16,433 students in Bellevue are elementary school (3,463 | 21.1%), college / undergraduate (3,456 | 21.0%), and middle school (3,385 | 20.6%).
| School Level | # Students | % Students |
| Nursery / Preschool | 880 | 5.4% |
| Kindergarten | 1,119 | 6.8% |
| Elementary School | 3,463 | 21.1% |
| Middle School | 3,385 | 20.6% |
| High School | 3,348 | 20.4% |
| College / Undergraduate | 3,456 | 21.0% |
| Graduate / Professional | 782 | 4.8% |
| Total | 16,433 | 100.0% |
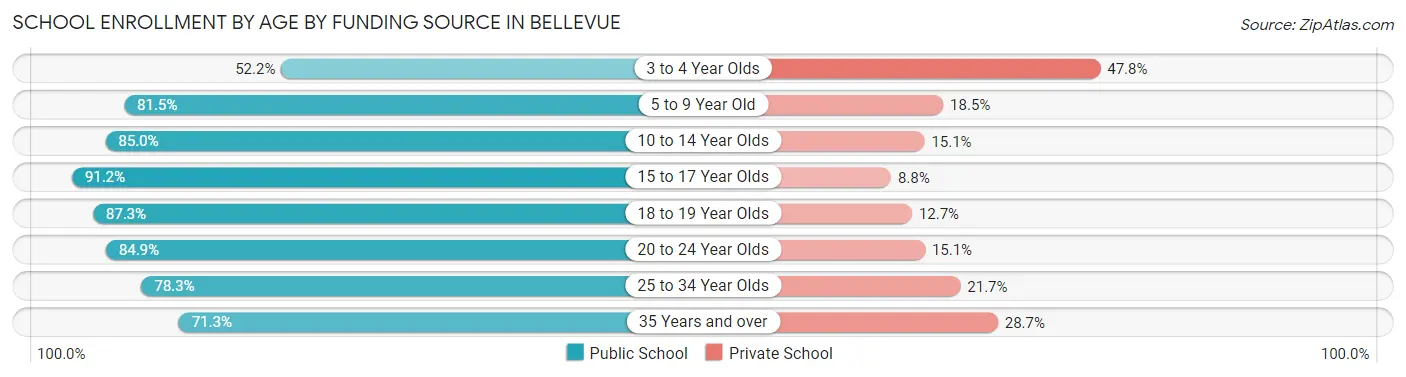
School Enrollment by Age by Funding Source in Bellevue
Out of a total of 16,433 students who are enrolled in schools in Bellevue, 2,892 (17.6%) attend a private institution, while the remaining 13,541 (82.4%) are enrolled in public schools. The age group of 3 to 4 year olds has the highest likelihood of being enrolled in private schools, with 304 (47.8% in the age bracket) enrolled. Conversely, the age group of 15 to 17 year olds has the lowest likelihood of being enrolled in a private school, with 1,998 (91.2% in the age bracket) attending a public institution.
| Age Bracket | Public School | Private School |
| 3 to 4 Year Olds | 332 (52.2%) | 304 (47.8%) |
| 5 to 9 Year Old | 3,513 (81.5%) | 799 (18.5%) |
| 10 to 14 Year Olds | 3,845 (85.0%) | 681 (15.0%) |
| 15 to 17 Year Olds | 1,998 (91.2%) | 193 (8.8%) |
| 18 to 19 Year Olds | 796 (87.3%) | 116 (12.7%) |
| 20 to 24 Year Olds | 1,334 (84.9%) | 238 (15.1%) |
| 25 to 34 Year Olds | 997 (78.3%) | 277 (21.7%) |
| 35 Years and over | 720 (71.3%) | 290 (28.7%) |
| Total | 13,541 (82.4%) | 2,892 (17.6%) |
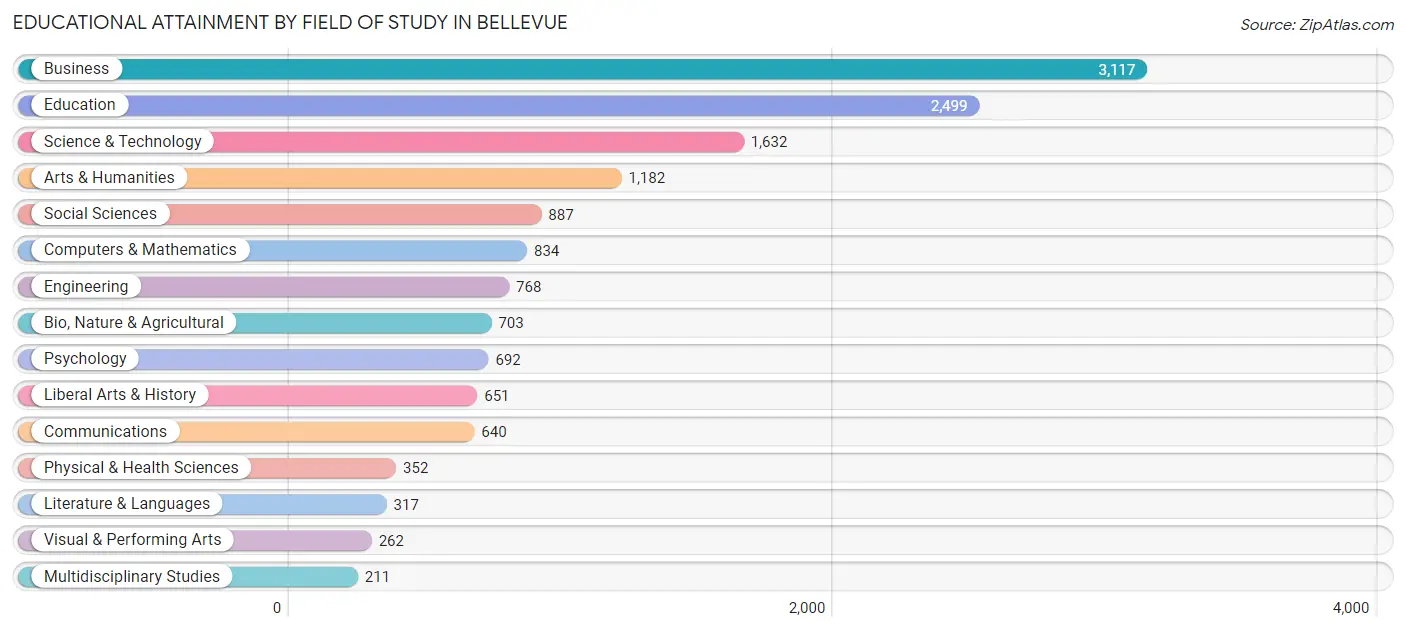
Educational Attainment by Field of Study in Bellevue
Business (3,117 | 21.1%), education (2,499 | 17.0%), science & technology (1,632 | 11.1%), arts & humanities (1,182 | 8.0%), and social sciences (887 | 6.0%) are the most common fields of study among 14,747 individuals in Bellevue who have obtained a bachelor's degree or higher.
| Field of Study | # Graduates | % Graduates |
| Computers & Mathematics | 834 | 5.7% |
| Bio, Nature & Agricultural | 703 | 4.8% |
| Physical & Health Sciences | 352 | 2.4% |
| Psychology | 692 | 4.7% |
| Social Sciences | 887 | 6.0% |
| Engineering | 768 | 5.2% |
| Multidisciplinary Studies | 211 | 1.4% |
| Science & Technology | 1,632 | 11.1% |
| Business | 3,117 | 21.1% |
| Education | 2,499 | 17.0% |
| Literature & Languages | 317 | 2.1% |
| Liberal Arts & History | 651 | 4.4% |
| Visual & Performing Arts | 262 | 1.8% |
| Communications | 640 | 4.3% |
| Arts & Humanities | 1,182 | 8.0% |
| Total | 14,747 | 100.0% |
Transportation & Commute in Bellevue
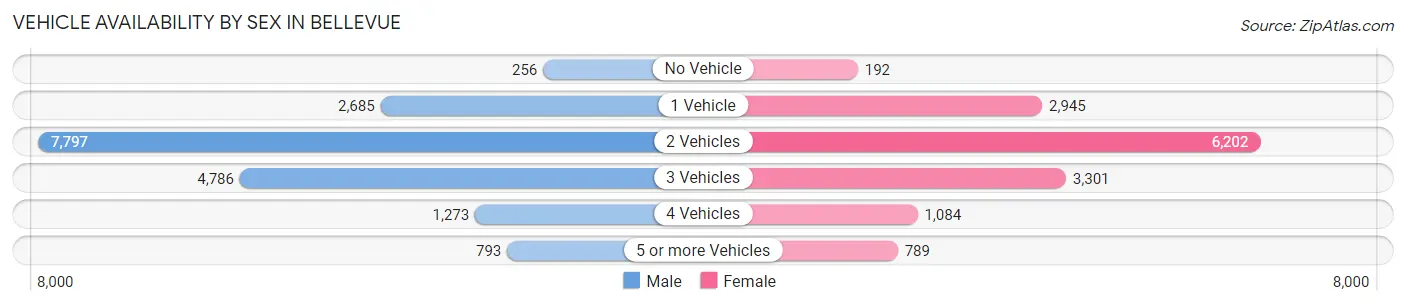
Vehicle Availability by Sex in Bellevue
The most prevalent vehicle ownership categories in Bellevue are males with 2 vehicles (7,797, accounting for 44.3%) and females with 2 vehicles (6,202, making up 53.7%).
| Vehicles Available | Male | Female |
| No Vehicle | 256 (1.5%) | 192 (1.3%) |
| 1 Vehicle | 2,685 (15.3%) | 2,945 (20.3%) |
| 2 Vehicles | 7,797 (44.3%) | 6,202 (42.7%) |
| 3 Vehicles | 4,786 (27.2%) | 3,301 (22.8%) |
| 4 Vehicles | 1,273 (7.2%) | 1,084 (7.5%) |
| 5 or more Vehicles | 793 (4.5%) | 789 (5.4%) |
| Total | 17,590 (100.0%) | 14,513 (100.0%) |
Commute Time in Bellevue
The most frequently occuring commute durations in Bellevue are 20 to 24 minutes (6,421 commuters, 21.7%), 15 to 19 minutes (5,879 commuters, 19.9%), and 10 to 14 minutes (5,171 commuters, 17.5%).
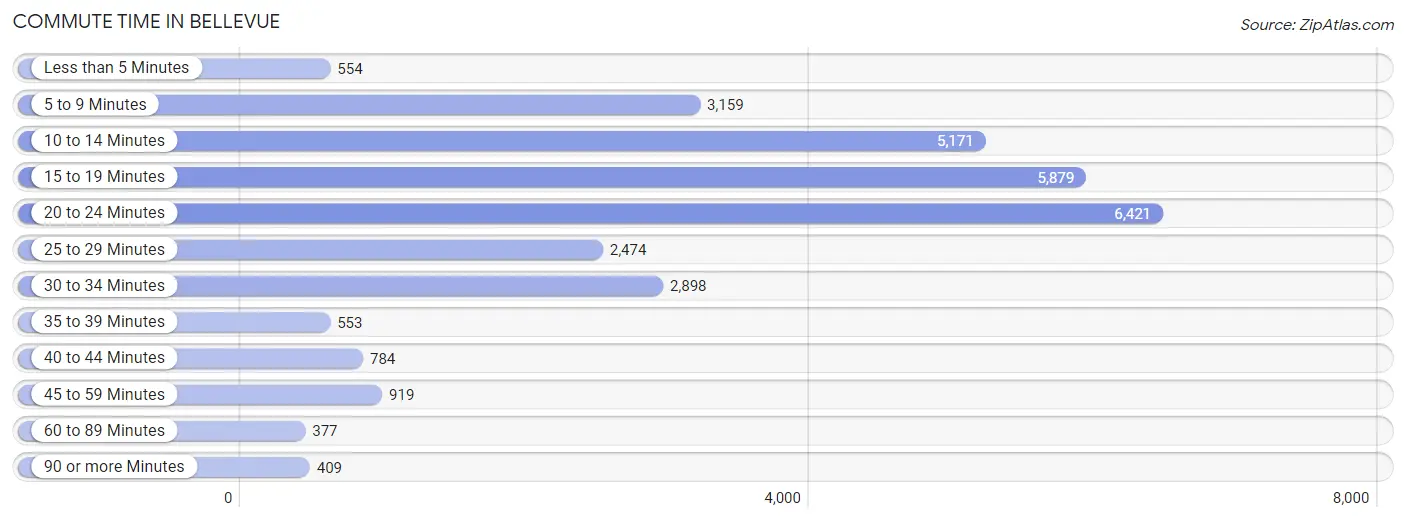
| Commute Time | # Commuters | % Commuters |
| Less than 5 Minutes | 554 | 1.9% |
| 5 to 9 Minutes | 3,159 | 10.7% |
| 10 to 14 Minutes | 5,171 | 17.5% |
| 15 to 19 Minutes | 5,879 | 19.9% |
| 20 to 24 Minutes | 6,421 | 21.7% |
| 25 to 29 Minutes | 2,474 | 8.4% |
| 30 to 34 Minutes | 2,898 | 9.8% |
| 35 to 39 Minutes | 553 | 1.9% |
| 40 to 44 Minutes | 784 | 2.6% |
| 45 to 59 Minutes | 919 | 3.1% |
| 60 to 89 Minutes | 377 | 1.3% |
| 90 or more Minutes | 409 | 1.4% |
Commute Time by Sex in Bellevue
The most common commute times in Bellevue are 15 to 19 minutes (3,520 commuters, 21.5%) for males and 20 to 24 minutes (3,066 commuters, 23.2%) for females.
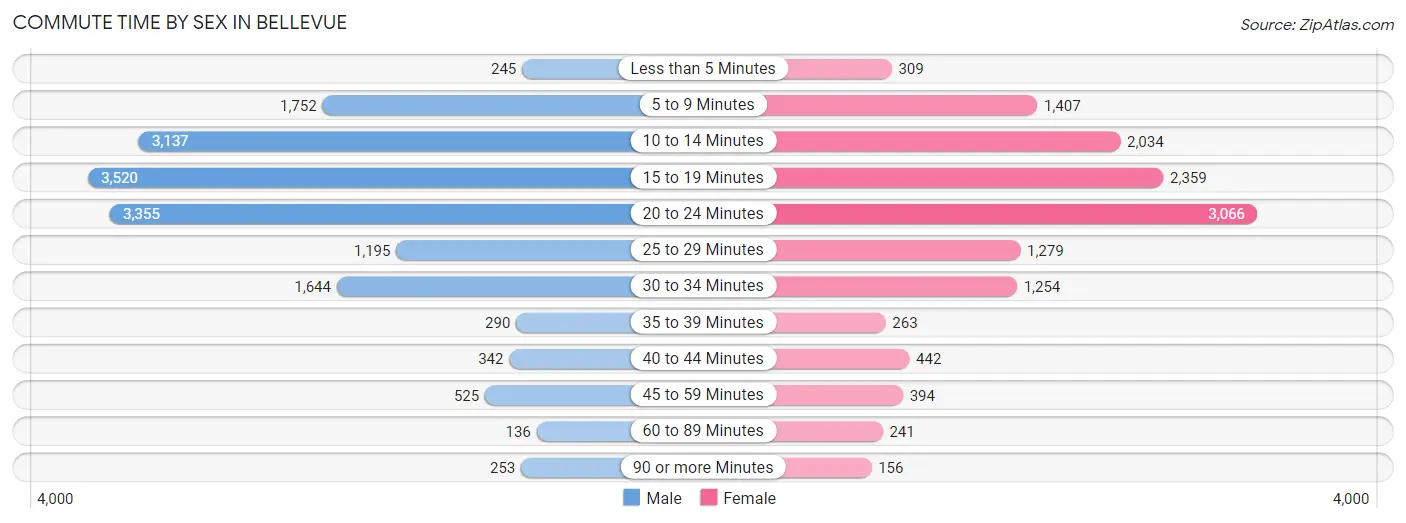
| Commute Time | Male | Female |
| Less than 5 Minutes | 245 (1.5%) | 309 (2.3%) |
| 5 to 9 Minutes | 1,752 (10.7%) | 1,407 (10.7%) |
| 10 to 14 Minutes | 3,137 (19.1%) | 2,034 (15.4%) |
| 15 to 19 Minutes | 3,520 (21.5%) | 2,359 (17.9%) |
| 20 to 24 Minutes | 3,355 (20.5%) | 3,066 (23.2%) |
| 25 to 29 Minutes | 1,195 (7.3%) | 1,279 (9.7%) |
| 30 to 34 Minutes | 1,644 (10.0%) | 1,254 (9.5%) |
| 35 to 39 Minutes | 290 (1.8%) | 263 (2.0%) |
| 40 to 44 Minutes | 342 (2.1%) | 442 (3.4%) |
| 45 to 59 Minutes | 525 (3.2%) | 394 (3.0%) |
| 60 to 89 Minutes | 136 (0.8%) | 241 (1.8%) |
| 90 or more Minutes | 253 (1.5%) | 156 (1.2%) |
Time of Departure to Work by Sex in Bellevue
The most frequent times of departure to work in Bellevue are 7:00 AM to 7:29 AM (2,457, 15.0%) for males and 7:00 AM to 7:29 AM (2,790, 21.1%) for females.
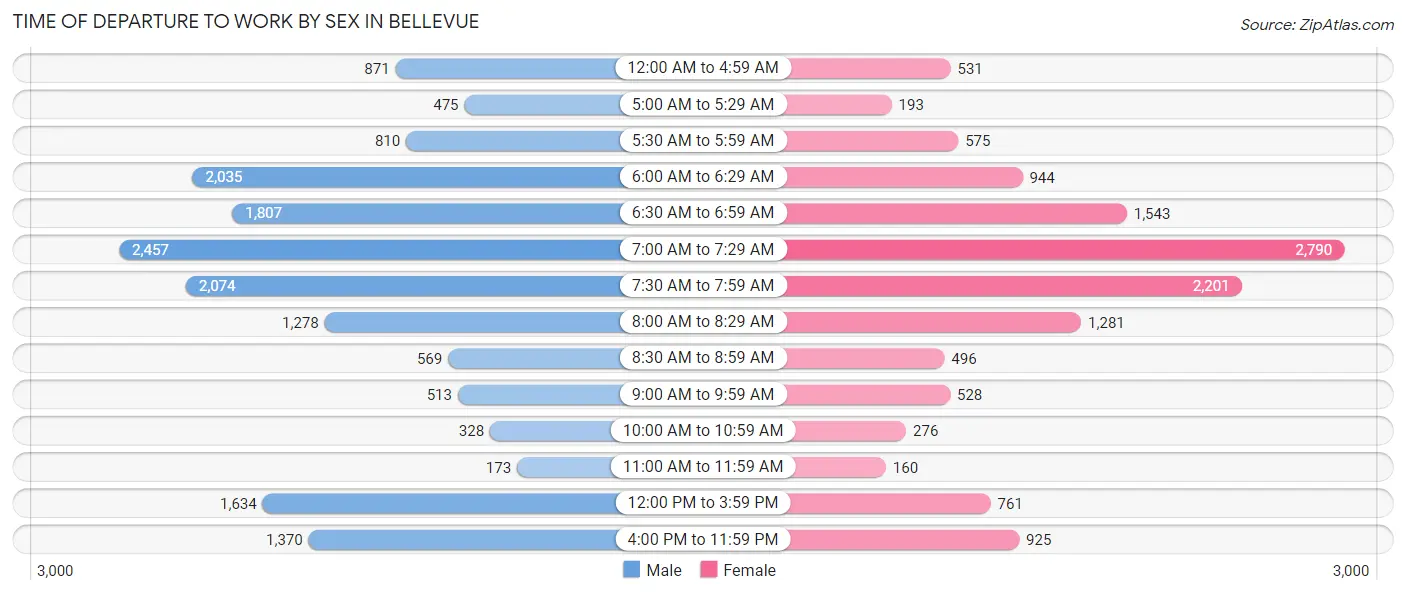
| Time of Departure | Male | Female |
| 12:00 AM to 4:59 AM | 871 (5.3%) | 531 (4.0%) |
| 5:00 AM to 5:29 AM | 475 (2.9%) | 193 (1.5%) |
| 5:30 AM to 5:59 AM | 810 (4.9%) | 575 (4.3%) |
| 6:00 AM to 6:29 AM | 2,035 (12.4%) | 944 (7.1%) |
| 6:30 AM to 6:59 AM | 1,807 (11.0%) | 1,543 (11.7%) |
| 7:00 AM to 7:29 AM | 2,457 (15.0%) | 2,790 (21.1%) |
| 7:30 AM to 7:59 AM | 2,074 (12.7%) | 2,201 (16.7%) |
| 8:00 AM to 8:29 AM | 1,278 (7.8%) | 1,281 (9.7%) |
| 8:30 AM to 8:59 AM | 569 (3.5%) | 496 (3.8%) |
| 9:00 AM to 9:59 AM | 513 (3.1%) | 528 (4.0%) |
| 10:00 AM to 10:59 AM | 328 (2.0%) | 276 (2.1%) |
| 11:00 AM to 11:59 AM | 173 (1.1%) | 160 (1.2%) |
| 12:00 PM to 3:59 PM | 1,634 (10.0%) | 761 (5.8%) |
| 4:00 PM to 11:59 PM | 1,370 (8.4%) | 925 (7.0%) |
| Total | 16,394 (100.0%) | 13,204 (100.0%) |
Housing Occupancy in Bellevue
Occupancy by Ownership in Bellevue
Of the total 24,442 dwellings in Bellevue, owner-occupied units account for 15,492 (63.4%), while renter-occupied units make up 8,950 (36.6%).
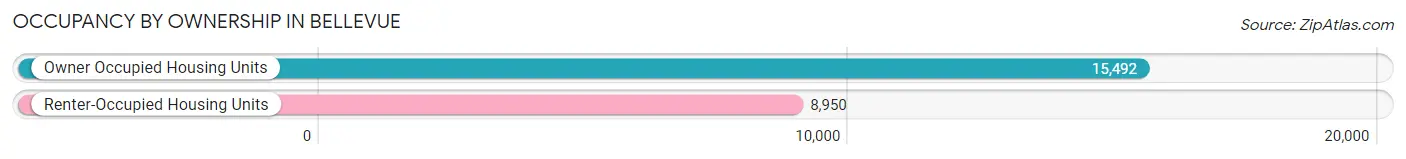
| Occupancy | # Housing Units | % Housing Units |
| Owner Occupied Housing Units | 15,492 | 63.4% |
| Renter-Occupied Housing Units | 8,950 | 36.6% |
| Total Occupied Housing Units | 24,442 | 100.0% |
Occupancy by Household Size in Bellevue
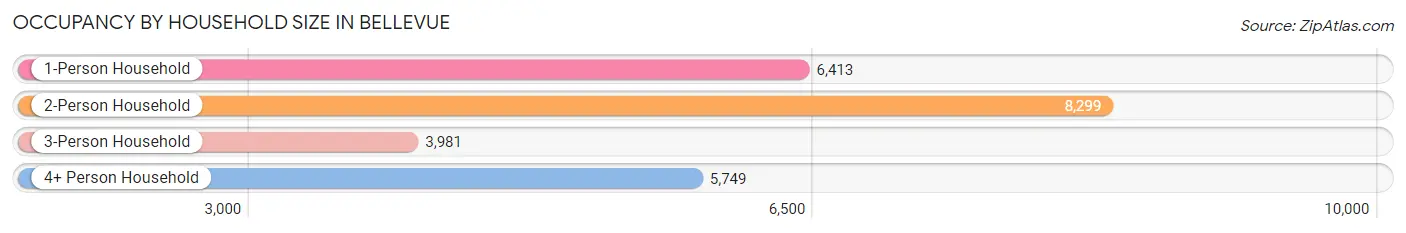
| Household Size | # Housing Units | % Housing Units |
| 1-Person Household | 6,413 | 26.2% |
| 2-Person Household | 8,299 | 34.0% |
| 3-Person Household | 3,981 | 16.3% |
| 4+ Person Household | 5,749 | 23.5% |
| Total Housing Units | 24,442 | 100.0% |
Occupancy by Ownership by Household Size in Bellevue
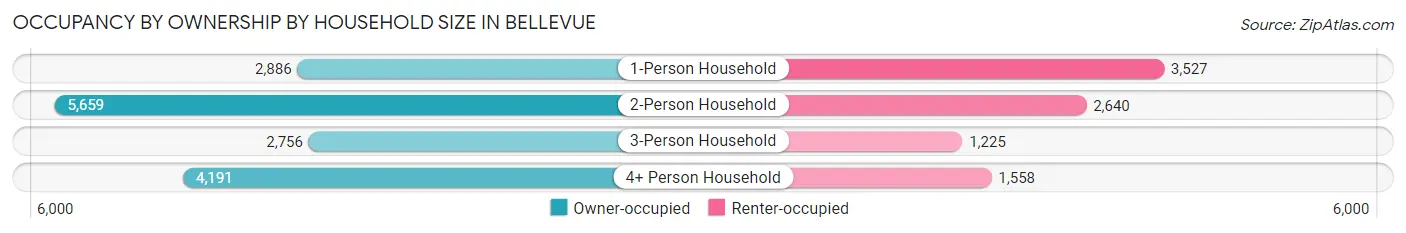
| Household Size | Owner-occupied | Renter-occupied |
| 1-Person Household | 2,886 (45.0%) | 3,527 (55.0%) |
| 2-Person Household | 5,659 (68.2%) | 2,640 (31.8%) |
| 3-Person Household | 2,756 (69.2%) | 1,225 (30.8%) |
| 4+ Person Household | 4,191 (72.9%) | 1,558 (27.1%) |
| Total Housing Units | 15,492 (63.4%) | 8,950 (36.6%) |
Occupancy by Educational Attainment in Bellevue
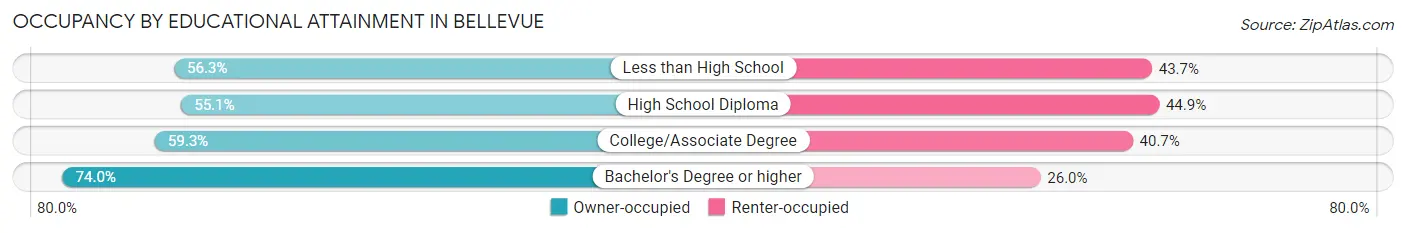
| Household Size | Owner-occupied | Renter-occupied |
| Less than High School | 739 (56.3%) | 574 (43.7%) |
| High School Diploma | 2,914 (55.1%) | 2,371 (44.9%) |
| College/Associate Degree | 5,506 (59.3%) | 3,775 (40.7%) |
| Bachelor's Degree or higher | 6,333 (74.0%) | 2,230 (26.0%) |
Occupancy by Age of Householder in Bellevue
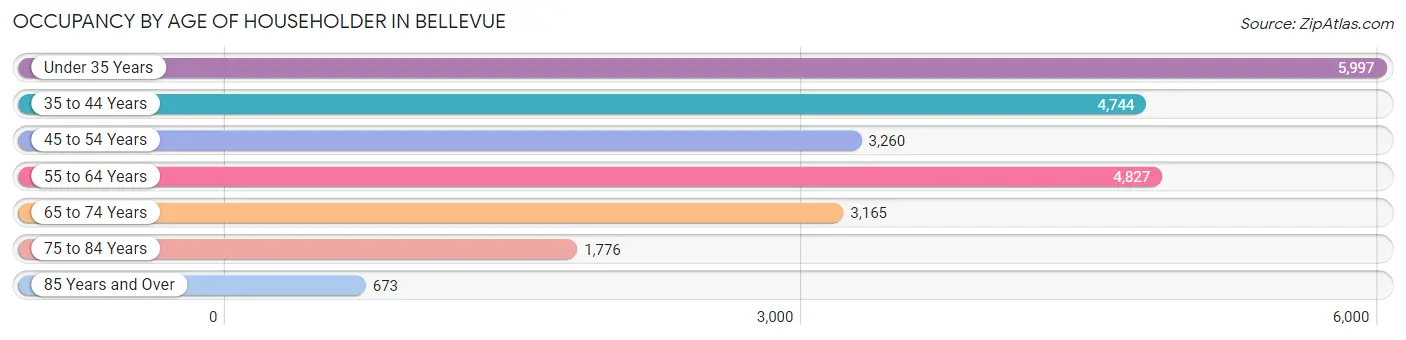
| Age Bracket | # Households | % Households |
| Under 35 Years | 5,997 | 24.5% |
| 35 to 44 Years | 4,744 | 19.4% |
| 45 to 54 Years | 3,260 | 13.3% |
| 55 to 64 Years | 4,827 | 19.8% |
| 65 to 74 Years | 3,165 | 13.0% |
| 75 to 84 Years | 1,776 | 7.3% |
| 85 Years and Over | 673 | 2.8% |
| Total | 24,442 | 100.0% |
Housing Finances in Bellevue
Median Income by Occupancy in Bellevue
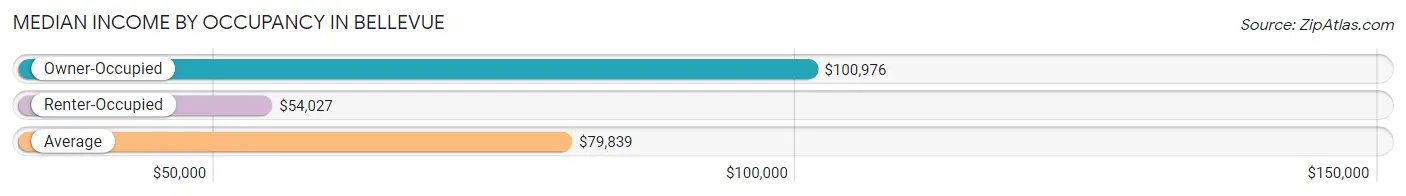
| Occupancy Type | # Households | Median Income |
| Owner-Occupied | 15,492 (63.4%) | $100,976 |
| Renter-Occupied | 8,950 (36.6%) | $54,027 |
| Average | 24,442 (100.0%) | $79,839 |
Occupancy by Householder Income Bracket in Bellevue
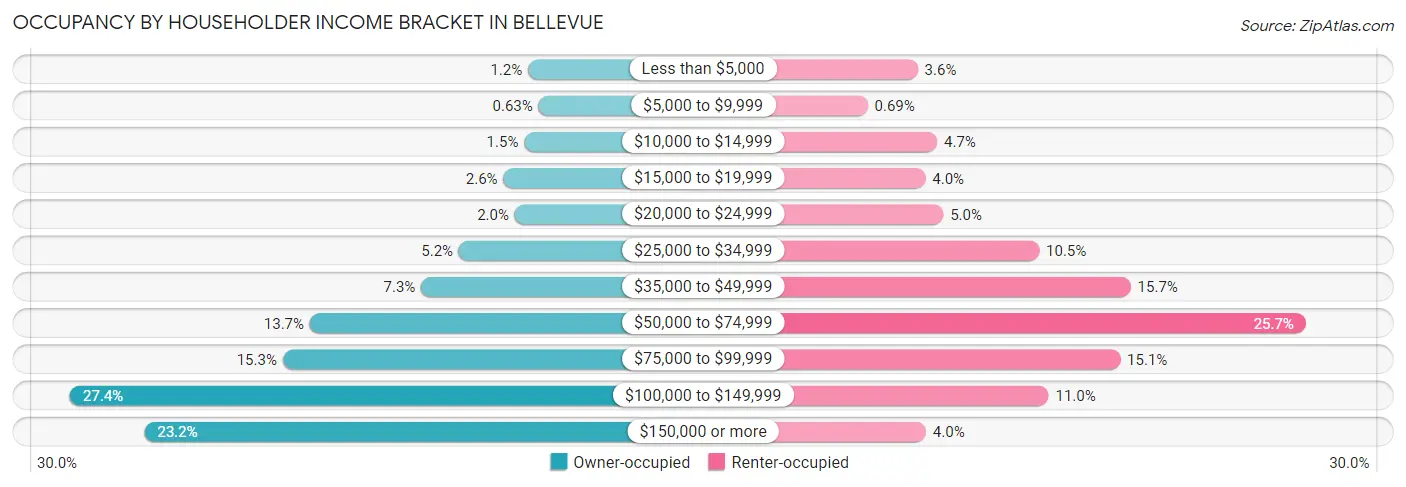
| Income Bracket | Owner-occupied | Renter-occupied |
| Less than $5,000 | 191 (1.2%) | 318 (3.5%) |
| $5,000 to $9,999 | 98 (0.6%) | 62 (0.7%) |
| $10,000 to $14,999 | 225 (1.5%) | 417 (4.7%) |
| $15,000 to $19,999 | 409 (2.6%) | 357 (4.0%) |
| $20,000 to $24,999 | 309 (2.0%) | 448 (5.0%) |
| $25,000 to $34,999 | 802 (5.2%) | 939 (10.5%) |
| $35,000 to $49,999 | 1,137 (7.3%) | 1,407 (15.7%) |
| $50,000 to $74,999 | 2,123 (13.7%) | 2,302 (25.7%) |
| $75,000 to $99,999 | 2,363 (15.2%) | 1,353 (15.1%) |
| $100,000 to $149,999 | 4,247 (27.4%) | 987 (11.0%) |
| $150,000 or more | 3,588 (23.2%) | 360 (4.0%) |
| Total | 15,492 (100.0%) | 8,950 (100.0%) |
Monthly Housing Cost Tiers in Bellevue
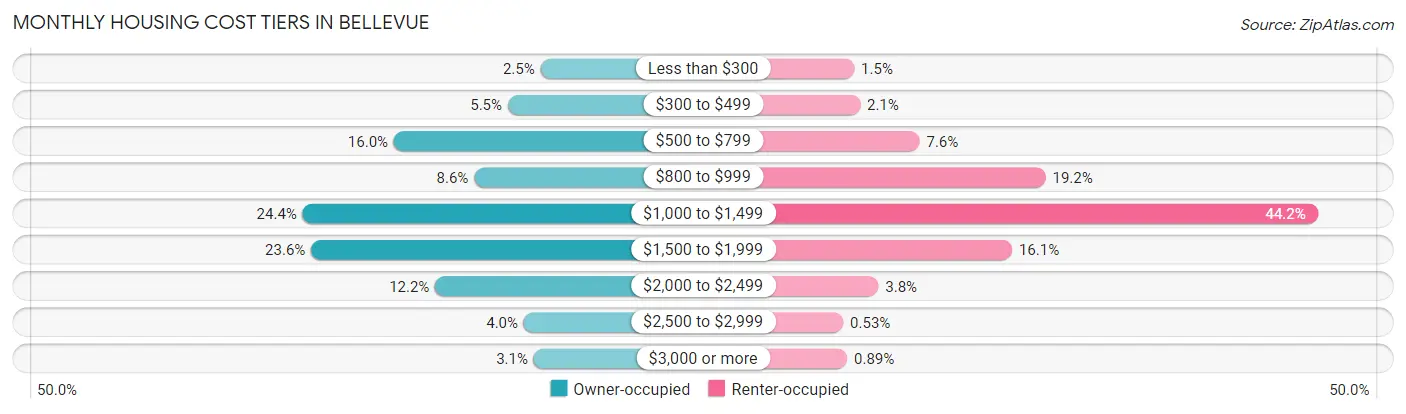
| Monthly Cost | Owner-occupied | Renter-occupied |
| Less than $300 | 387 (2.5%) | 138 (1.5%) |
| $300 to $499 | 854 (5.5%) | 186 (2.1%) |
| $500 to $799 | 2,479 (16.0%) | 677 (7.6%) |
| $800 to $999 | 1,334 (8.6%) | 1,715 (19.2%) |
| $1,000 to $1,499 | 3,780 (24.4%) | 3,956 (44.2%) |
| $1,500 to $1,999 | 3,659 (23.6%) | 1,438 (16.1%) |
| $2,000 to $2,499 | 1,890 (12.2%) | 337 (3.8%) |
| $2,500 to $2,999 | 626 (4.0%) | 47 (0.5%) |
| $3,000 or more | 483 (3.1%) | 80 (0.9%) |
| Total | 15,492 (100.0%) | 8,950 (100.0%) |
Physical Housing Characteristics in Bellevue
Housing Structures in Bellevue
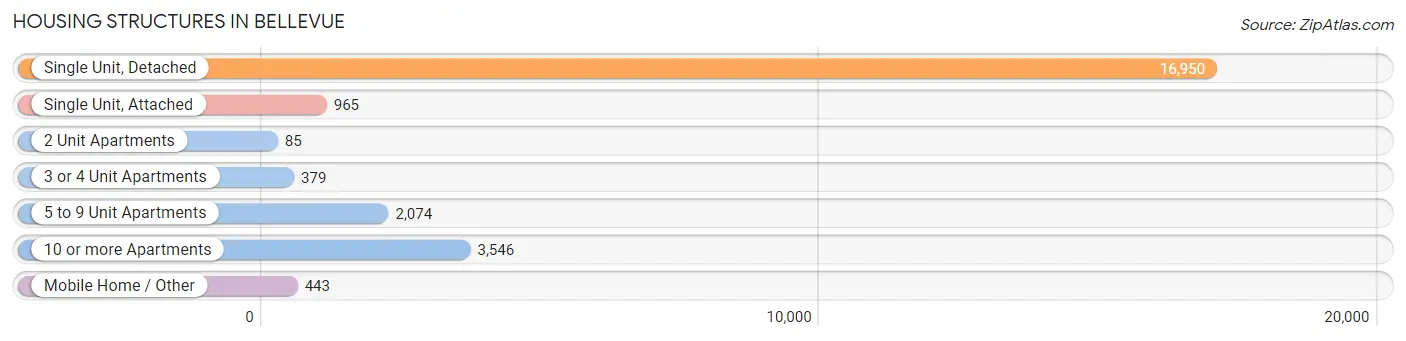
| Structure Type | # Housing Units | % Housing Units |
| Single Unit, Detached | 16,950 | 69.4% |
| Single Unit, Attached | 965 | 4.0% |
| 2 Unit Apartments | 85 | 0.4% |
| 3 or 4 Unit Apartments | 379 | 1.5% |
| 5 to 9 Unit Apartments | 2,074 | 8.5% |
| 10 or more Apartments | 3,546 | 14.5% |
| Mobile Home / Other | 443 | 1.8% |
| Total | 24,442 | 100.0% |
Housing Structures by Occupancy in Bellevue
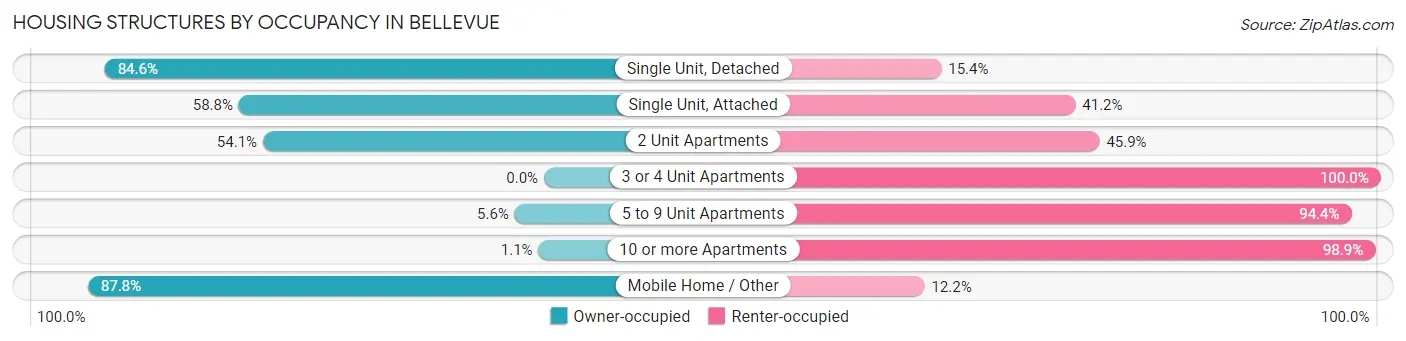
| Structure Type | Owner-occupied | Renter-occupied |
| Single Unit, Detached | 14,335 (84.6%) | 2,615 (15.4%) |
| Single Unit, Attached | 567 (58.8%) | 398 (41.2%) |
| 2 Unit Apartments | 46 (54.1%) | 39 (45.9%) |
| 3 or 4 Unit Apartments | 0 (0.0%) | 379 (100.0%) |
| 5 to 9 Unit Apartments | 117 (5.6%) | 1,957 (94.4%) |
| 10 or more Apartments | 38 (1.1%) | 3,508 (98.9%) |
| Mobile Home / Other | 389 (87.8%) | 54 (12.2%) |
| Total | 15,492 (63.4%) | 8,950 (36.6%) |
Housing Structures by Number of Rooms in Bellevue
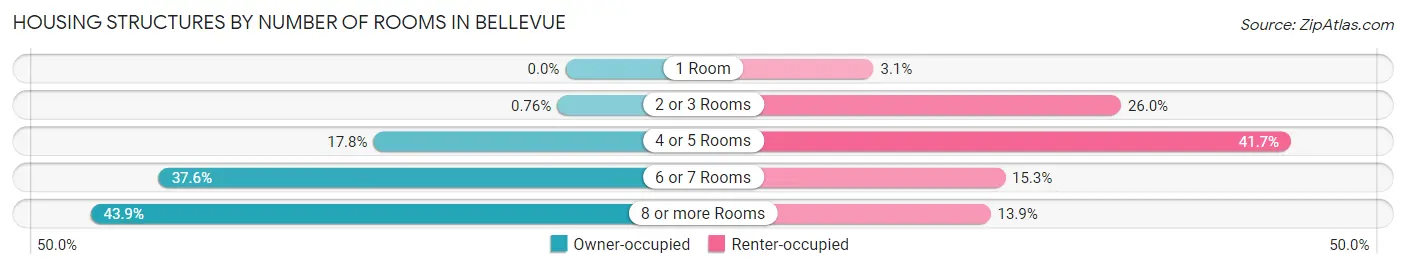
| Number of Rooms | Owner-occupied | Renter-occupied |
| 1 Room | 0 (0.0%) | 278 (3.1%) |
| 2 or 3 Rooms | 118 (0.8%) | 2,326 (26.0%) |
| 4 or 5 Rooms | 2,750 (17.7%) | 3,732 (41.7%) |
| 6 or 7 Rooms | 5,824 (37.6%) | 1,367 (15.3%) |
| 8 or more Rooms | 6,800 (43.9%) | 1,247 (13.9%) |
| Total | 15,492 (100.0%) | 8,950 (100.0%) |
Housing Structure by Heating Type in Bellevue
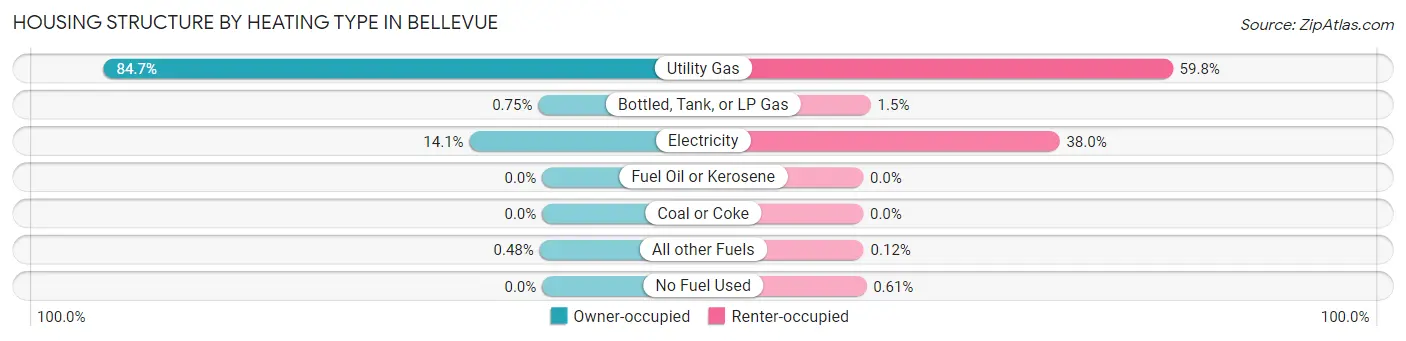
| Heating Type | Owner-occupied | Renter-occupied |
| Utility Gas | 13,126 (84.7%) | 5,355 (59.8%) |
| Bottled, Tank, or LP Gas | 116 (0.7%) | 132 (1.5%) |
| Electricity | 2,176 (14.1%) | 3,397 (38.0%) |
| Fuel Oil or Kerosene | 0 (0.0%) | 0 (0.0%) |
| Coal or Coke | 0 (0.0%) | 0 (0.0%) |
| All other Fuels | 74 (0.5%) | 11 (0.1%) |
| No Fuel Used | 0 (0.0%) | 55 (0.6%) |
| Total | 15,492 (100.0%) | 8,950 (100.0%) |
Household Vehicle Usage in Bellevue
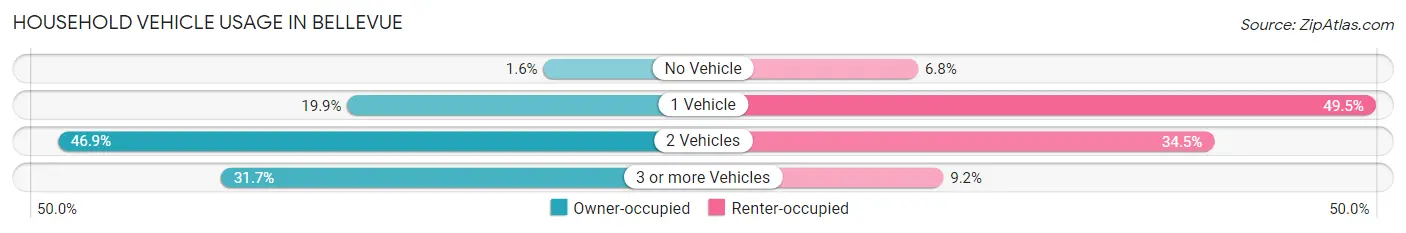
| Vehicles per Household | Owner-occupied | Renter-occupied |
| No Vehicle | 243 (1.6%) | 610 (6.8%) |
| 1 Vehicle | 3,078 (19.9%) | 4,434 (49.5%) |
| 2 Vehicles | 7,264 (46.9%) | 3,084 (34.5%) |
| 3 or more Vehicles | 4,907 (31.7%) | 822 (9.2%) |
| Total | 15,492 (100.0%) | 8,950 (100.0%) |
Real Estate & Mortgages in Bellevue
Real Estate and Mortgage Overview in Bellevue
| Characteristic | Without Mortgage | With Mortgage |
| Housing Units | 5,057 | 10,435 |
| Median Property Value | $197,900 | $217,800 |
| Median Household Income | $67,726 | $2,709 |
| Monthly Housing Costs | $687 | $483 |
| Real Estate Taxes | $3,631 | $346 |
Property Value by Mortgage Status in Bellevue
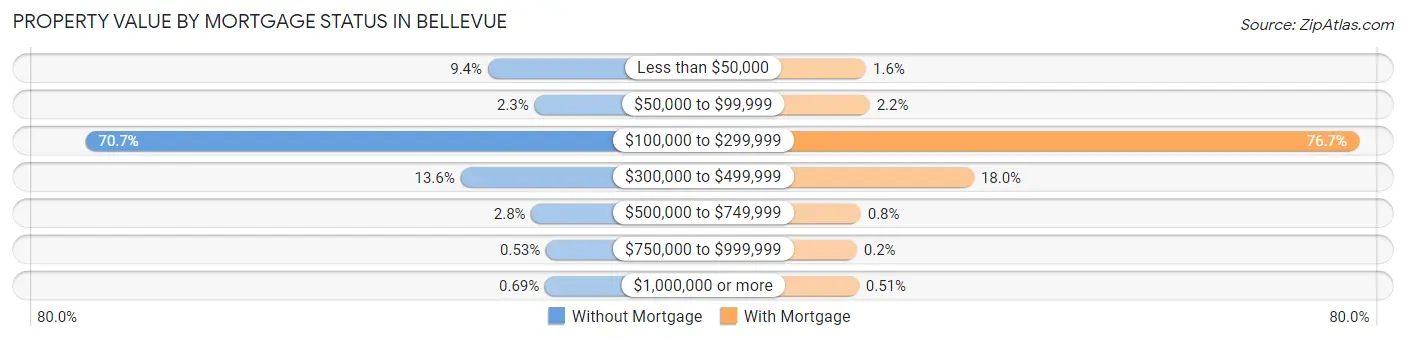
| Property Value | Without Mortgage | With Mortgage |
| Less than $50,000 | 476 (9.4%) | 168 (1.6%) |
| $50,000 to $99,999 | 116 (2.3%) | 225 (2.2%) |
| $100,000 to $299,999 | 3,577 (70.7%) | 8,003 (76.7%) |
| $300,000 to $499,999 | 686 (13.6%) | 1,882 (18.0%) |
| $500,000 to $749,999 | 140 (2.8%) | 83 (0.8%) |
| $750,000 to $999,999 | 27 (0.5%) | 21 (0.2%) |
| $1,000,000 or more | 35 (0.7%) | 53 (0.5%) |
| Total | 5,057 (100.0%) | 10,435 (100.0%) |
Household Income by Mortgage Status in Bellevue
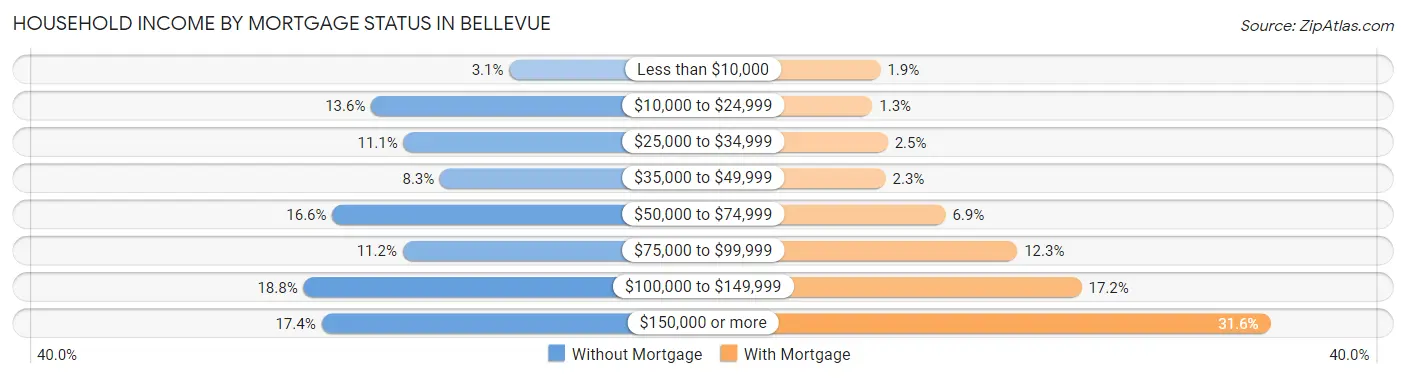
| Household Income | Without Mortgage | With Mortgage |
| Less than $10,000 | 155 (3.1%) | 198 (1.9%) |
| $10,000 to $24,999 | 687 (13.6%) | 134 (1.3%) |
| $25,000 to $34,999 | 563 (11.1%) | 256 (2.5%) |
| $35,000 to $49,999 | 422 (8.3%) | 239 (2.3%) |
| $50,000 to $74,999 | 837 (16.6%) | 715 (6.9%) |
| $75,000 to $99,999 | 566 (11.2%) | 1,286 (12.3%) |
| $100,000 to $149,999 | 948 (18.8%) | 1,797 (17.2%) |
| $150,000 or more | 879 (17.4%) | 3,299 (31.6%) |
| Total | 5,057 (100.0%) | 10,435 (100.0%) |
Property Value to Household Income Ratio in Bellevue
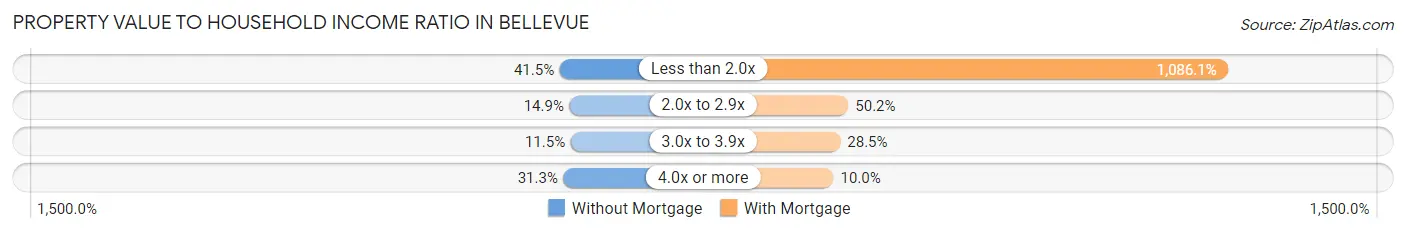
| Value-to-Income Ratio | Without Mortgage | With Mortgage |
| Less than 2.0x | 2,100 (41.5%) | 113,338 (1,086.1%) |
| 2.0x to 2.9x | 755 (14.9%) | 5,238 (50.2%) |
| 3.0x to 3.9x | 582 (11.5%) | 2,972 (28.5%) |
| 4.0x or more | 1,582 (31.3%) | 1,044 (10.0%) |
| Total | 5,057 (100.0%) | 10,435 (100.0%) |
Real Estate Taxes by Mortgage Status in Bellevue
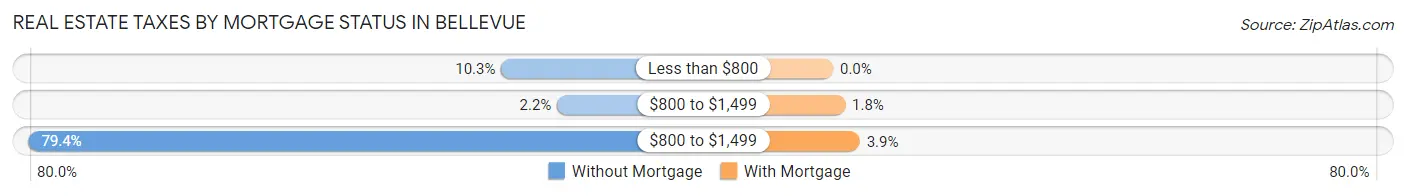
| Property Taxes | Without Mortgage | With Mortgage |
| Less than $800 | 523 (10.3%) | 0 (0.0%) |
| $800 to $1,499 | 110 (2.2%) | 184 (1.8%) |
| $800 to $1,499 | 4,017 (79.4%) | 407 (3.9%) |
| Total | 5,057 (100.0%) | 10,435 (100.0%) |
Health & Disability in Bellevue
Health Insurance Coverage by Age in Bellevue
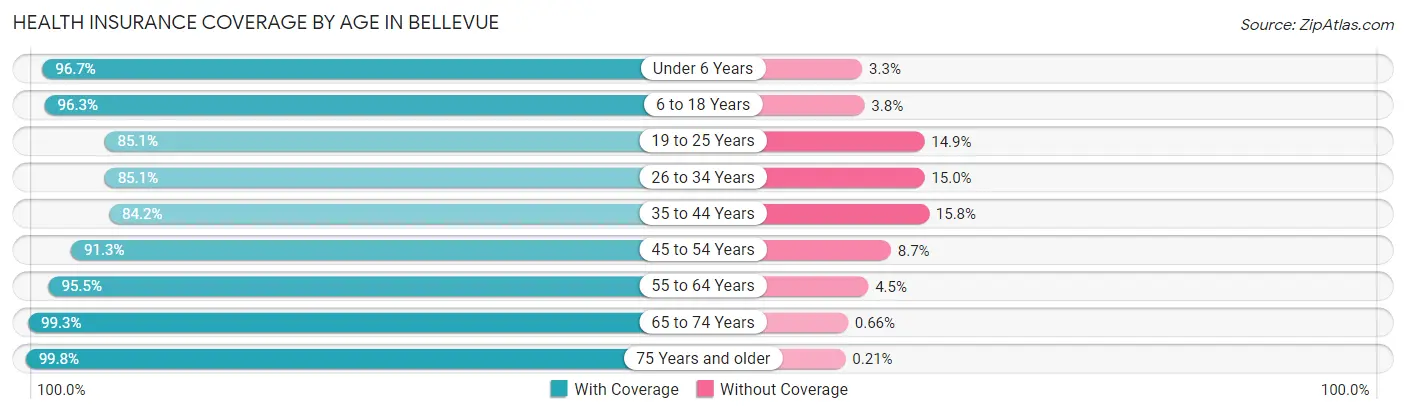
| Age Bracket | With Coverage | Without Coverage |
| Under 6 Years | 4,729 (96.7%) | 163 (3.3%) |
| 6 to 18 Years | 10,988 (96.3%) | 428 (3.7%) |
| 19 to 25 Years | 5,251 (85.1%) | 921 (14.9%) |
| 26 to 34 Years | 6,451 (85.1%) | 1,134 (14.9%) |
| 35 to 44 Years | 7,257 (84.2%) | 1,359 (15.8%) |
| 45 to 54 Years | 5,552 (91.3%) | 528 (8.7%) |
| 55 to 64 Years | 7,584 (95.5%) | 354 (4.5%) |
| 65 to 74 Years | 5,098 (99.3%) | 34 (0.7%) |
| 75 Years and older | 3,755 (99.8%) | 8 (0.2%) |
| Total | 56,665 (92.0%) | 4,929 (8.0%) |
Health Insurance Coverage by Citizenship Status in Bellevue
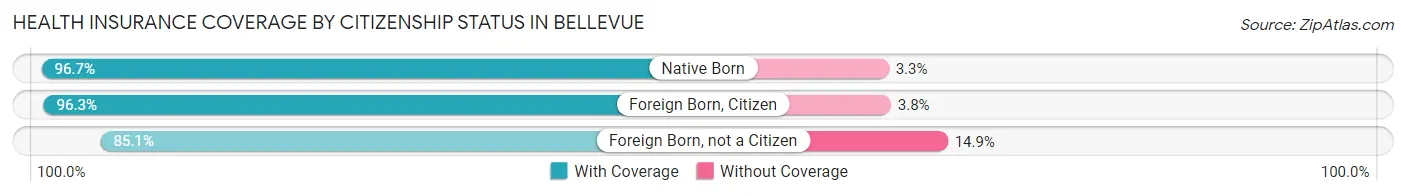
| Citizenship Status | With Coverage | Without Coverage |
| Native Born | 4,729 (96.7%) | 163 (3.3%) |
| Foreign Born, Citizen | 10,988 (96.3%) | 428 (3.7%) |
| Foreign Born, not a Citizen | 5,251 (85.1%) | 921 (14.9%) |
Health Insurance Coverage by Household Income in Bellevue
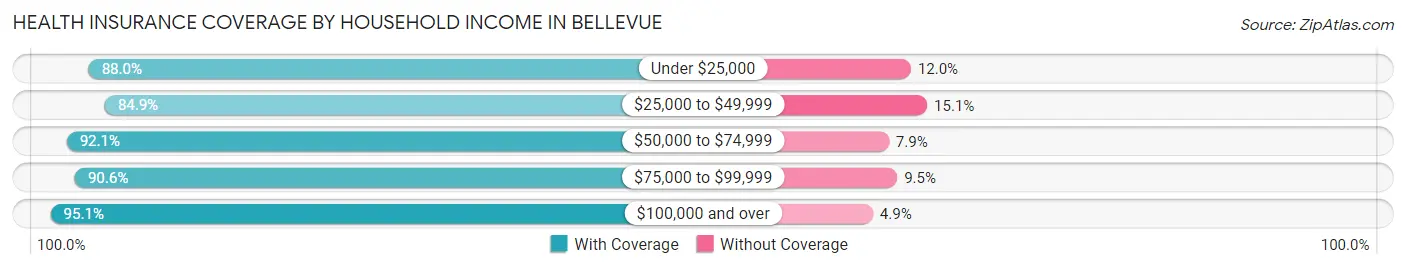
| Household Income | With Coverage | Without Coverage |
| Under $25,000 | 4,027 (88.0%) | 550 (12.0%) |
| $25,000 to $49,999 | 7,025 (84.9%) | 1,246 (15.1%) |
| $50,000 to $74,999 | 9,042 (92.1%) | 774 (7.9%) |
| $75,000 to $99,999 | 9,002 (90.5%) | 940 (9.5%) |
| $100,000 and over | 27,478 (95.1%) | 1,413 (4.9%) |
Public vs Private Health Insurance Coverage by Age in Bellevue
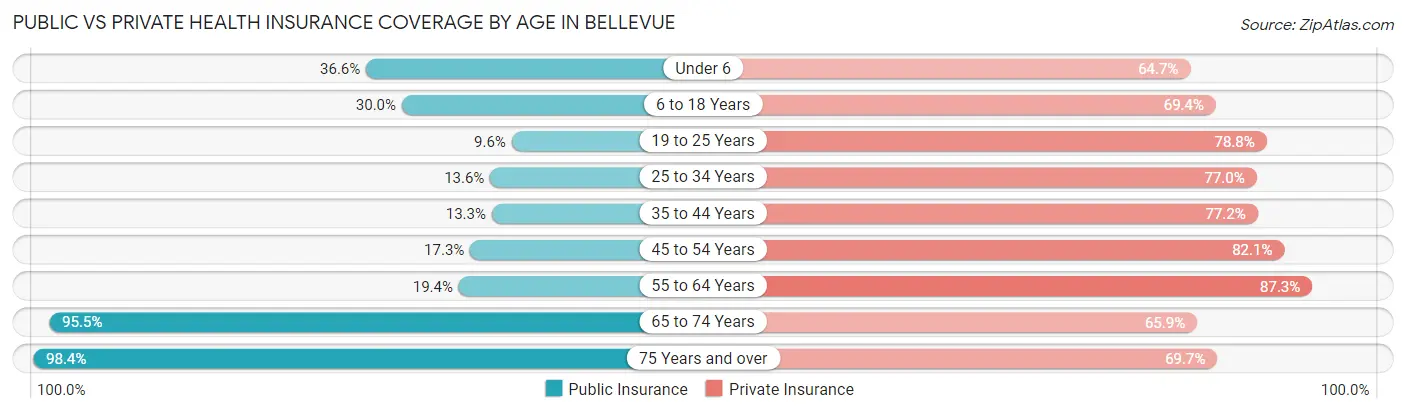
| Age Bracket | Public Insurance | Private Insurance |
| Under 6 | 1,791 (36.6%) | 3,163 (64.7%) |
| 6 to 18 Years | 3,423 (30.0%) | 7,924 (69.4%) |
| 19 to 25 Years | 592 (9.6%) | 4,866 (78.8%) |
| 25 to 34 Years | 1,030 (13.6%) | 5,838 (77.0%) |
| 35 to 44 Years | 1,144 (13.3%) | 6,648 (77.2%) |
| 45 to 54 Years | 1,052 (17.3%) | 4,993 (82.1%) |
| 55 to 64 Years | 1,541 (19.4%) | 6,929 (87.3%) |
| 65 to 74 Years | 4,899 (95.5%) | 3,383 (65.9%) |
| 75 Years and over | 3,703 (98.4%) | 2,622 (69.7%) |
| Total | 19,175 (31.1%) | 46,366 (75.3%) |
Disability Status by Sex by Age in Bellevue
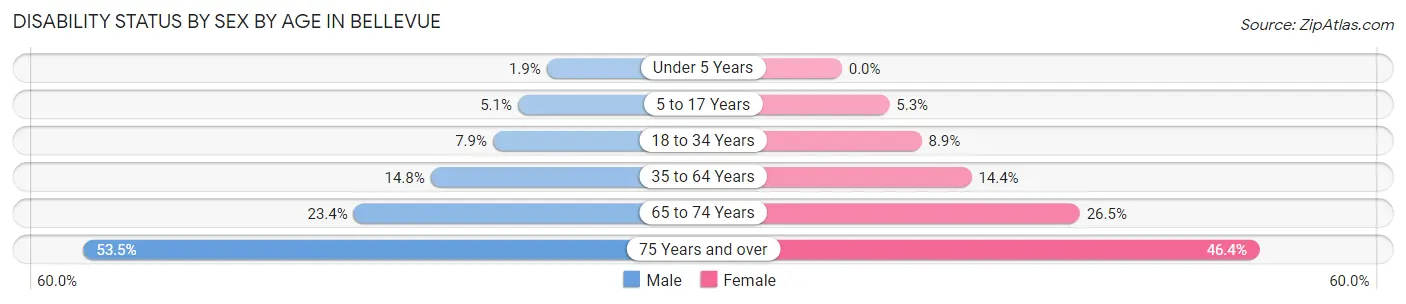
| Age Bracket | Male | Female |
| Under 5 Years | 44 (1.9%) | 0 (0.0%) |
| 5 to 17 Years | 305 (5.1%) | 287 (5.3%) |
| 18 to 34 Years | 594 (7.9%) | 622 (8.9%) |
| 35 to 64 Years | 1,703 (14.8%) | 1,606 (14.4%) |
| 65 to 74 Years | 582 (23.4%) | 700 (26.5%) |
| 75 Years and over | 835 (53.5%) | 1,022 (46.4%) |
Disability Class by Sex by Age in Bellevue
Disability Class: Hearing Difficulty
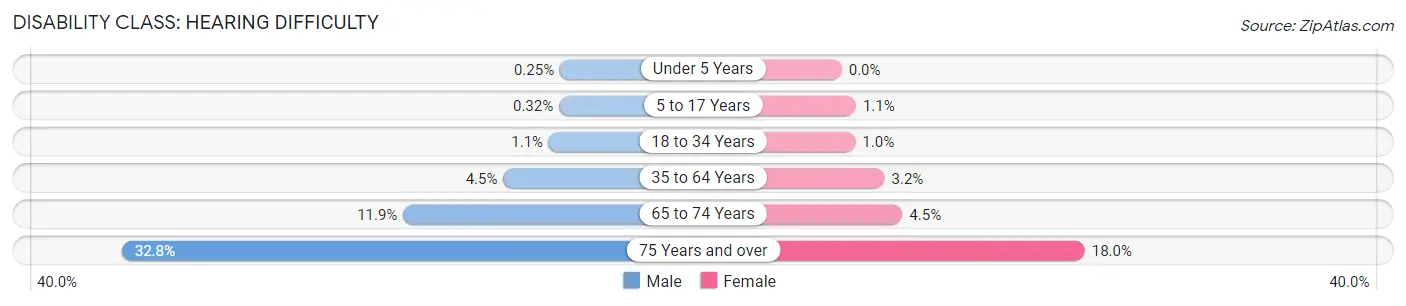
| Age Bracket | Male | Female |
| Under 5 Years | 6 (0.3%) | 0 (0.0%) |
| 5 to 17 Years | 19 (0.3%) | 57 (1.1%) |
| 18 to 34 Years | 81 (1.1%) | 71 (1.0%) |
| 35 to 64 Years | 513 (4.5%) | 354 (3.2%) |
| 65 to 74 Years | 296 (11.9%) | 119 (4.5%) |
| 75 Years and over | 512 (32.8%) | 397 (18.0%) |
Disability Class: Vision Difficulty
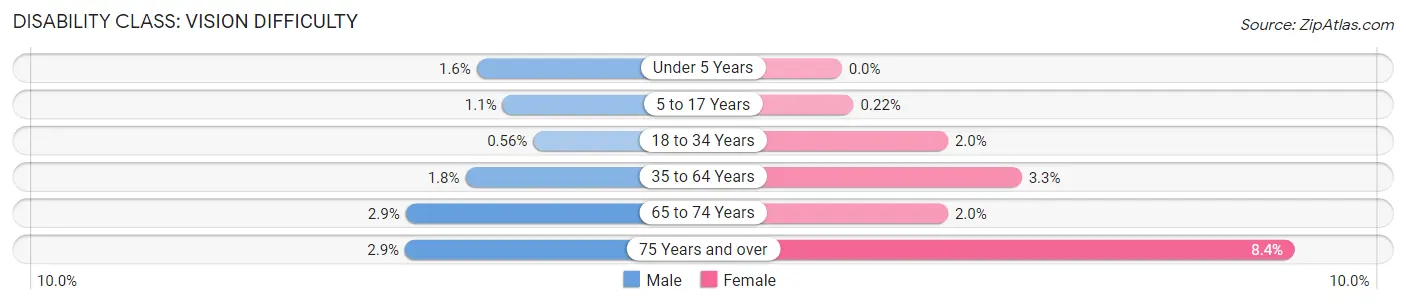
| Age Bracket | Male | Female |
| Under 5 Years | 38 (1.6%) | 0 (0.0%) |
| 5 to 17 Years | 68 (1.1%) | 12 (0.2%) |
| 18 to 34 Years | 42 (0.6%) | 138 (2.0%) |
| 35 to 64 Years | 210 (1.8%) | 371 (3.3%) |
| 65 to 74 Years | 73 (2.9%) | 52 (2.0%) |
| 75 Years and over | 46 (2.9%) | 185 (8.4%) |
Disability Class: Cognitive Difficulty
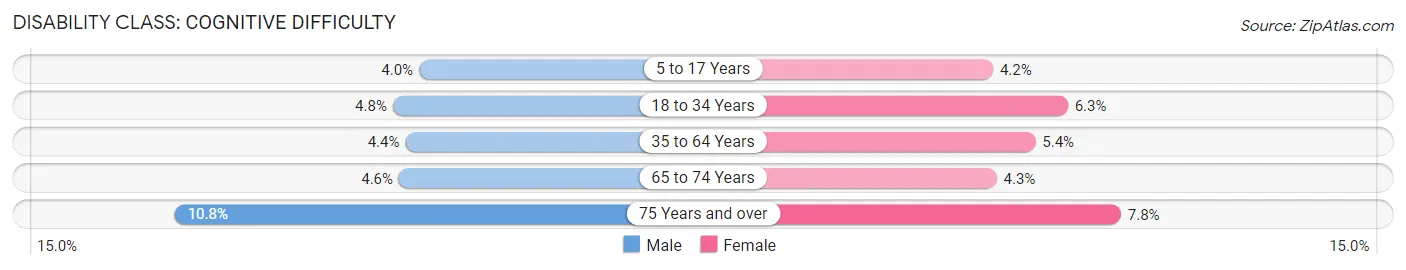
| Age Bracket | Male | Female |
| 5 to 17 Years | 242 (4.0%) | 228 (4.2%) |
| 18 to 34 Years | 359 (4.8%) | 441 (6.3%) |
| 35 to 64 Years | 507 (4.4%) | 599 (5.4%) |
| 65 to 74 Years | 114 (4.6%) | 114 (4.3%) |
| 75 Years and over | 169 (10.8%) | 171 (7.8%) |
Disability Class: Ambulatory Difficulty
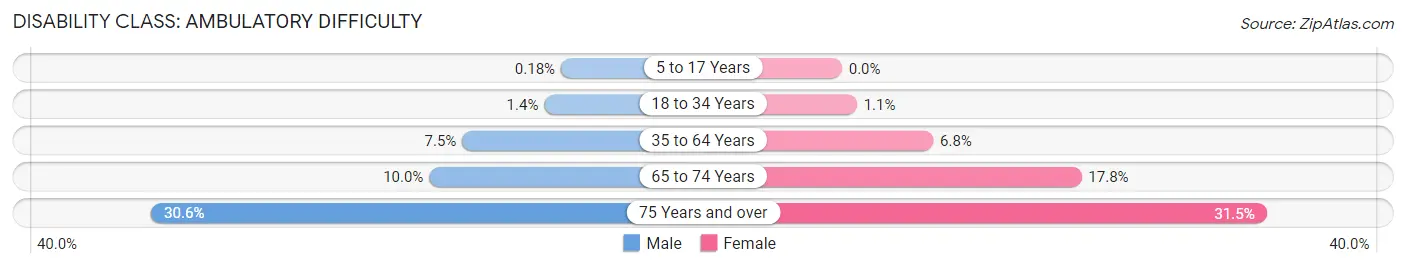
| Age Bracket | Male | Female |
| 5 to 17 Years | 11 (0.2%) | 0 (0.0%) |
| 18 to 34 Years | 107 (1.4%) | 78 (1.1%) |
| 35 to 64 Years | 865 (7.5%) | 754 (6.8%) |
| 65 to 74 Years | 248 (10.0%) | 470 (17.8%) |
| 75 Years and over | 478 (30.6%) | 694 (31.5%) |
Disability Class: Self-Care Difficulty
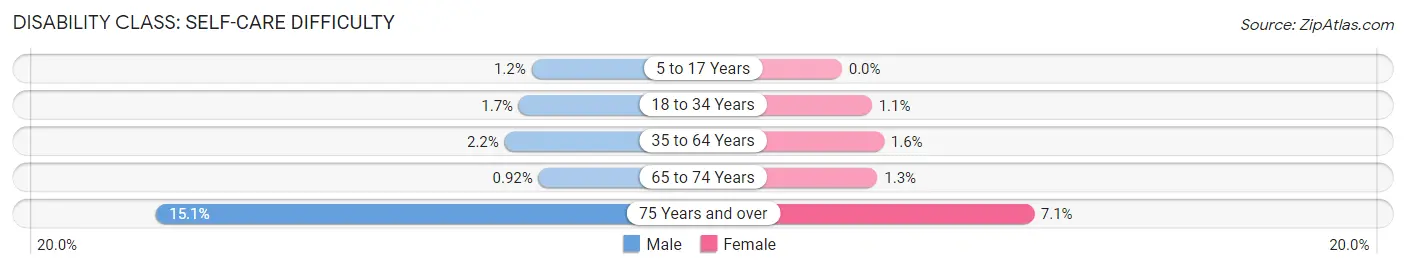
| Age Bracket | Male | Female |
| 5 to 17 Years | 71 (1.2%) | 0 (0.0%) |
| 18 to 34 Years | 125 (1.7%) | 78 (1.1%) |
| 35 to 64 Years | 251 (2.2%) | 173 (1.6%) |
| 65 to 74 Years | 23 (0.9%) | 35 (1.3%) |
| 75 Years and over | 236 (15.1%) | 157 (7.1%) |
Technology Access in Bellevue
Computing Device Access in Bellevue
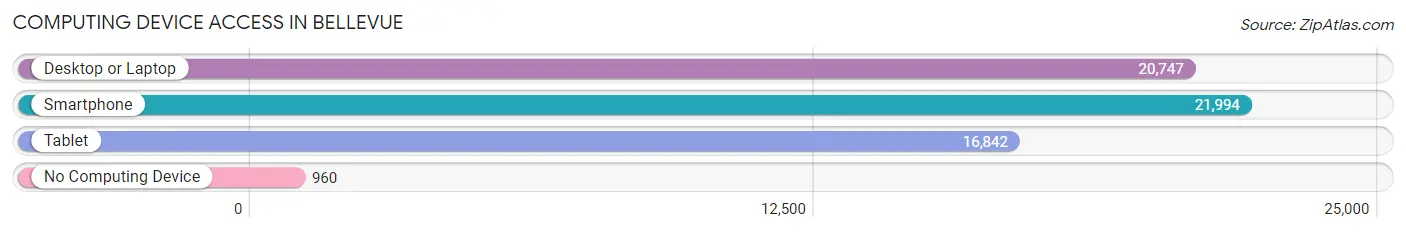
| Device Type | # Households | % Households |
| Desktop or Laptop | 20,747 | 84.9% |
| Smartphone | 21,994 | 90.0% |
| Tablet | 16,842 | 68.9% |
| No Computing Device | 960 | 3.9% |
| Total | 24,442 | 100.0% |
Internet Access in Bellevue
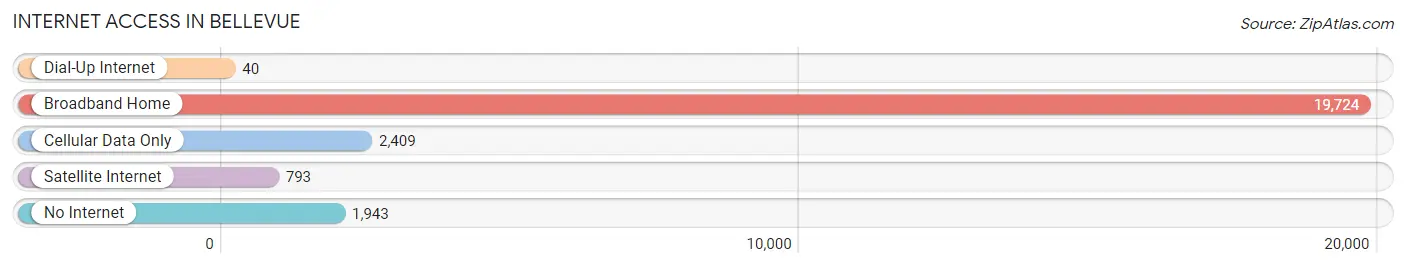
| Internet Type | # Households | % Households |
| Dial-Up Internet | 40 | 0.2% |
| Broadband Home | 19,724 | 80.7% |
| Cellular Data Only | 2,409 | 9.9% |
| Satellite Internet | 793 | 3.2% |
| No Internet | 1,943 | 8.0% |
| Total | 24,442 | 100.0% |
Bellevue Summary
Bellevue, Nebraska is a city located in Sarpy County, Nebraska, United States. It is part of the Omaha-Council Bluffs metropolitan area and is the largest suburb of Omaha. As of the 2010 census, the city population was 50,137, making it the third largest city in Nebraska.
History
Bellevue was founded in 1855 by German immigrants who named the city after the French word for “beautiful view.” The city was incorporated in 1882 and was the first city in Nebraska to be incorporated. The city was originally a farming community, but in the late 19th century, it became a popular destination for Omaha residents looking to escape the city.
In the early 20th century, Bellevue became a popular summer resort for Omaha residents. The city was home to several resorts, including the Bellevue Hotel, which was built in 1906 and was the largest hotel in the state at the time.
In the 1950s, Bellevue began to experience rapid growth due to its proximity to Omaha. The city was annexed by Omaha in 1957, but the annexation was later reversed in a court ruling.
Geography
Bellevue is located in Sarpy County, Nebraska, in the Omaha-Council Bluffs metropolitan area. The city is situated on the Missouri River, and is bordered by the cities of Omaha and Papillion. The city has a total area of 24.2 square miles, of which 23.9 square miles is land and 0.3 square miles is water.
Economy
Bellevue’s economy is largely based on the service industry, with many residents employed in retail, healthcare, and hospitality. The city is also home to several large employers, including Offutt Air Force Base, the University of Nebraska Medical Center, and the Bellevue Public Schools.
Demographics
As of the 2010 census, the population of Bellevue was 50,137, with a population density of 2,072 people per square mile. The racial makeup of the city was 79.2% White, 8.2% African American, 0.7% Native American, 4.2% Asian, 0.1% Pacific Islander, 4.3% from other races, and 3.3% from two or more races. Hispanic or Latino of any race were 8.7% of the population.
The median income for a household in the city was $50,945, and the median income for a family was $62,917. The per capita income for the city was $25,945. About 5.2% of families and 7.2% of the population were below the poverty line, including 8.7% of those under age 18 and 5.2% of those age 65 or over.
Common Questions
What is the Total Population of Bellevue?
Total Population of Bellevue is 63,336.
What is the Total Male Population of Bellevue?
Total Male Population of Bellevue is 32,813.
What is the Total Female Population of Bellevue?
Total Female Population of Bellevue is 30,523.
What is the Ratio of Males per 100 Females in Bellevue?
There are 107.50 Males per 100 Females in Bellevue.
What is the Ratio of Females per 100 Males in Bellevue?
There are 93.02 Females per 100 Males in Bellevue.
What is the Median Population Age in Bellevue?
Median Population Age in Bellevue is 35.5 Years.
What is the Average Family Size in Bellevue
Average Family Size in Bellevue is 3.1 People.
What is the Average Household Size in Bellevue
Average Household Size in Bellevue is 2.6 People.
What is Per Capita Income in Bellevue?
Per Capita income in Bellevue is $37,028.
What is the Median Family Income in Bellevue?
Median Family Income in Bellevue is $96,282.
What is the Median Household income in Bellevue?
Median Household Income in Bellevue is $79,839.
What is Income or Wage Gap in Bellevue?
Income or Wage Gap in Bellevue is 28.4%.
Women in Bellevue earn 71.6 cents for every dollar earned by a man.
What is Family Income Deficit in Bellevue?
Family Income Deficit in Bellevue is $10,323.
Families that are below poverty line in Bellevue earn $10,323 less on average than the poverty threshold level.
What is Inequality or Gini Index in Bellevue?
Inequality or Gini Index in Bellevue is 0.39.
How Large is the Labor Force in Bellevue?
There are 33,659 People in the Labor Forcein in Bellevue.
What is the Percentage of People in the Labor Force in Bellevue?
68.1% of People are in the Labor Force in Bellevue.
What is the Unemployment Rate in Bellevue?
Unemployment Rate in Bellevue is 2.9%.