Chisago County, MN
Chisago County Map
Chisago County Overview
56,927
TOTAL POPULATION
29,651
MALE POPULATION
27,276
FEMALE POPULATION
108.71
MALES / 100 FEMALES
91.99
FEMALES / 100 MALES
40.8
MEDIAN AGE
3.0
AVG FAMILY SIZE
2.6
AVG HOUSEHOLD SIZE
$41,814
PER CAPITA INCOME
$112,631
AVG FAMILY INCOME
$97,446
AVG HOUSEHOLD INCOME
30.9%
WAGE / INCOME GAP [ % ]
69.1¢/ $1
WAGE / INCOME GAP [ $ ]
$11,824
FAMILY INCOME DEFICIT
0.38
INEQUALITY / GINI INDEX
31,269
LABOR FORCE [ PEOPLE ]
68.1%
PERCENT IN LABOR FORCE
3.7%
UNEMPLOYMENT RATE
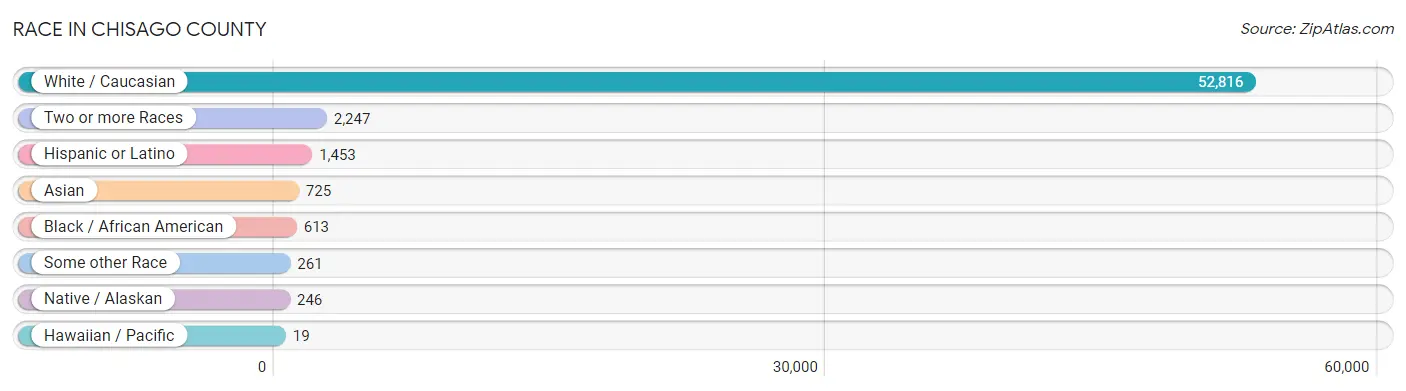
Race in Chisago County
The most populous races in Chisago County are White / Caucasian (52,816 | 92.8%), Two or more Races (2,247 | 4.0%), and Hispanic or Latino (1,453 | 2.5%).
| Race | # Population | % Population |
| Asian | 725 | 1.3% |
| Black / African American | 613 | 1.1% |
| Hawaiian / Pacific | 19 | 0.0% |
| Hispanic or Latino | 1,453 | 2.5% |
| Native / Alaskan | 246 | 0.4% |
| White / Caucasian | 52,816 | 92.8% |
| Two or more Races | 2,247 | 4.0% |
| Some other Race | 261 | 0.5% |
| Total | 56,927 | 100.0% |
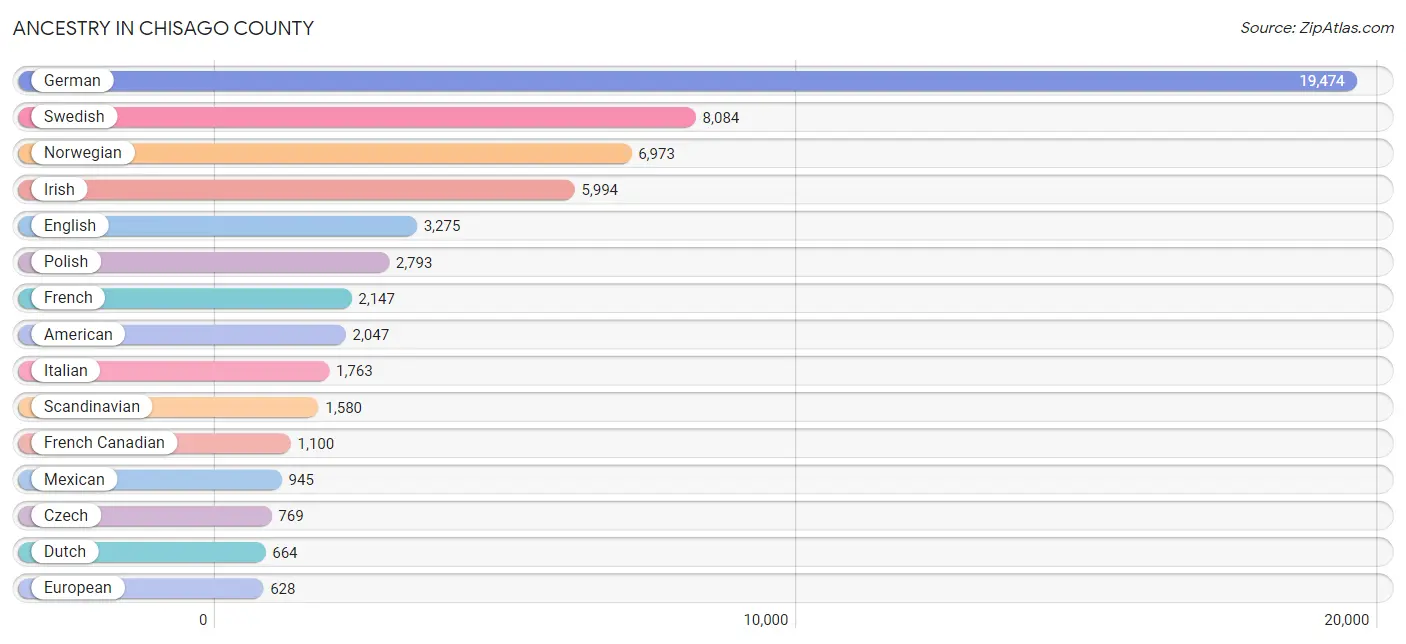
Ancestry in Chisago County
The most populous ancestries reported in Chisago County are German (19,474 | 34.2%), Swedish (8,084 | 14.2%), Norwegian (6,973 | 12.2%), Irish (5,994 | 10.5%), and English (3,275 | 5.8%), together accounting for 76.9% of all Chisago County residents.
| Ancestry | # Population | % Population |
| African | 15 | 0.0% |
| Aleut | 14 | 0.0% |
| American | 2,047 | 3.6% |
| Apache | 4 | 0.0% |
| Arab | 71 | 0.1% |
| Australian | 25 | 0.0% |
| Austrian | 175 | 0.3% |
| Bangladeshi | 146 | 0.3% |
| Belgian | 155 | 0.3% |
| Bhutanese | 65 | 0.1% |
| Blackfeet | 43 | 0.1% |
| Brazilian | 27 | 0.1% |
| British | 158 | 0.3% |
| Bulgarian | 26 | 0.1% |
| Burmese | 85 | 0.2% |
| Canadian | 136 | 0.2% |
| Carpatho Rusyn | 5 | 0.0% |
| Celtic | 6 | 0.0% |
| Central American | 239 | 0.4% |
| Central American Indian | 45 | 0.1% |
| Cherokee | 49 | 0.1% |
| Chippewa | 308 | 0.5% |
| Colombian | 21 | 0.0% |
| Comanche | 4 | 0.0% |
| Costa Rican | 17 | 0.0% |
| Cree | 22 | 0.0% |
| Croatian | 69 | 0.1% |
| Cuban | 33 | 0.1% |
| Czech | 769 | 1.3% |
| Czechoslovakian | 27 | 0.1% |
| Danish | 622 | 1.1% |
| Dominican | 3 | 0.0% |
| Dutch | 664 | 1.2% |
| Eastern European | 301 | 0.5% |
| English | 3,275 | 5.8% |
| Estonian | 24 | 0.0% |
| Ethiopian | 11 | 0.0% |
| European | 628 | 1.1% |
| Filipino | 9 | 0.0% |
| Finnish | 559 | 1.0% |
| French | 2,147 | 3.8% |
| French American Indian | 29 | 0.1% |
| French Canadian | 1,100 | 1.9% |
| German | 19,474 | 34.2% |
| Greek | 15 | 0.0% |
| Guatemalan | 119 | 0.2% |
| Honduran | 41 | 0.1% |
| Hungarian | 115 | 0.2% |
| Icelander | 44 | 0.1% |
| Indian (Asian) | 174 | 0.3% |
| Indonesian | 17 | 0.0% |
| Irish | 5,994 | 10.5% |
| Iroquois | 2 | 0.0% |
| Italian | 1,763 | 3.1% |
| Jamaican | 17 | 0.0% |
| Japanese | 138 | 0.2% |
| Kenyan | 22 | 0.0% |
| Korean | 313 | 0.5% |
| Laotian | 4 | 0.0% |
| Latvian | 17 | 0.0% |
| Lebanese | 69 | 0.1% |
| Liberian | 10 | 0.0% |
| Lithuanian | 61 | 0.1% |
| Luxembourger | 39 | 0.1% |
| Malaysian | 80 | 0.1% |
| Maltese | 3 | 0.0% |
| Mexican | 945 | 1.7% |
| Mexican American Indian | 11 | 0.0% |
| Native Hawaiian | 52 | 0.1% |
| Nicaraguan | 13 | 0.0% |
| Nigerian | 4 | 0.0% |
| Northern European | 105 | 0.2% |
| Norwegian | 6,973 | 12.2% |
| Pakistani | 28 | 0.1% |
| Panamanian | 7 | 0.0% |
| Peruvian | 5 | 0.0% |
| Polish | 2,793 | 4.9% |
| Portuguese | 36 | 0.1% |
| Pueblo | 3 | 0.0% |
| Puerto Rican | 124 | 0.2% |
| Romanian | 23 | 0.0% |
| Russian | 212 | 0.4% |
| Salvadoran | 42 | 0.1% |
| Samoan | 10 | 0.0% |
| Scandinavian | 1,580 | 2.8% |
| Scotch-Irish | 187 | 0.3% |
| Scottish | 615 | 1.1% |
| Sioux | 23 | 0.0% |
| Slavic | 23 | 0.0% |
| Slovak | 19 | 0.0% |
| Slovene | 31 | 0.1% |
| Somali | 13 | 0.0% |
| South American | 26 | 0.1% |
| South American Indian | 5 | 0.0% |
| Spaniard | 10 | 0.0% |
| Spanish | 41 | 0.1% |
| Sri Lankan | 47 | 0.1% |
| Subsaharan African | 75 | 0.1% |
| Swedish | 8,084 | 14.2% |
| Swiss | 178 | 0.3% |
| Syrian | 2 | 0.0% |
| Thai | 31 | 0.1% |
| Turkish | 6 | 0.0% |
| Ukrainian | 63 | 0.1% |
| Welsh | 260 | 0.5% |
| Yugoslavian | 44 | 0.1% |
| Yup'ik | 16 | 0.0% | View All 107 Rows |
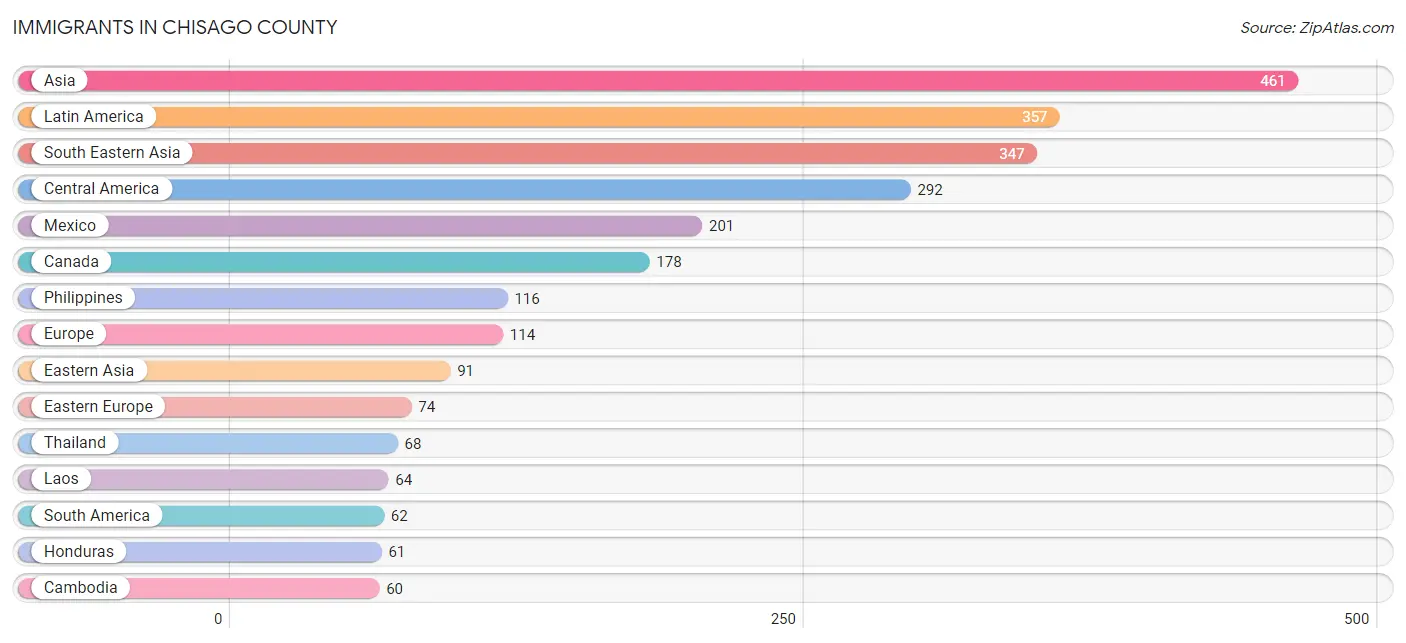
Immigrants in Chisago County
The most numerous immigrant groups reported in Chisago County came from Asia (461 | 0.8%), Latin America (357 | 0.6%), South Eastern Asia (347 | 0.6%), Central America (292 | 0.5%), and Mexico (201 | 0.4%), together accounting for 2.9% of all Chisago County residents.
| Immigration Origin | # Population | % Population |
| Africa | 56 | 0.1% |
| Asia | 461 | 0.8% |
| Australia | 8 | 0.0% |
| Bosnia and Herzegovina | 10 | 0.0% |
| Brazil | 30 | 0.1% |
| Cambodia | 60 | 0.1% |
| Canada | 178 | 0.3% |
| Caribbean | 3 | 0.0% |
| Central America | 292 | 0.5% |
| China | 37 | 0.1% |
| Colombia | 21 | 0.0% |
| Dominican Republic | 3 | 0.0% |
| Eastern Africa | 46 | 0.1% |
| Eastern Asia | 91 | 0.2% |
| Eastern Europe | 74 | 0.1% |
| El Salvador | 19 | 0.0% |
| England | 7 | 0.0% |
| Ethiopia | 11 | 0.0% |
| Europe | 114 | 0.2% |
| Germany | 17 | 0.0% |
| Guatemala | 4 | 0.0% |
| Honduras | 61 | 0.1% |
| India | 9 | 0.0% |
| Ireland | 9 | 0.0% |
| Italy | 3 | 0.0% |
| Japan | 3 | 0.0% |
| Kenya | 22 | 0.0% |
| Korea | 51 | 0.1% |
| Laos | 64 | 0.1% |
| Latin America | 357 | 0.6% |
| Liberia | 5 | 0.0% |
| Malaysia | 6 | 0.0% |
| Mexico | 201 | 0.4% |
| Nepal | 2 | 0.0% |
| Netherlands | 4 | 0.0% |
| Northern Europe | 16 | 0.0% |
| Oceania | 8 | 0.0% |
| Pakistan | 12 | 0.0% |
| Panama | 7 | 0.0% |
| Peru | 11 | 0.0% |
| Philippines | 116 | 0.2% |
| Russia | 36 | 0.1% |
| Singapore | 2 | 0.0% |
| Somalia | 13 | 0.0% |
| South America | 62 | 0.1% |
| South Central Asia | 23 | 0.0% |
| South Eastern Asia | 347 | 0.6% |
| Southern Europe | 3 | 0.0% |
| Taiwan | 9 | 0.0% |
| Thailand | 68 | 0.1% |
| Ukraine | 28 | 0.1% |
| Vietnam | 13 | 0.0% |
| Western Africa | 10 | 0.0% |
| Western Europe | 21 | 0.0% | View All 54 Rows |
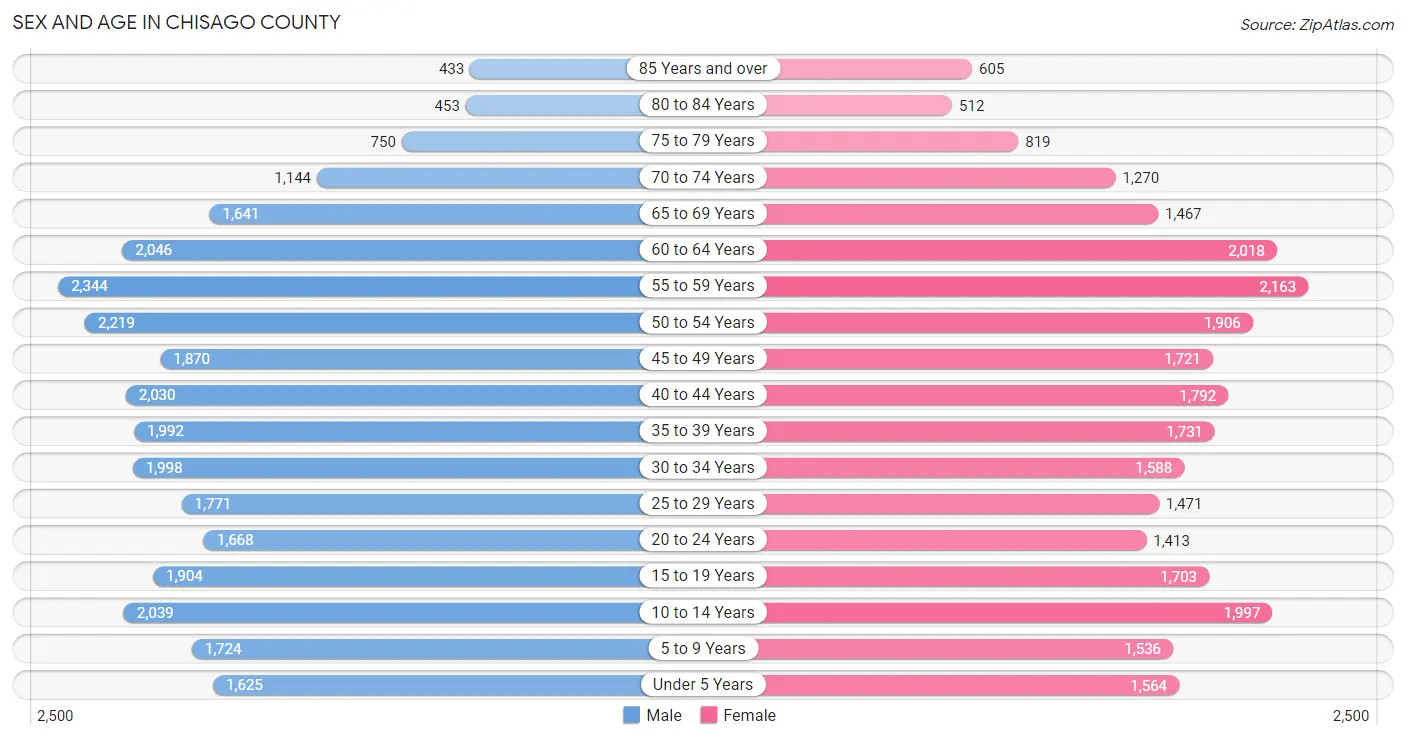
Sex and Age in Chisago County
Sex and Age in Chisago County
The most populous age groups in Chisago County are 55 to 59 Years (2,344 | 7.9%) for men and 55 to 59 Years (2,163 | 7.9%) for women.
| Age Bracket | Male | Female |
| Under 5 Years | 1,625 (5.5%) | 1,564 (5.7%) |
| 5 to 9 Years | 1,724 (5.8%) | 1,536 (5.6%) |
| 10 to 14 Years | 2,039 (6.9%) | 1,997 (7.3%) |
| 15 to 19 Years | 1,904 (6.4%) | 1,703 (6.2%) |
| 20 to 24 Years | 1,668 (5.6%) | 1,413 (5.2%) |
| 25 to 29 Years | 1,771 (6.0%) | 1,471 (5.4%) |
| 30 to 34 Years | 1,998 (6.7%) | 1,588 (5.8%) |
| 35 to 39 Years | 1,992 (6.7%) | 1,731 (6.4%) |
| 40 to 44 Years | 2,030 (6.9%) | 1,792 (6.6%) |
| 45 to 49 Years | 1,870 (6.3%) | 1,721 (6.3%) |
| 50 to 54 Years | 2,219 (7.5%) | 1,906 (7.0%) |
| 55 to 59 Years | 2,344 (7.9%) | 2,163 (7.9%) |
| 60 to 64 Years | 2,046 (6.9%) | 2,018 (7.4%) |
| 65 to 69 Years | 1,641 (5.5%) | 1,467 (5.4%) |
| 70 to 74 Years | 1,144 (3.9%) | 1,270 (4.7%) |
| 75 to 79 Years | 750 (2.5%) | 819 (3.0%) |
| 80 to 84 Years | 453 (1.5%) | 512 (1.9%) |
| 85 Years and over | 433 (1.5%) | 605 (2.2%) |
| Total | 29,651 (100.0%) | 27,276 (100.0%) |
Families and Households in Chisago County
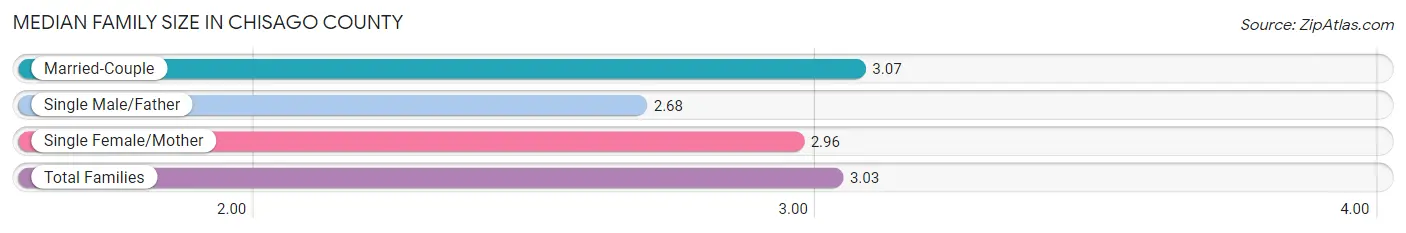
Median Family Size in Chisago County
The median family size in Chisago County is 3.03 persons per family, with married-couple families (12,978 | 83.8%) accounting for the largest median family size of 3.07 persons per family. On the other hand, single male/father families (1,106 | 7.1%) represent the smallest median family size with 2.68 persons per family.
| Family Type | # Families | Family Size |
| Married-Couple | 12,978 (83.8%) | 3.07 |
| Single Male/Father | 1,106 (7.1%) | 2.68 |
| Single Female/Mother | 1,407 (9.1%) | 2.96 |
| Total Families | 15,491 (100.0%) | 3.03 |
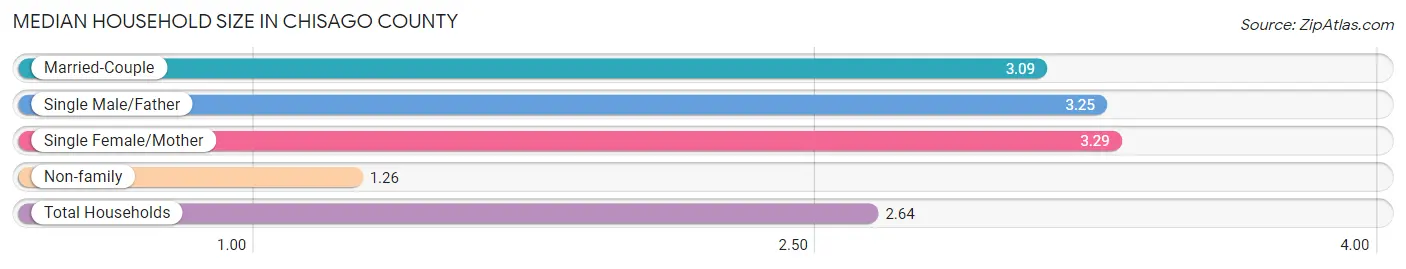
Median Household Size in Chisago County
The median household size in Chisago County is 2.64 persons per household, with single female/mother households (1,407 | 6.7%) accounting for the largest median household size of 3.29 persons per household. non-family households (5,420 | 25.9%) represent the smallest median household size with 1.26 persons per household.
| Household Type | # Households | Household Size |
| Married-Couple | 12,978 (62.1%) | 3.09 |
| Single Male/Father | 1,106 (5.3%) | 3.25 |
| Single Female/Mother | 1,407 (6.7%) | 3.29 |
| Non-family | 5,420 (25.9%) | 1.26 |
| Total Households | 20,911 (100.0%) | 2.64 |
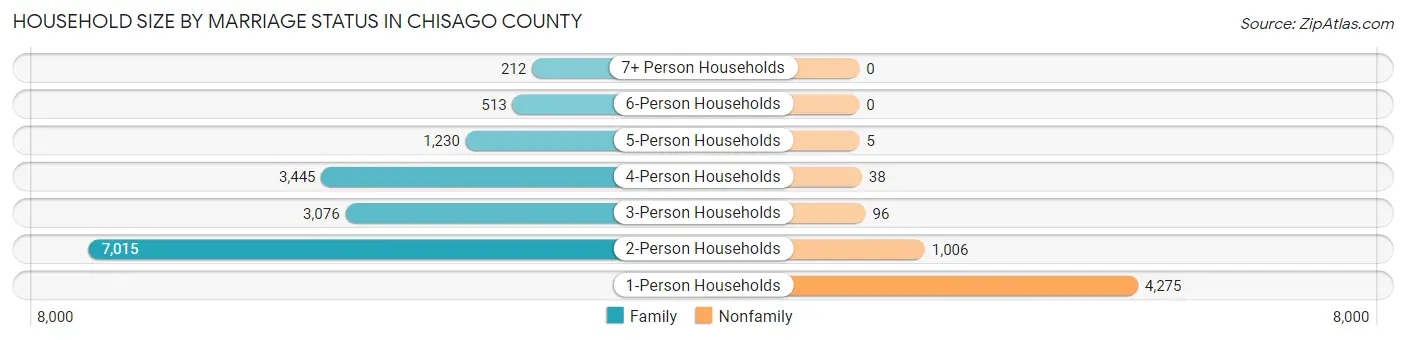
Household Size by Marriage Status in Chisago County
Out of a total of 20,911 households in Chisago County, 15,491 (74.1%) are family households, while 5,420 (25.9%) are nonfamily households. The most numerous type of family households are 2-person households, comprising 7,015, and the most common type of nonfamily households are 1-person households, comprising 4,275.
| Household Size | Family Households | Nonfamily Households |
| 1-Person Households | - | 4,275 (20.4%) |
| 2-Person Households | 7,015 (33.6%) | 1,006 (4.8%) |
| 3-Person Households | 3,076 (14.7%) | 96 (0.5%) |
| 4-Person Households | 3,445 (16.5%) | 38 (0.2%) |
| 5-Person Households | 1,230 (5.9%) | 5 (0.0%) |
| 6-Person Households | 513 (2.5%) | 0 (0.0%) |
| 7+ Person Households | 212 (1.0%) | 0 (0.0%) |
| Total | 15,491 (74.1%) | 5,420 (25.9%) |
Female Fertility in Chisago County
Fertility by Age in Chisago County
Average fertility rate in Chisago County is 62.0 births per 1,000 women. Women in the age bracket of 20 to 34 years have the highest fertility rate with 126.0 births per 1,000 women. Women in the age bracket of 20 to 34 years acount for 78.1% of all women with births.
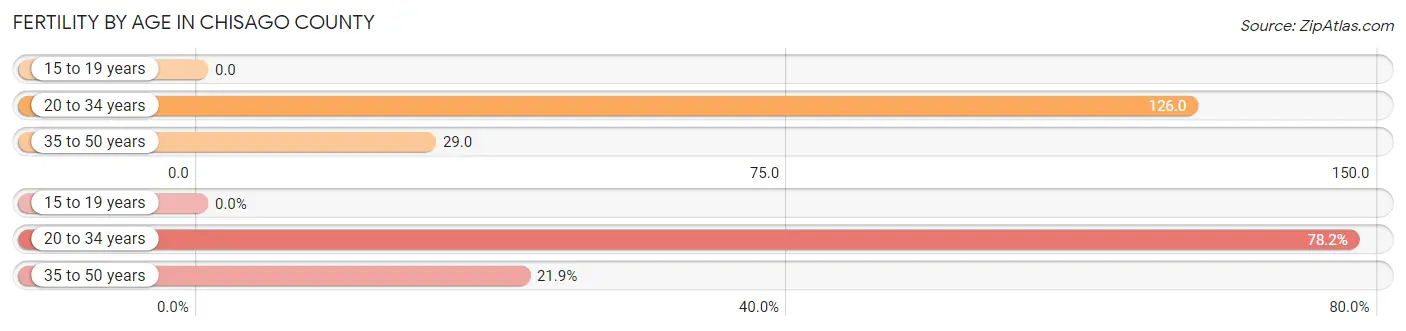
| Age Bracket | Women with Births | Births / 1,000 Women |
| 15 to 19 years | 0 (0.0%) | 0.0 |
| 20 to 34 years | 565 (78.1%) | 126.0 |
| 35 to 50 years | 158 (21.8%) | 29.0 |
| Total | 723 (100.0%) | 62.0 |
Fertility by Age by Marriage Status in Chisago County
77.3% of women with births (723) in Chisago County are married. The highest percentage of unmarried women with births falls into 20 to 34 years age bracket with 26.7% of them unmarried at the time of birth, while the lowest percentage of unmarried women with births belong to 35 to 50 years age bracket with 8.2% of them unmarried.
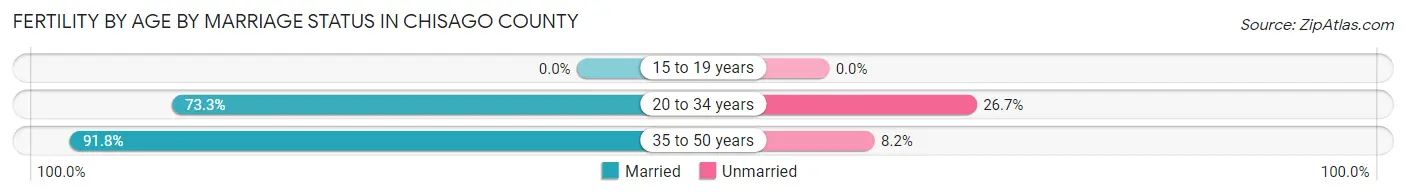
| Age Bracket | Married | Unmarried |
| 15 to 19 years | 0 (0.0%) | 0 (0.0%) |
| 20 to 34 years | 414 (73.3%) | 151 (26.7%) |
| 35 to 50 years | 145 (91.8%) | 13 (8.2%) |
| Total | 559 (77.3%) | 164 (22.7%) |
Fertility by Education in Chisago County
Average fertility rate in Chisago County is 62.0 births per 1,000 women. Women with the education attainment of college or associate's degree have the highest fertility rate of 87.0 births per 1,000 women, while women with the education attainment of less than high school have the lowest fertility at 7.0 births per 1,000 women. Women with the education attainment of college or associate's degree represent 57.3% of all women with births.
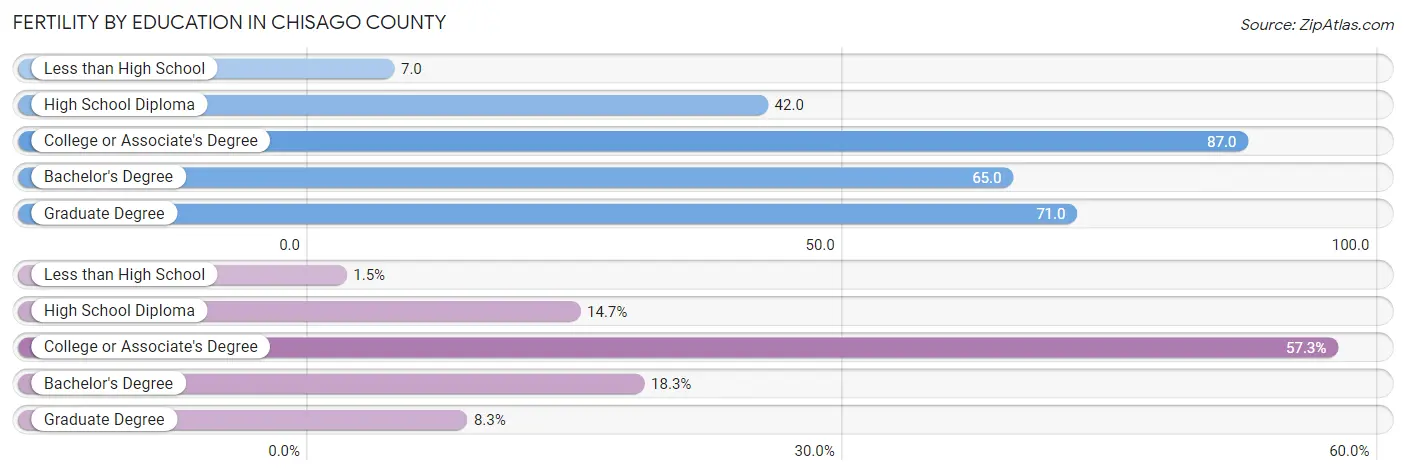
| Educational Attainment | Women with Births | Births / 1,000 Women |
| Less than High School | 11 (1.5%) | 7.0 |
| High School Diploma | 106 (14.7%) | 42.0 |
| College or Associate's Degree | 414 (57.3%) | 87.0 |
| Bachelor's Degree | 132 (18.3%) | 65.0 |
| Graduate Degree | 60 (8.3%) | 71.0 |
| Total | 723 (100.0%) | 62.0 |
Fertility by Education by Marriage Status in Chisago County
22.7% of women with births in Chisago County are unmarried. Women with the educational attainment of graduate degree are most likely to be married with 100.0% of them married at childbirth, while women with the educational attainment of high school diploma are least likely to be married with 71.7% of them unmarried at childbirth.
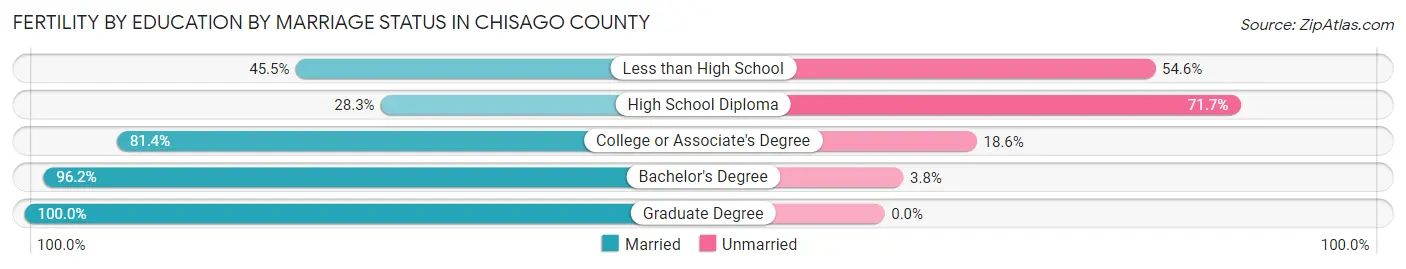
| Educational Attainment | Married | Unmarried |
| Less than High School | 5 (45.5%) | 6 (54.5%) |
| High School Diploma | 30 (28.3%) | 76 (71.7%) |
| College or Associate's Degree | 337 (81.4%) | 77 (18.6%) |
| Bachelor's Degree | 127 (96.2%) | 5 (3.8%) |
| Graduate Degree | 60 (100.0%) | 0 (0.0%) |
| Total | 559 (77.3%) | 164 (22.7%) |
Income in Chisago County
Income Overview in Chisago County
Per Capita Income in Chisago County is $41,814, while median incomes of families and households are $112,631 and $97,446 respectively.
| Characteristic | Number | Measure |
| Per Capita Income | 56,927 | $41,814 |
| Median Family Income | 15,491 | $112,631 |
| Mean Family Income | 15,491 | $125,731 |
| Median Household Income | 20,911 | $97,446 |
| Mean Household Income | 20,911 | $111,436 |
| Income Deficit | 15,491 | $11,824 |
| Wage / Income Gap (%) | 56,927 | 30.91% |
| Wage / Income Gap ($) | 56,927 | 69.09¢ per $1 |
| Gini / Inequality Index | 56,927 | 0.38 |
Earnings by Sex in Chisago County
Average Earnings in Chisago County are $49,404, $58,942 for men and $40,723 for women, a difference of 30.9%.
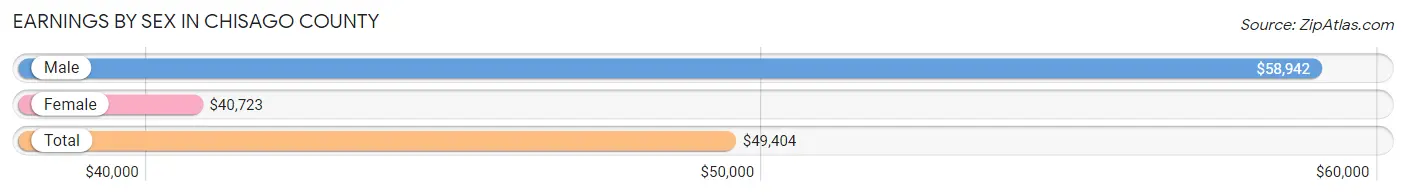
| Sex | Number | Average Earnings |
| Male | 17,625 (53.8%) | $58,942 |
| Female | 15,137 (46.2%) | $40,723 |
| Total | 32,762 (100.0%) | $49,404 |
Earnings by Sex by Income Bracket in Chisago County
The most common earnings brackets in Chisago County are $100,000+ for men (3,090 | 17.5%) and $75,000 to $99,999 for women (1,539 | 10.2%).
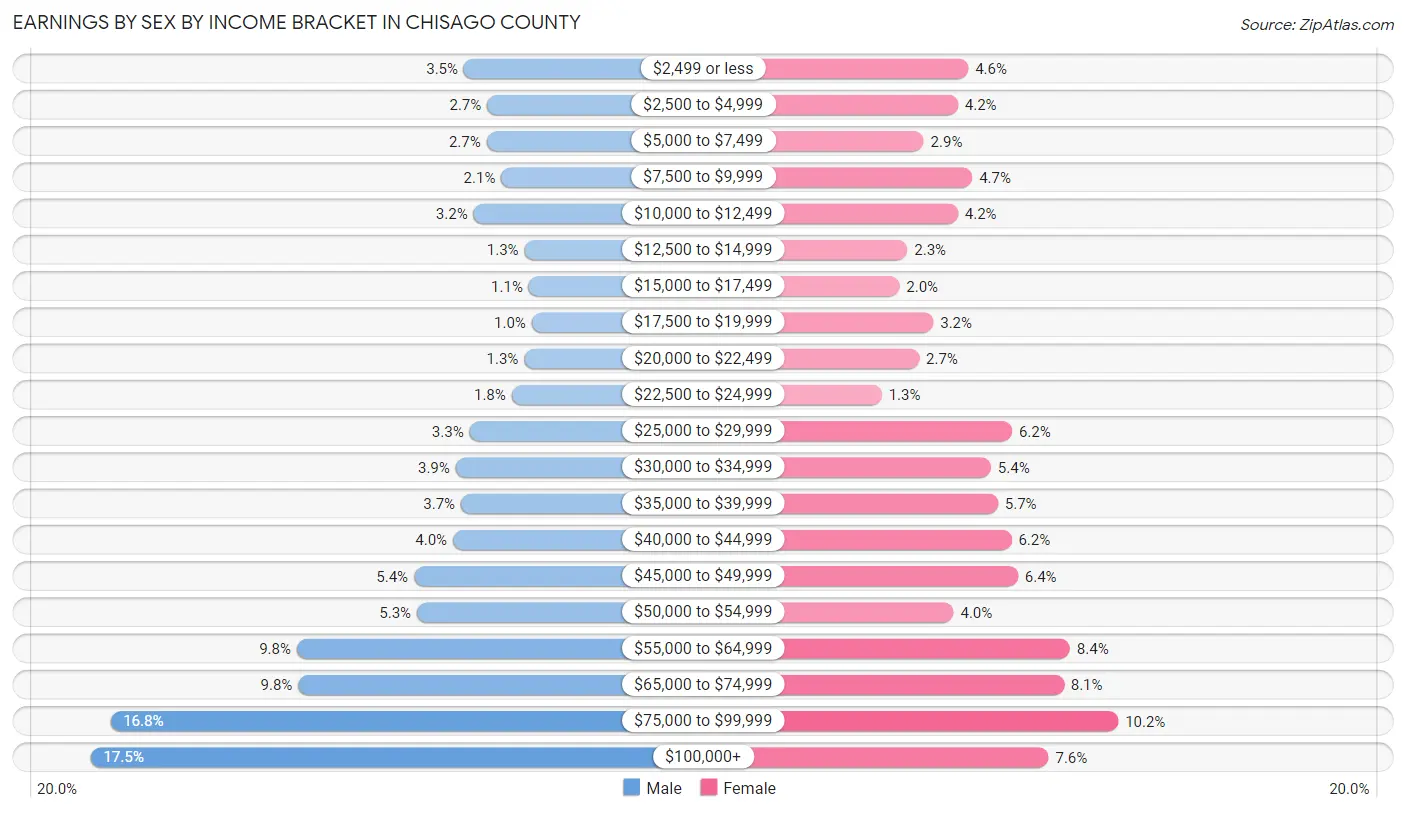
| Income | Male | Female |
| $2,499 or less | 624 (3.5%) | 688 (4.5%) |
| $2,500 to $4,999 | 470 (2.7%) | 630 (4.2%) |
| $5,000 to $7,499 | 474 (2.7%) | 436 (2.9%) |
| $7,500 to $9,999 | 378 (2.1%) | 711 (4.7%) |
| $10,000 to $12,499 | 561 (3.2%) | 629 (4.2%) |
| $12,500 to $14,999 | 224 (1.3%) | 343 (2.3%) |
| $15,000 to $17,499 | 195 (1.1%) | 298 (2.0%) |
| $17,500 to $19,999 | 177 (1.0%) | 491 (3.2%) |
| $20,000 to $22,499 | 226 (1.3%) | 410 (2.7%) |
| $22,500 to $24,999 | 308 (1.8%) | 198 (1.3%) |
| $25,000 to $29,999 | 587 (3.3%) | 937 (6.2%) |
| $30,000 to $34,999 | 678 (3.8%) | 818 (5.4%) |
| $35,000 to $39,999 | 644 (3.6%) | 856 (5.7%) |
| $40,000 to $44,999 | 696 (4.0%) | 934 (6.2%) |
| $45,000 to $49,999 | 953 (5.4%) | 971 (6.4%) |
| $50,000 to $54,999 | 934 (5.3%) | 606 (4.0%) |
| $55,000 to $64,999 | 1,727 (9.8%) | 1,266 (8.4%) |
| $65,000 to $74,999 | 1,719 (9.8%) | 1,231 (8.1%) |
| $75,000 to $99,999 | 2,960 (16.8%) | 1,539 (10.2%) |
| $100,000+ | 3,090 (17.5%) | 1,145 (7.6%) |
| Total | 17,625 (100.0%) | 15,137 (100.0%) |
Earnings by Sex by Educational Attainment in Chisago County
Average earnings in Chisago County are $65,480 for men and $44,906 for women, a difference of 31.4%. Men with an educational attainment of graduate degree enjoy the highest average annual earnings of $114,353, while those with high school diploma education earn the least with $52,637. Women with an educational attainment of graduate degree earn the most with the average annual earnings of $74,779, while those with less than high school education have the smallest earnings of $27,845.
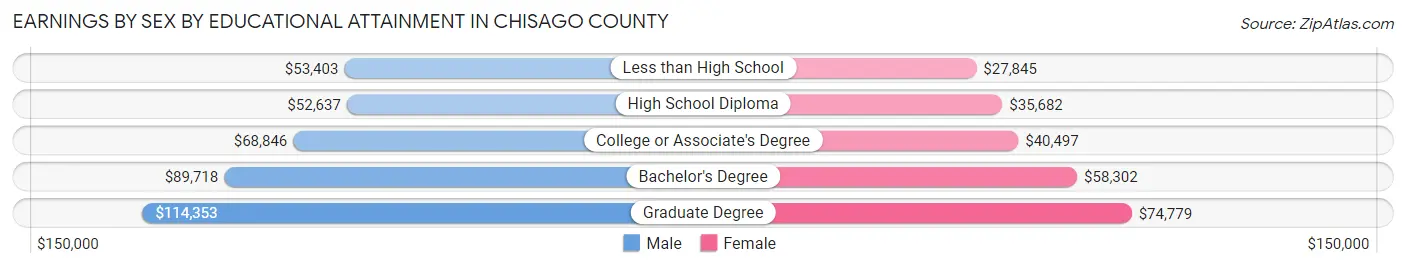
| Educational Attainment | Male Income | Female Income |
| Less than High School | $53,403 | $27,845 |
| High School Diploma | $52,637 | $35,682 |
| College or Associate's Degree | $68,846 | $40,497 |
| Bachelor's Degree | $89,718 | $58,302 |
| Graduate Degree | $114,353 | $74,779 |
| Total | $65,480 | $44,906 |
Family Income in Chisago County
Family Income Brackets in Chisago County
According to the Chisago County family income data, there are 4,322 families falling into the $100,000 to $149,999 income range, which is the most common income bracket and makes up 27.9% of all families. Conversely, the $10,000 to $14,999 income bracket is the least frequent group with only 108 families (0.7%) belonging to this category.
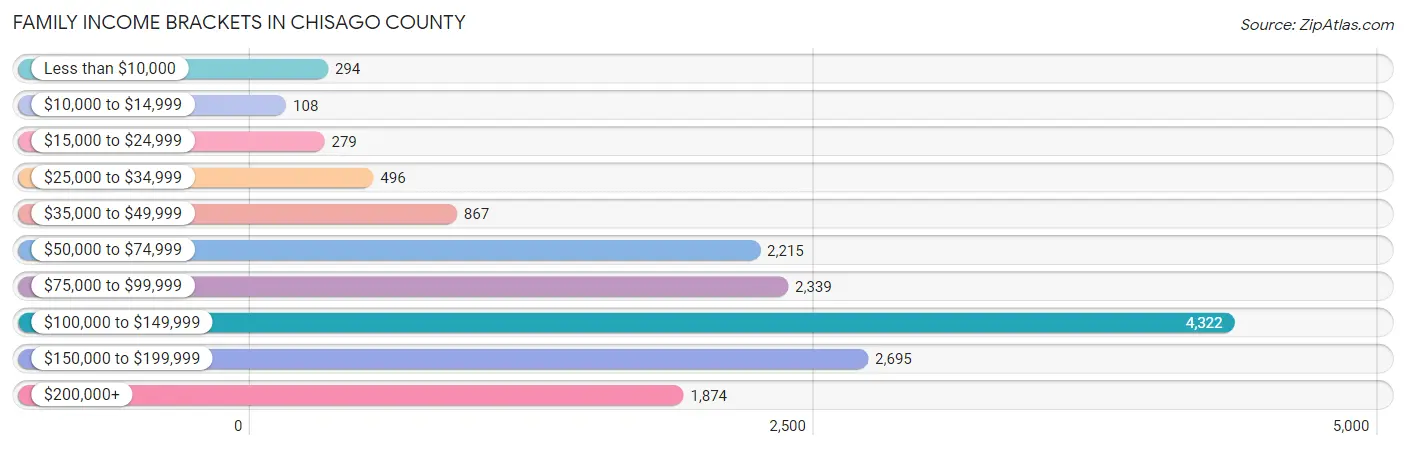
| Income Bracket | # Families | % Families |
| Less than $10,000 | 294 | 1.9% |
| $10,000 to $14,999 | 108 | 0.7% |
| $15,000 to $24,999 | 279 | 1.8% |
| $25,000 to $34,999 | 496 | 3.2% |
| $35,000 to $49,999 | 867 | 5.6% |
| $50,000 to $74,999 | 2,215 | 14.3% |
| $75,000 to $99,999 | 2,339 | 15.1% |
| $100,000 to $149,999 | 4,322 | 27.9% |
| $150,000 to $199,999 | 2,695 | 17.4% |
| $200,000+ | 1,874 | 12.1% |
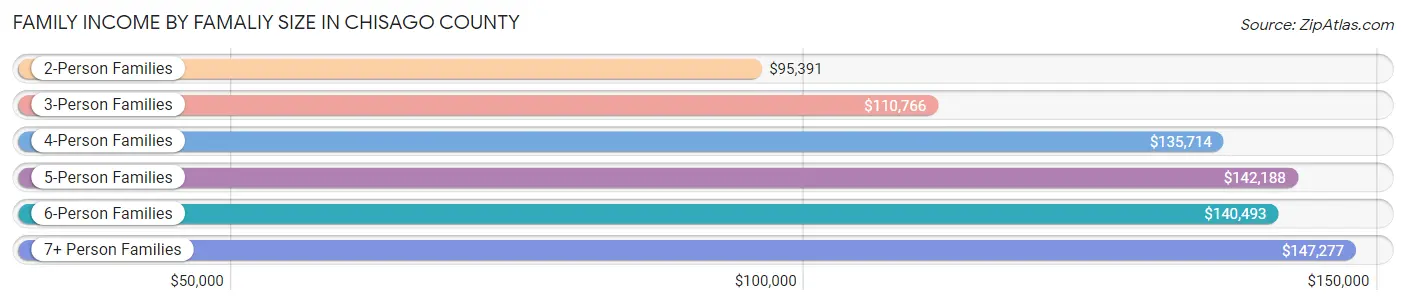
Family Income by Famaliy Size in Chisago County
7+ person families (179 | 1.2%) account for the highest median family income in Chisago County with $147,277 per family, while 2-person families (7,536 | 48.6%) have the highest median income of $47,696 per family member.
| Income Bracket | # Families | Median Income |
| 2-Person Families | 7,536 (48.6%) | $95,391 |
| 3-Person Families | 3,039 (19.6%) | $110,766 |
| 4-Person Families | 3,184 (20.5%) | $135,714 |
| 5-Person Families | 1,078 (7.0%) | $142,188 |
| 6-Person Families | 475 (3.1%) | $140,493 |
| 7+ Person Families | 179 (1.2%) | $147,277 |
| Total | 15,491 (100.0%) | $112,631 |
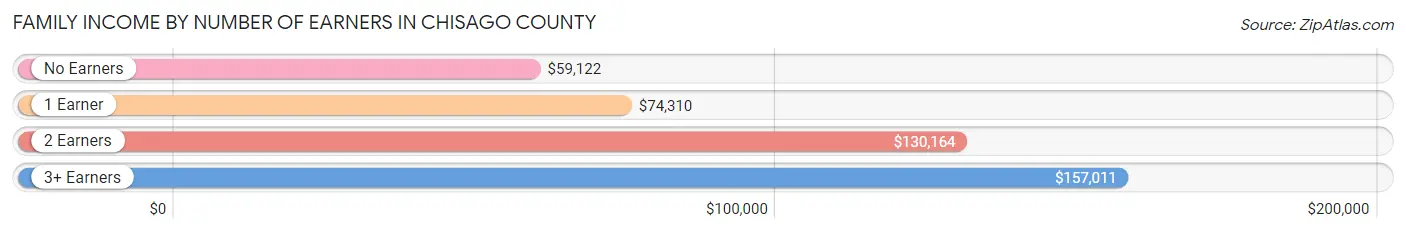
Family Income by Number of Earners in Chisago County
The median family income in Chisago County is $112,631, with families comprising 3+ earners (2,150) having the highest median family income of $157,011, while families with no earners (1,916) have the lowest median family income of $59,122, accounting for 13.9% and 12.4% of families, respectively.
| Number of Earners | # Families | Median Income |
| No Earners | 1,916 (12.4%) | $59,122 |
| 1 Earner | 3,651 (23.6%) | $74,310 |
| 2 Earners | 7,774 (50.2%) | $130,164 |
| 3+ Earners | 2,150 (13.9%) | $157,011 |
| Total | 15,491 (100.0%) | $112,631 |
Household Income in Chisago County
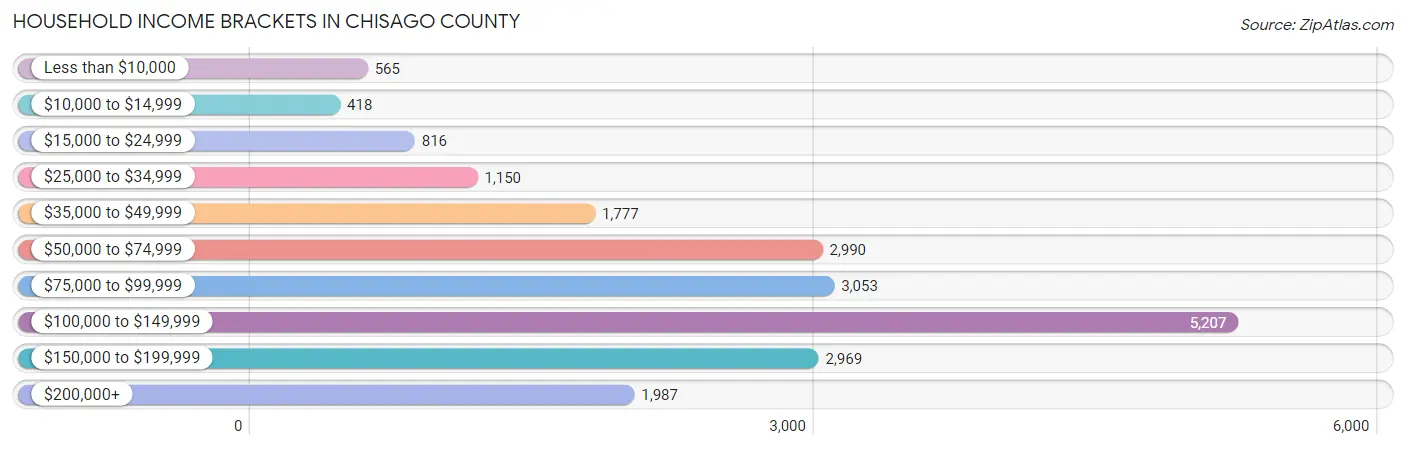
Household Income Brackets in Chisago County
With 5,207 households falling in the category, the $100,000 to $149,999 income range is the most frequent in Chisago County, accounting for 24.9% of all households. In contrast, only 418 households (2.0%) fall into the $10,000 to $14,999 income bracket, making it the least populous group.
| Income Bracket | # Households | % Households |
| Less than $10,000 | 565 | 2.7% |
| $10,000 to $14,999 | 418 | 2.0% |
| $15,000 to $24,999 | 816 | 3.9% |
| $25,000 to $34,999 | 1,150 | 5.5% |
| $35,000 to $49,999 | 1,777 | 8.5% |
| $50,000 to $74,999 | 2,990 | 14.3% |
| $75,000 to $99,999 | 3,053 | 14.6% |
| $100,000 to $149,999 | 5,207 | 24.9% |
| $150,000 to $199,999 | 2,969 | 14.2% |
| $200,000+ | 1,987 | 9.5% |
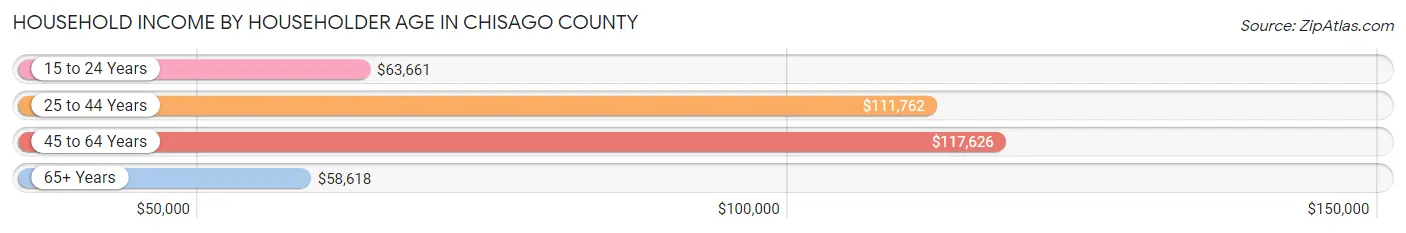
Household Income by Householder Age in Chisago County
The median household income in Chisago County is $97,446, with the highest median household income of $117,626 found in the 45 to 64 years age bracket for the primary householder. A total of 8,668 households (41.4%) fall into this category. Meanwhile, the 65+ years age bracket for the primary householder has the lowest median household income of $58,618, with 5,453 households (26.1%) in this group.
| Income Bracket | # Households | Median Income |
| 15 to 24 Years | 489 (2.3%) | $63,661 |
| 25 to 44 Years | 6,301 (30.1%) | $111,762 |
| 45 to 64 Years | 8,668 (41.4%) | $117,626 |
| 65+ Years | 5,453 (26.1%) | $58,618 |
| Total | 20,911 (100.0%) | $97,446 |
Poverty in Chisago County
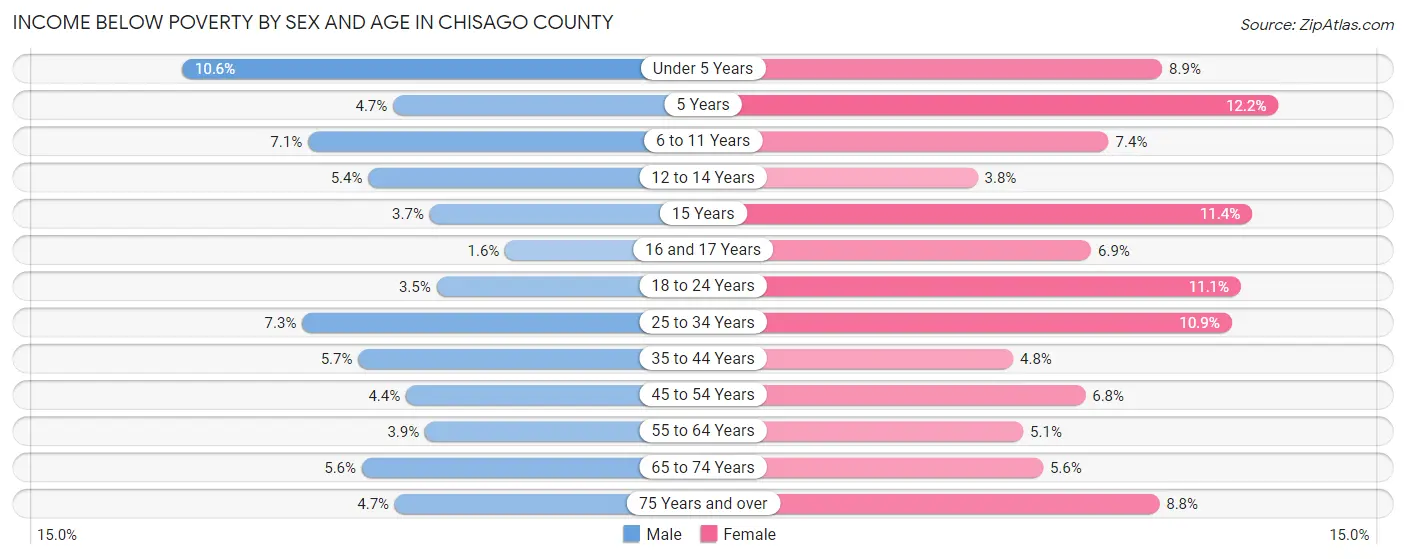
Income Below Poverty by Sex and Age in Chisago County
With 5.4% poverty level for males and 7.2% for females among the residents of Chisago County, under 5 year old males and 5 year old females are the most vulnerable to poverty, with 170 males (10.6%) and 26 females (12.1%) in their respective age groups living below the poverty level.
| Age Bracket | Male | Female |
| Under 5 Years | 170 (10.6%) | 136 (8.9%) |
| 5 Years | 17 (4.7%) | 26 (12.1%) |
| 6 to 11 Years | 159 (7.1%) | 147 (7.4%) |
| 12 to 14 Years | 60 (5.4%) | 47 (3.8%) |
| 15 Years | 10 (3.7%) | 29 (11.4%) |
| 16 and 17 Years | 16 (1.6%) | 58 (6.9%) |
| 18 to 24 Years | 79 (3.5%) | 225 (11.1%) |
| 25 to 34 Years | 244 (7.3%) | 332 (10.8%) |
| 35 to 44 Years | 218 (5.7%) | 168 (4.8%) |
| 45 to 54 Years | 173 (4.4%) | 246 (6.8%) |
| 55 to 64 Years | 166 (3.8%) | 211 (5.1%) |
| 65 to 74 Years | 154 (5.6%) | 153 (5.6%) |
| 75 Years and over | 73 (4.7%) | 154 (8.8%) |
| Total | 1,539 (5.4%) | 1,932 (7.2%) |
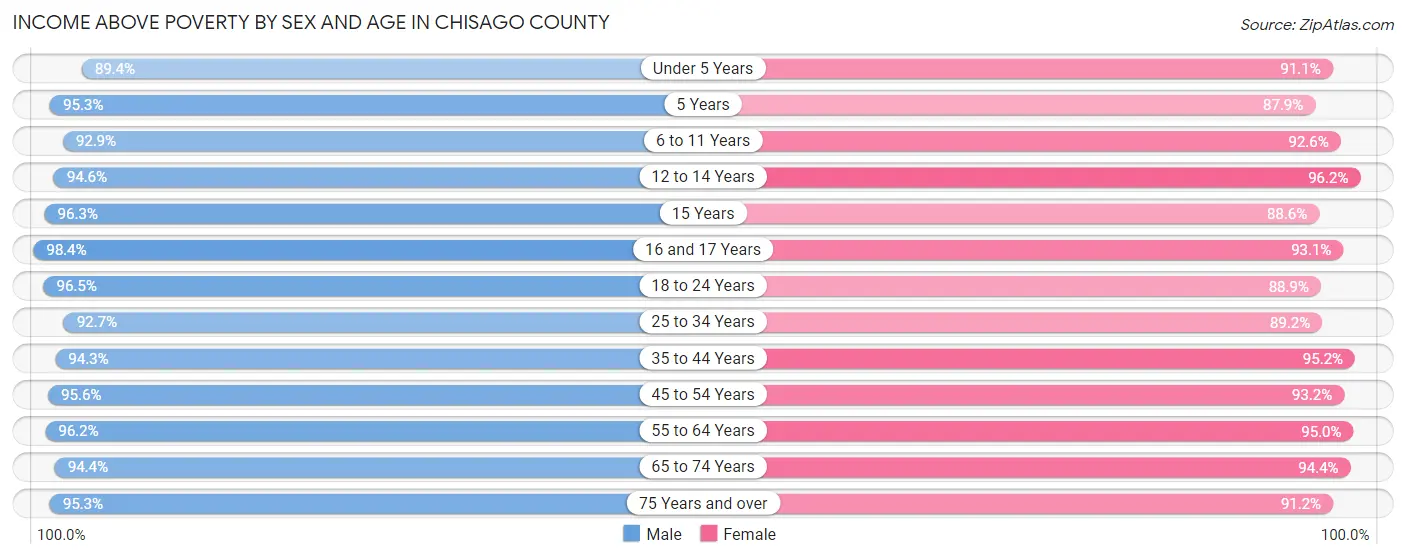
Income Above Poverty by Sex and Age in Chisago County
According to the poverty statistics in Chisago County, males aged 16 and 17 years and females aged 12 to 14 years are the age groups that are most secure financially, with 98.4% of males and 96.2% of females in these age groups living above the poverty line.
| Age Bracket | Male | Female |
| Under 5 Years | 1,431 (89.4%) | 1,389 (91.1%) |
| 5 Years | 342 (95.3%) | 188 (87.8%) |
| 6 to 11 Years | 2,077 (92.9%) | 1,831 (92.6%) |
| 12 to 14 Years | 1,045 (94.6%) | 1,196 (96.2%) |
| 15 Years | 259 (96.3%) | 225 (88.6%) |
| 16 and 17 Years | 973 (98.4%) | 778 (93.1%) |
| 18 to 24 Years | 2,159 (96.5%) | 1,800 (88.9%) |
| 25 to 34 Years | 3,112 (92.7%) | 2,727 (89.1%) |
| 35 to 44 Years | 3,599 (94.3%) | 3,355 (95.2%) |
| 45 to 54 Years | 3,773 (95.6%) | 3,381 (93.2%) |
| 55 to 64 Years | 4,151 (96.2%) | 3,970 (95.0%) |
| 65 to 74 Years | 2,592 (94.4%) | 2,578 (94.4%) |
| 75 Years and over | 1,484 (95.3%) | 1,589 (91.2%) |
| Total | 26,997 (94.6%) | 25,007 (92.8%) |
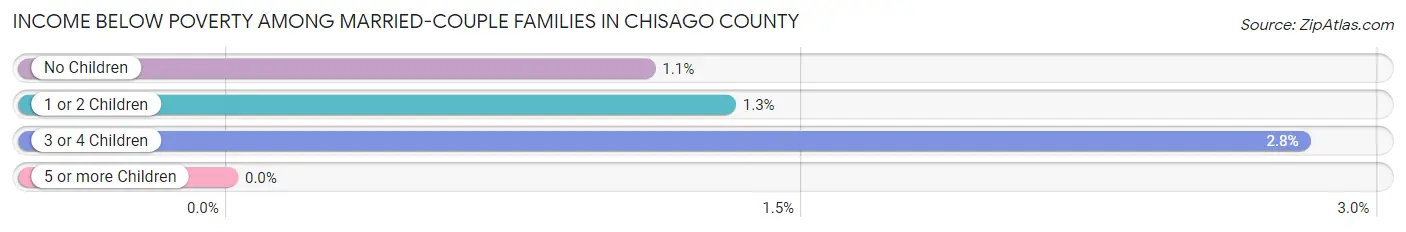
Income Below Poverty Among Married-Couple Families in Chisago County
The poverty statistics for married-couple families in Chisago County show that 1.3% or 167 of the total 12,978 families live below the poverty line. Families with 3 or 4 children have the highest poverty rate of 2.8%, comprising of 29 families. On the other hand, families with 5 or more children have the lowest poverty rate of 0.0%, which includes 0 families.
| Children | Above Poverty | Below Poverty |
| No Children | 7,699 (98.9%) | 85 (1.1%) |
| 1 or 2 Children | 4,016 (98.7%) | 53 (1.3%) |
| 3 or 4 Children | 1,006 (97.2%) | 29 (2.8%) |
| 5 or more Children | 90 (100.0%) | 0 (0.0%) |
| Total | 12,811 (98.7%) | 167 (1.3%) |
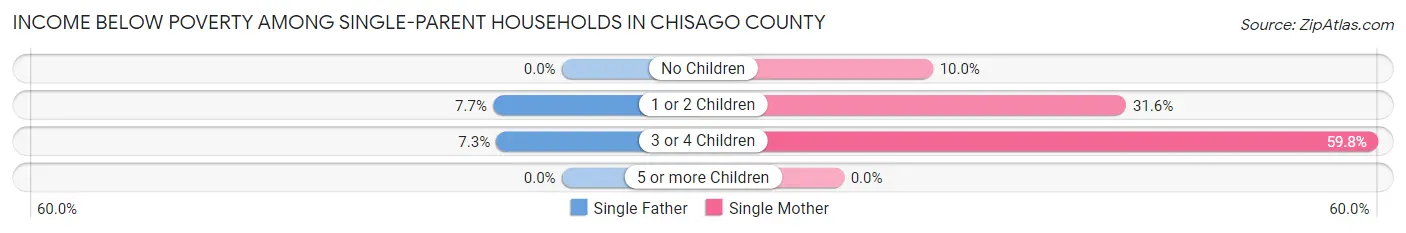
Income Below Poverty Among Single-Parent Households in Chisago County
According to the poverty data in Chisago County, 5.0% or 55 single-father households and 26.7% or 375 single-mother households are living below the poverty line. Among single-father households, those with 1 or 2 children have the highest poverty rate, with 49 households (7.7%) experiencing poverty. Likewise, among single-mother households, those with 3 or 4 children have the highest poverty rate, with 58 households (59.8%) falling below the poverty line.
| Children | Single Father | Single Mother |
| No Children | 0 (0.0%) | 44 (10.0%) |
| 1 or 2 Children | 49 (7.7%) | 273 (31.6%) |
| 3 or 4 Children | 6 (7.3%) | 58 (59.8%) |
| 5 or more Children | 0 (0.0%) | 0 (0.0%) |
| Total | 55 (5.0%) | 375 (26.7%) |
Income Below Poverty Among Married-Couple vs Single-Parent Households in Chisago County
The poverty data for Chisago County shows that 167 of the married-couple family households (1.3%) and 430 of the single-parent households (17.1%) are living below the poverty level. Within the married-couple family households, those with 3 or 4 children have the highest poverty rate, with 29 households (2.8%) falling below the poverty line. Among the single-parent households, those with 3 or 4 children have the highest poverty rate, with 64 household (35.7%) living below poverty.
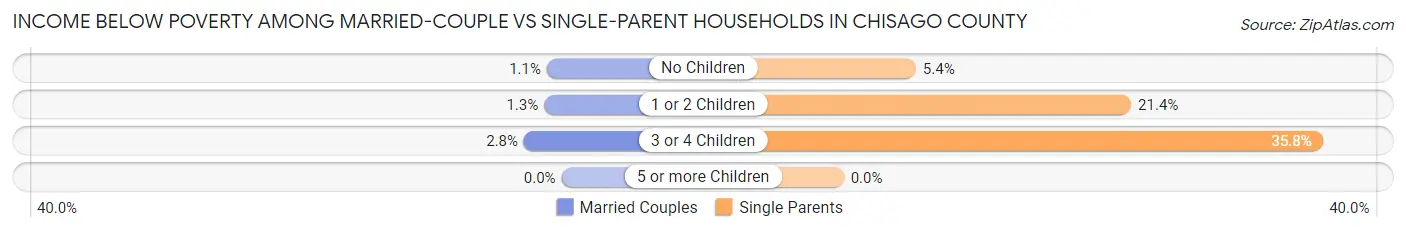
| Children | Married-Couple Families | Single-Parent Households |
| No Children | 85 (1.1%) | 44 (5.4%) |
| 1 or 2 Children | 53 (1.3%) | 322 (21.4%) |
| 3 or 4 Children | 29 (2.8%) | 64 (35.7%) |
| 5 or more Children | 0 (0.0%) | 0 (0.0%) |
| Total | 167 (1.3%) | 430 (17.1%) |
Employment Characteristics in Chisago County
Employment by Class of Employer in Chisago County
Among the 29,403 employed individuals in Chisago County, private company employees (19,989 | 68.0%), not-for-profit organizations (2,985 | 10.2%), and local government employees (2,201 | 7.5%) make up the most common classes of employment.
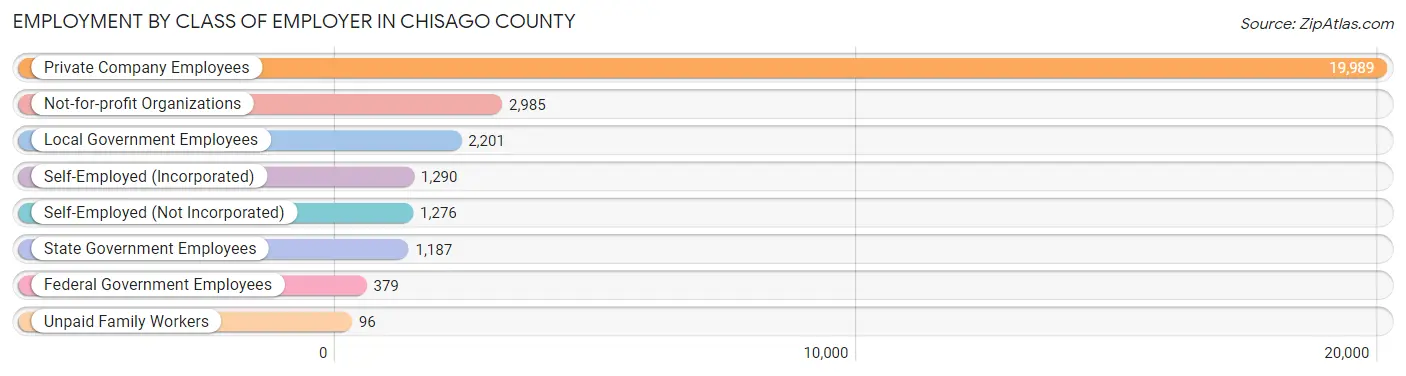
| Employer Class | # Employees | % Employees |
| Private Company Employees | 19,989 | 68.0% |
| Self-Employed (Incorporated) | 1,290 | 4.4% |
| Self-Employed (Not Incorporated) | 1,276 | 4.3% |
| Not-for-profit Organizations | 2,985 | 10.2% |
| Local Government Employees | 2,201 | 7.5% |
| State Government Employees | 1,187 | 4.0% |
| Federal Government Employees | 379 | 1.3% |
| Unpaid Family Workers | 96 | 0.3% |
| Total | 29,403 | 100.0% |
Employment Status by Age in Chisago County
According to the labor force statistics for Chisago County, out of the total population over 16 years of age (45,917), 68.1% or 31,269 individuals are in the labor force, with 3.7% or 1,157 of them unemployed. The age group with the highest labor force participation rate is 45 to 54 years, with 88.8% or 6,852 individuals in the labor force. Within the labor force, the 16 to 19 years age range has the highest percentage of unemployed individuals, with 7.2% or 110 of them being unemployed.
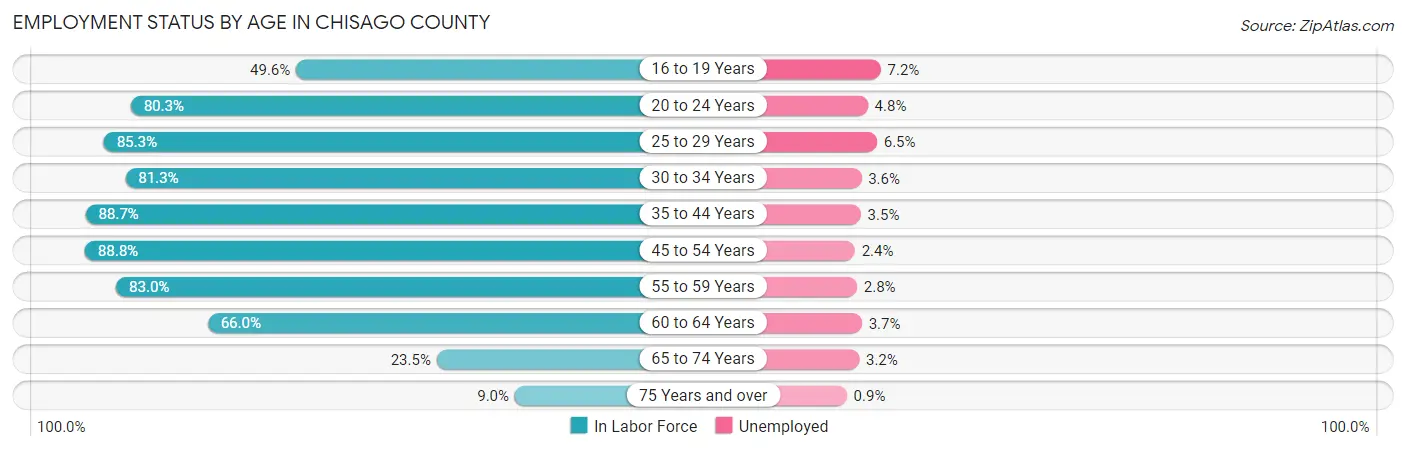
| Age Bracket | In Labor Force | Unemployed |
| 16 to 19 Years | 1,529 (49.6%) | 110 (7.2%) |
| 20 to 24 Years | 2,474 (80.3%) | 119 (4.8%) |
| 25 to 29 Years | 2,765 (85.3%) | 180 (6.5%) |
| 30 to 34 Years | 2,915 (81.3%) | 105 (3.6%) |
| 35 to 44 Years | 6,692 (88.7%) | 234 (3.5%) |
| 45 to 54 Years | 6,852 (88.8%) | 164 (2.4%) |
| 55 to 59 Years | 3,741 (83.0%) | 105 (2.8%) |
| 60 to 64 Years | 2,682 (66.0%) | 99 (3.7%) |
| 65 to 74 Years | 1,298 (23.5%) | 42 (3.2%) |
| 75 Years and over | 321 (9.0%) | 3 (0.9%) |
| Total | 31,269 (68.1%) | 1,157 (3.7%) |
Employment Status by Educational Attainment in Chisago County
According to labor force statistics for Chisago County, 83.7% of individuals (25,662) out of the total population between 25 and 64 years of age (30,660) are in the labor force, with 3.5% or 898 of them being unemployed. The group with the highest labor force participation rate are those with the educational attainment of bachelor's degree or higher, with 89.4% or 6,725 individuals in the labor force. Within the labor force, individuals with less than high school education have the highest percentage of unemployment, with 4.9% or 40 of them being unemployed.
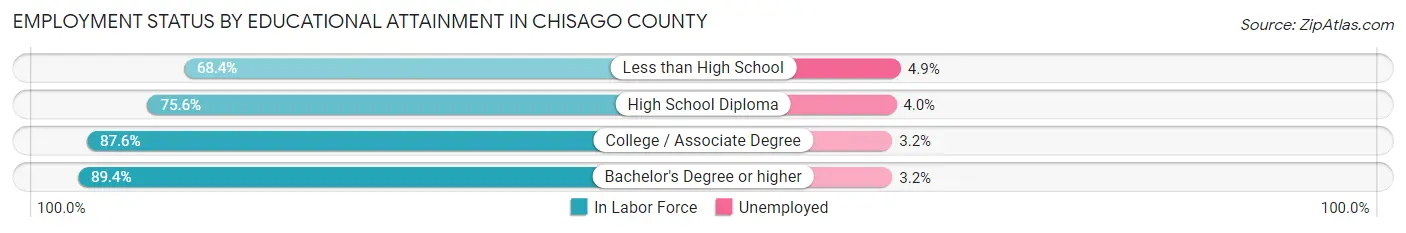
| Educational Attainment | In Labor Force | Unemployed |
| Less than High School | 824 (68.4%) | 59 (4.9%) |
| High School Diploma | 6,928 (75.6%) | 367 (4.0%) |
| College / Associate Degree | 11,187 (87.6%) | 409 (3.2%) |
| Bachelor's Degree or higher | 6,725 (89.4%) | 241 (3.2%) |
| Total | 25,662 (83.7%) | 1,073 (3.5%) |
Employment Occupations by Sex in Chisago County
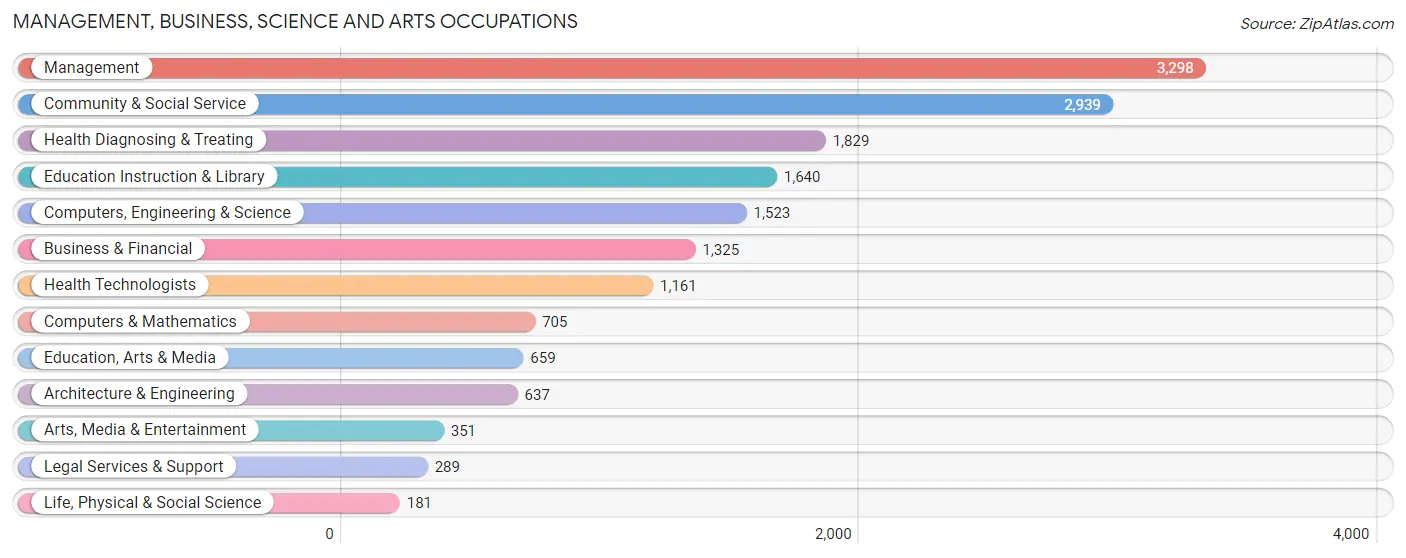
Management, Business, Science and Arts Occupations
The most common Management, Business, Science and Arts occupations in Chisago County are Management (3,298 | 11.0%), Community & Social Service (2,939 | 9.8%), Health Diagnosing & Treating (1,829 | 6.1%), Education Instruction & Library (1,640 | 5.4%), and Computers, Engineering & Science (1,523 | 5.1%).
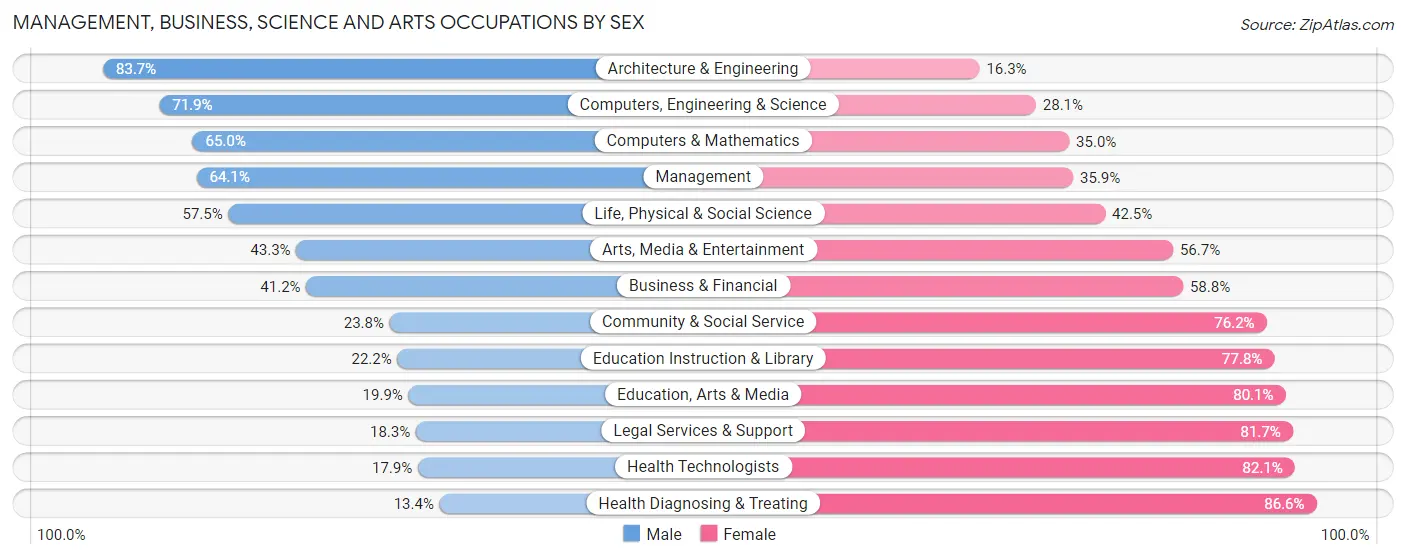
Management, Business, Science and Arts Occupations by Sex
Within the Management, Business, Science and Arts occupations in Chisago County, the most male-oriented occupations are Architecture & Engineering (83.7%), Computers, Engineering & Science (71.9%), and Computers & Mathematics (65.0%), while the most female-oriented occupations are Health Diagnosing & Treating (86.6%), Health Technologists (82.1%), and Legal Services & Support (81.7%).
| Occupation | Male | Female |
| Management | 2,115 (64.1%) | 1,183 (35.9%) |
| Business & Financial | 546 (41.2%) | 779 (58.8%) |
| Computers, Engineering & Science | 1,095 (71.9%) | 428 (28.1%) |
| Computers & Mathematics | 458 (65.0%) | 247 (35.0%) |
| Architecture & Engineering | 533 (83.7%) | 104 (16.3%) |
| Life, Physical & Social Science | 104 (57.5%) | 77 (42.5%) |
| Community & Social Service | 700 (23.8%) | 2,239 (76.2%) |
| Education, Arts & Media | 131 (19.9%) | 528 (80.1%) |
| Legal Services & Support | 53 (18.3%) | 236 (81.7%) |
| Education Instruction & Library | 364 (22.2%) | 1,276 (77.8%) |
| Arts, Media & Entertainment | 152 (43.3%) | 199 (56.7%) |
| Health Diagnosing & Treating | 245 (13.4%) | 1,584 (86.6%) |
| Health Technologists | 208 (17.9%) | 953 (82.1%) |
| Total (Category) | 4,701 (43.1%) | 6,213 (56.9%) |
| Total (Overall) | 16,204 (53.8%) | 13,888 (46.2%) |
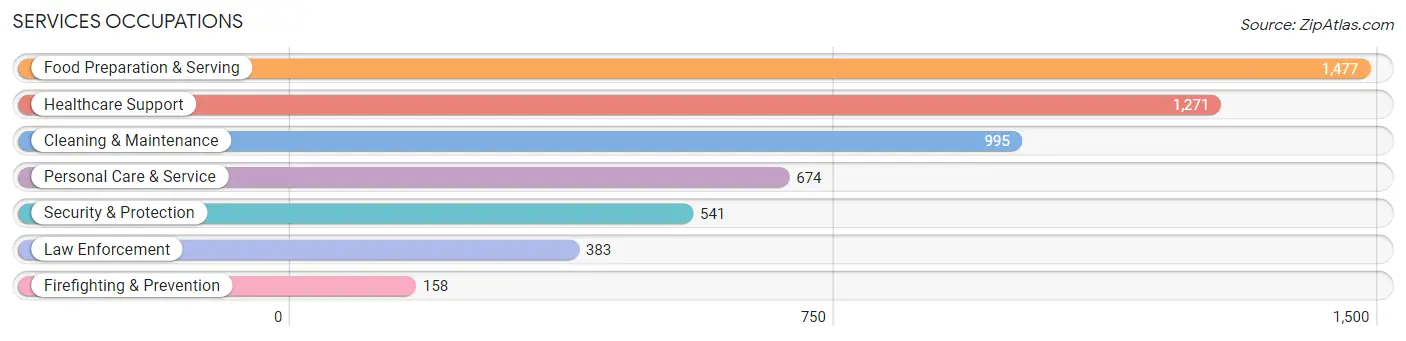
Services Occupations
The most common Services occupations in Chisago County are Food Preparation & Serving (1,477 | 4.9%), Healthcare Support (1,271 | 4.2%), Cleaning & Maintenance (995 | 3.3%), Personal Care & Service (674 | 2.2%), and Security & Protection (541 | 1.8%).
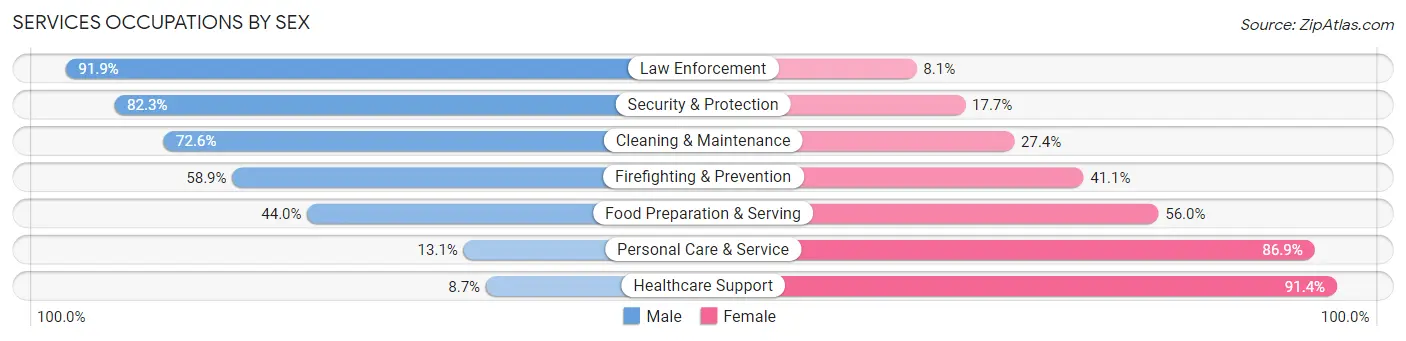
Services Occupations by Sex
Within the Services occupations in Chisago County, the most male-oriented occupations are Law Enforcement (91.9%), Security & Protection (82.3%), and Cleaning & Maintenance (72.6%), while the most female-oriented occupations are Healthcare Support (91.3%), Personal Care & Service (86.9%), and Food Preparation & Serving (56.0%).
| Occupation | Male | Female |
| Healthcare Support | 110 (8.6%) | 1,161 (91.3%) |
| Security & Protection | 445 (82.3%) | 96 (17.7%) |
| Firefighting & Prevention | 93 (58.9%) | 65 (41.1%) |
| Law Enforcement | 352 (91.9%) | 31 (8.1%) |
| Food Preparation & Serving | 650 (44.0%) | 827 (56.0%) |
| Cleaning & Maintenance | 722 (72.6%) | 273 (27.4%) |
| Personal Care & Service | 88 (13.1%) | 586 (86.9%) |
| Total (Category) | 2,015 (40.6%) | 2,943 (59.4%) |
| Total (Overall) | 16,204 (53.8%) | 13,888 (46.2%) |
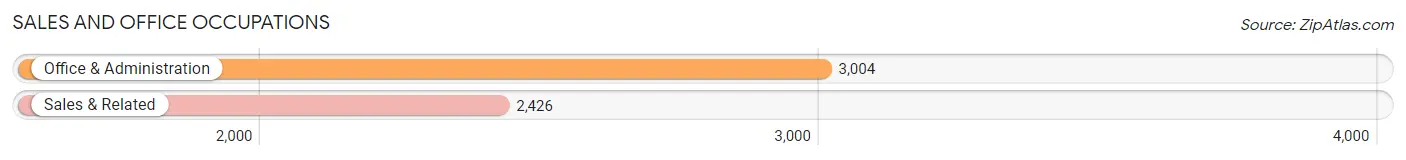
Sales and Office Occupations
The most common Sales and Office occupations in Chisago County are Office & Administration (3,004 | 10.0%), and Sales & Related (2,426 | 8.1%).
Sales and Office Occupations by Sex
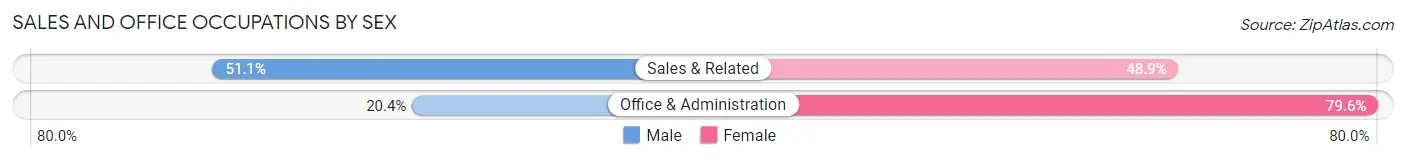
| Occupation | Male | Female |
| Sales & Related | 1,239 (51.1%) | 1,187 (48.9%) |
| Office & Administration | 612 (20.4%) | 2,392 (79.6%) |
| Total (Category) | 1,851 (34.1%) | 3,579 (65.9%) |
| Total (Overall) | 16,204 (53.8%) | 13,888 (46.2%) |
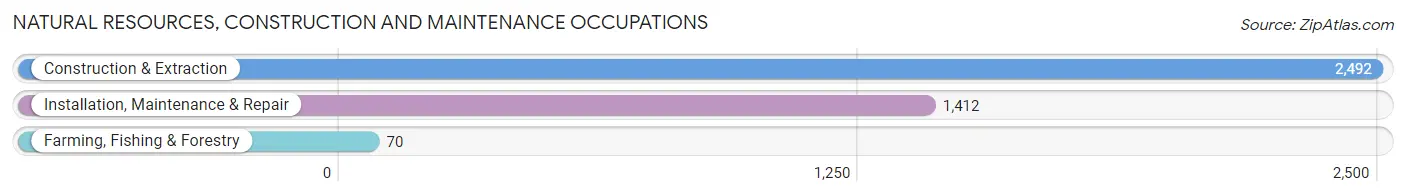
Natural Resources, Construction and Maintenance Occupations
The most common Natural Resources, Construction and Maintenance occupations in Chisago County are Construction & Extraction (2,492 | 8.3%), Installation, Maintenance & Repair (1,412 | 4.7%), and Farming, Fishing & Forestry (70 | 0.2%).
Natural Resources, Construction and Maintenance Occupations by Sex
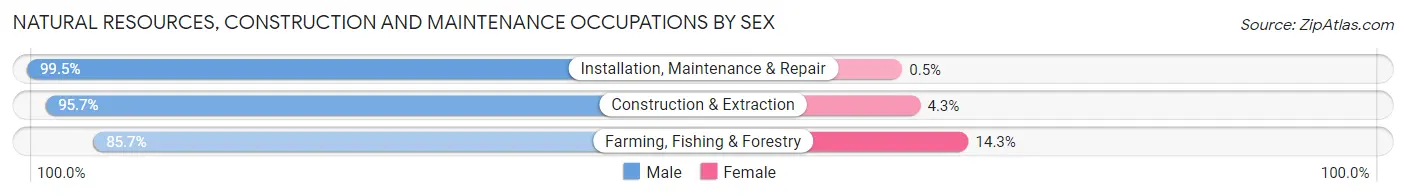
| Occupation | Male | Female |
| Farming, Fishing & Forestry | 60 (85.7%) | 10 (14.3%) |
| Construction & Extraction | 2,385 (95.7%) | 107 (4.3%) |
| Installation, Maintenance & Repair | 1,405 (99.5%) | 7 (0.5%) |
| Total (Category) | 3,850 (96.9%) | 124 (3.1%) |
| Total (Overall) | 16,204 (53.8%) | 13,888 (46.2%) |
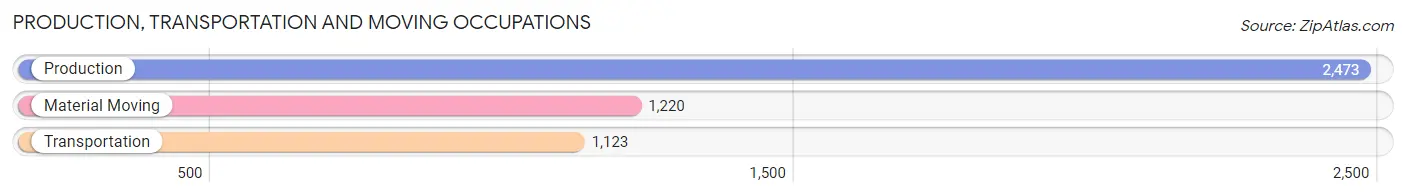
Production, Transportation and Moving Occupations
The most common Production, Transportation and Moving occupations in Chisago County are Production (2,473 | 8.2%), Material Moving (1,220 | 4.1%), and Transportation (1,123 | 3.7%).
Production, Transportation and Moving Occupations by Sex
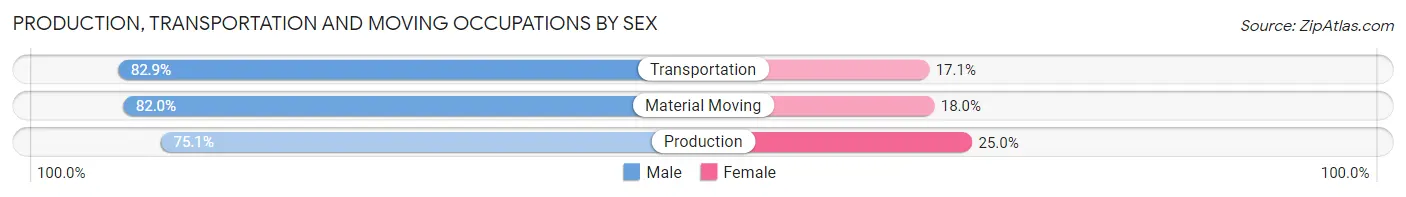
| Occupation | Male | Female |
| Production | 1,856 (75.0%) | 617 (24.9%) |
| Transportation | 931 (82.9%) | 192 (17.1%) |
| Material Moving | 1,000 (82.0%) | 220 (18.0%) |
| Total (Category) | 3,787 (78.6%) | 1,029 (21.4%) |
| Total (Overall) | 16,204 (53.8%) | 13,888 (46.2%) |
Employment Industries by Sex in Chisago County
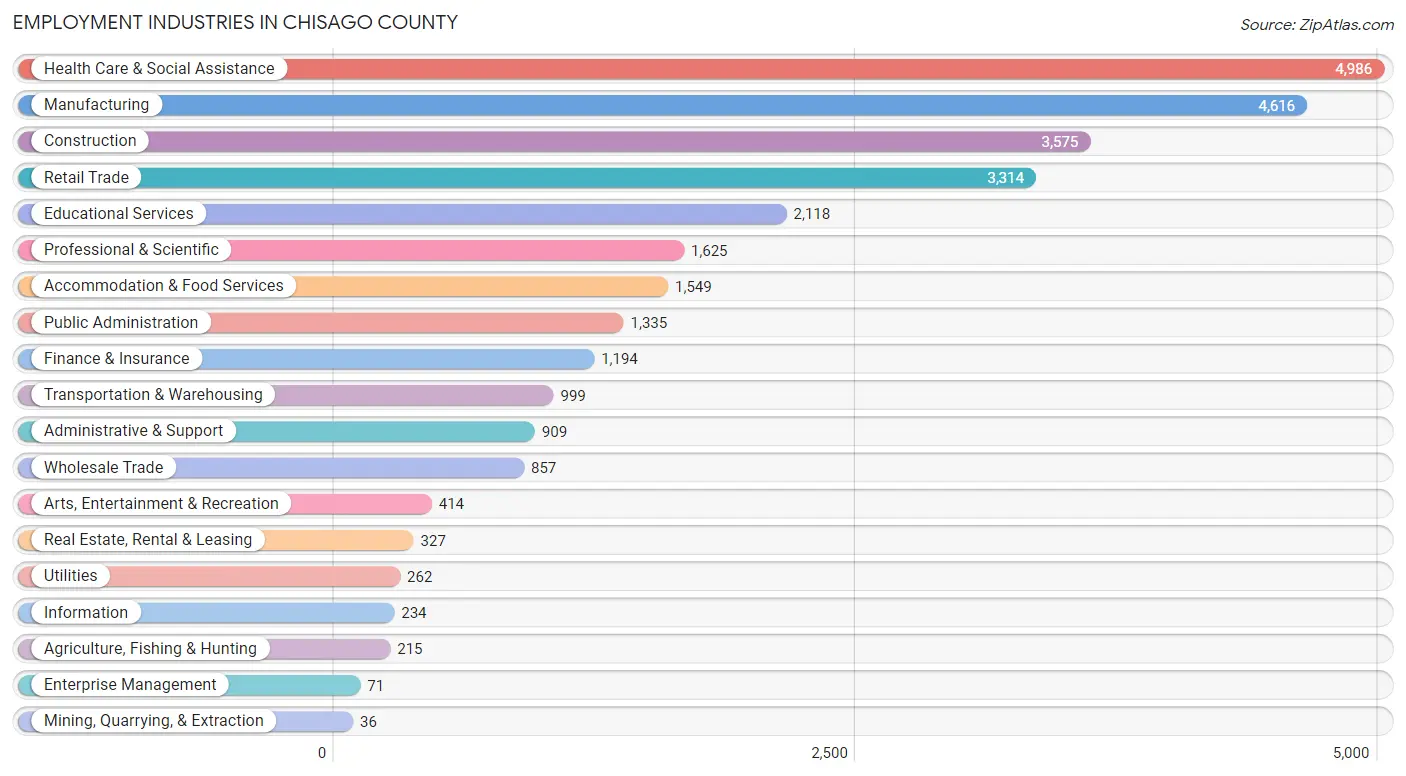
Employment Industries in Chisago County
The major employment industries in Chisago County include Health Care & Social Assistance (4,986 | 16.6%), Manufacturing (4,616 | 15.3%), Construction (3,575 | 11.9%), Retail Trade (3,314 | 11.0%), and Educational Services (2,118 | 7.0%).
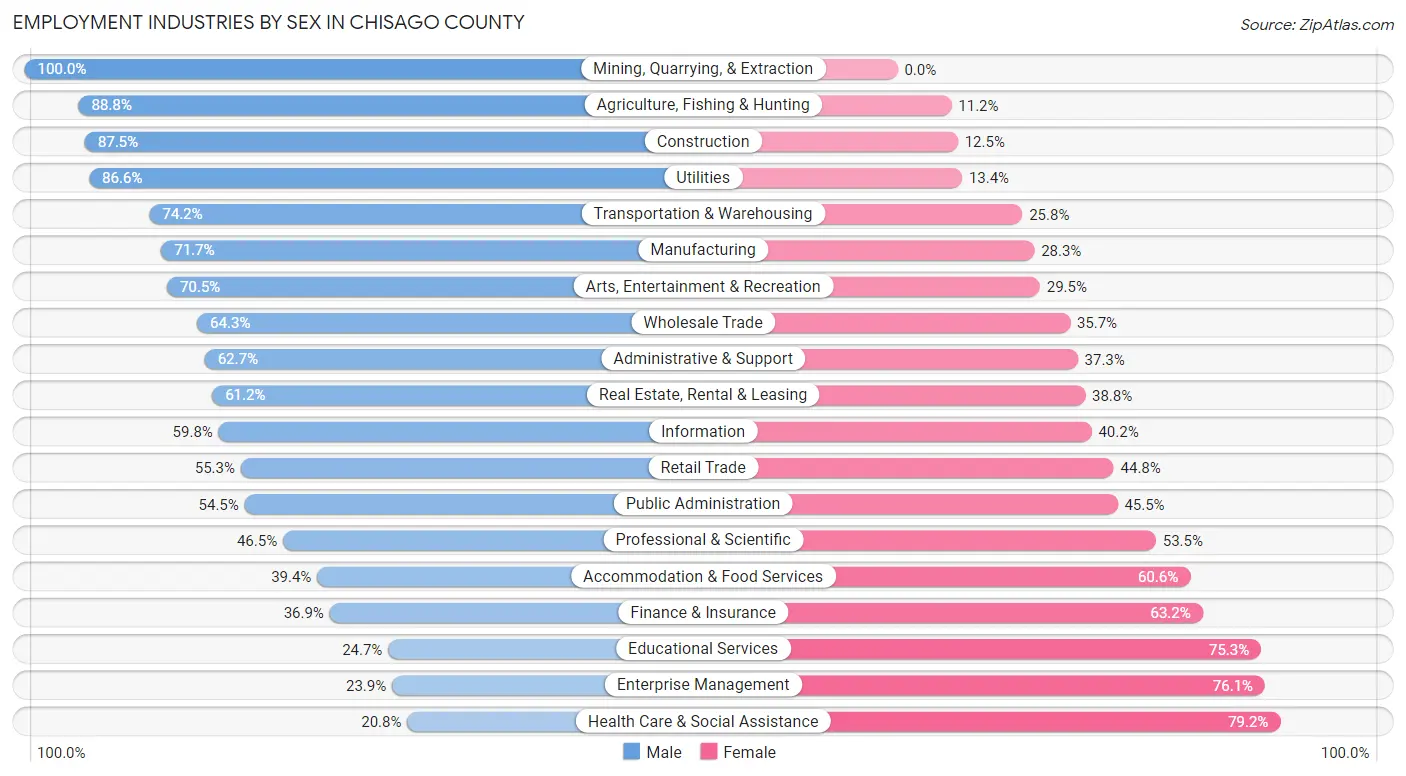
Employment Industries by Sex in Chisago County
The Chisago County industries that see more men than women are Mining, Quarrying, & Extraction (100.0%), Agriculture, Fishing & Hunting (88.8%), and Construction (87.5%), whereas the industries that tend to have a higher number of women are Health Care & Social Assistance (79.2%), Enterprise Management (76.1%), and Educational Services (75.3%).
| Industry | Male | Female |
| Agriculture, Fishing & Hunting | 191 (88.8%) | 24 (11.2%) |
| Mining, Quarrying, & Extraction | 36 (100.0%) | 0 (0.0%) |
| Construction | 3,129 (87.5%) | 446 (12.5%) |
| Manufacturing | 3,309 (71.7%) | 1,307 (28.3%) |
| Wholesale Trade | 551 (64.3%) | 306 (35.7%) |
| Retail Trade | 1,831 (55.2%) | 1,483 (44.8%) |
| Transportation & Warehousing | 741 (74.2%) | 258 (25.8%) |
| Utilities | 227 (86.6%) | 35 (13.4%) |
| Information | 140 (59.8%) | 94 (40.2%) |
| Finance & Insurance | 440 (36.8%) | 754 (63.1%) |
| Real Estate, Rental & Leasing | 200 (61.2%) | 127 (38.8%) |
| Professional & Scientific | 756 (46.5%) | 869 (53.5%) |
| Enterprise Management | 17 (23.9%) | 54 (76.1%) |
| Administrative & Support | 570 (62.7%) | 339 (37.3%) |
| Educational Services | 524 (24.7%) | 1,594 (75.3%) |
| Health Care & Social Assistance | 1,036 (20.8%) | 3,950 (79.2%) |
| Arts, Entertainment & Recreation | 292 (70.5%) | 122 (29.5%) |
| Accommodation & Food Services | 611 (39.4%) | 938 (60.6%) |
| Public Administration | 727 (54.5%) | 608 (45.5%) |
| Total | 16,204 (53.8%) | 13,888 (46.2%) |
Education in Chisago County
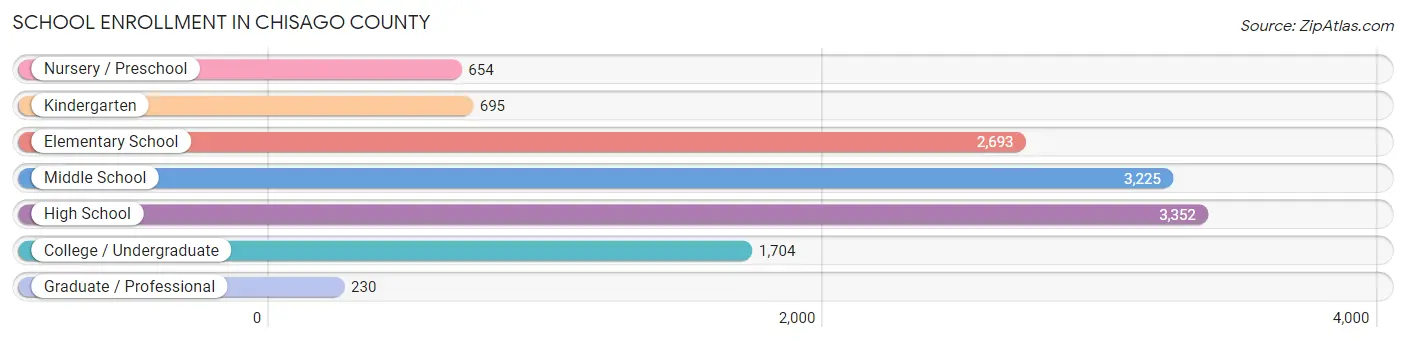
School Enrollment in Chisago County
The most common levels of schooling among the 12,553 students in Chisago County are high school (3,352 | 26.7%), middle school (3,225 | 25.7%), and elementary school (2,693 | 21.4%).
| School Level | # Students | % Students |
| Nursery / Preschool | 654 | 5.2% |
| Kindergarten | 695 | 5.5% |
| Elementary School | 2,693 | 21.4% |
| Middle School | 3,225 | 25.7% |
| High School | 3,352 | 26.7% |
| College / Undergraduate | 1,704 | 13.6% |
| Graduate / Professional | 230 | 1.8% |
| Total | 12,553 | 100.0% |
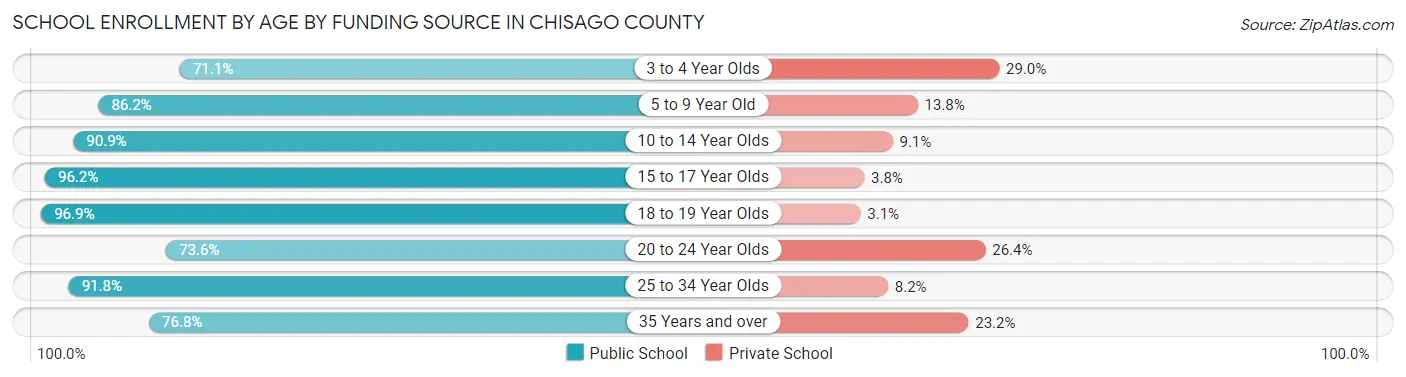
School Enrollment by Age by Funding Source in Chisago County
Out of a total of 12,553 students who are enrolled in schools in Chisago County, 1,418 (11.3%) attend a private institution, while the remaining 11,135 (88.7%) are enrolled in public schools. The age group of 3 to 4 year olds has the highest likelihood of being enrolled in private schools, with 132 (28.9% in the age bracket) enrolled. Conversely, the age group of 18 to 19 year olds has the lowest likelihood of being enrolled in a private school, with 845 (96.9% in the age bracket) attending a public institution.
| Age Bracket | Public School | Private School |
| 3 to 4 Year Olds | 324 (71.1%) | 132 (28.9%) |
| 5 to 9 Year Old | 2,689 (86.2%) | 429 (13.8%) |
| 10 to 14 Year Olds | 3,654 (90.9%) | 366 (9.1%) |
| 15 to 17 Year Olds | 2,247 (96.2%) | 89 (3.8%) |
| 18 to 19 Year Olds | 845 (96.9%) | 27 (3.1%) |
| 20 to 24 Year Olds | 572 (73.6%) | 205 (26.4%) |
| 25 to 34 Year Olds | 368 (91.8%) | 33 (8.2%) |
| 35 Years and over | 440 (76.8%) | 133 (23.2%) |
| Total | 11,135 (88.7%) | 1,418 (11.3%) |
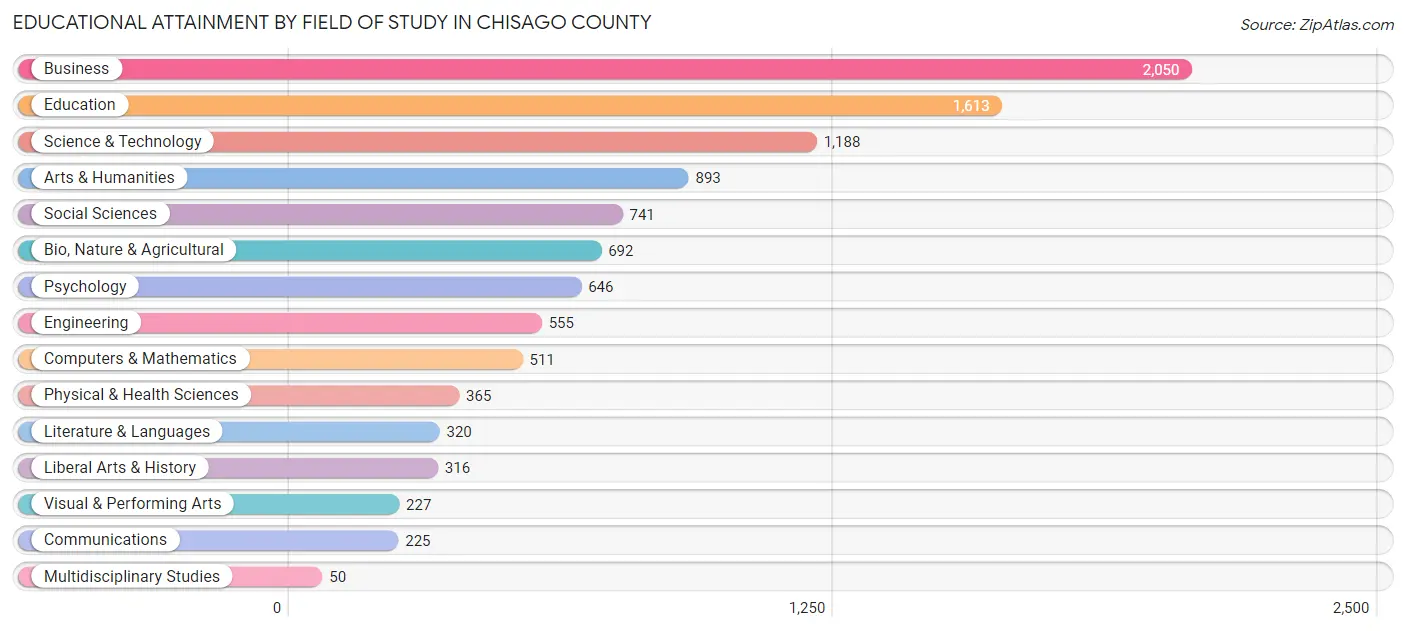
Educational Attainment by Field of Study in Chisago County
Business (2,050 | 19.7%), education (1,613 | 15.5%), science & technology (1,188 | 11.4%), arts & humanities (893 | 8.6%), and social sciences (741 | 7.1%) are the most common fields of study among 10,392 individuals in Chisago County who have obtained a bachelor's degree or higher.
| Field of Study | # Graduates | % Graduates |
| Computers & Mathematics | 511 | 4.9% |
| Bio, Nature & Agricultural | 692 | 6.7% |
| Physical & Health Sciences | 365 | 3.5% |
| Psychology | 646 | 6.2% |
| Social Sciences | 741 | 7.1% |
| Engineering | 555 | 5.3% |
| Multidisciplinary Studies | 50 | 0.5% |
| Science & Technology | 1,188 | 11.4% |
| Business | 2,050 | 19.7% |
| Education | 1,613 | 15.5% |
| Literature & Languages | 320 | 3.1% |
| Liberal Arts & History | 316 | 3.0% |
| Visual & Performing Arts | 227 | 2.2% |
| Communications | 225 | 2.2% |
| Arts & Humanities | 893 | 8.6% |
| Total | 10,392 | 100.0% |
Transportation & Commute in Chisago County
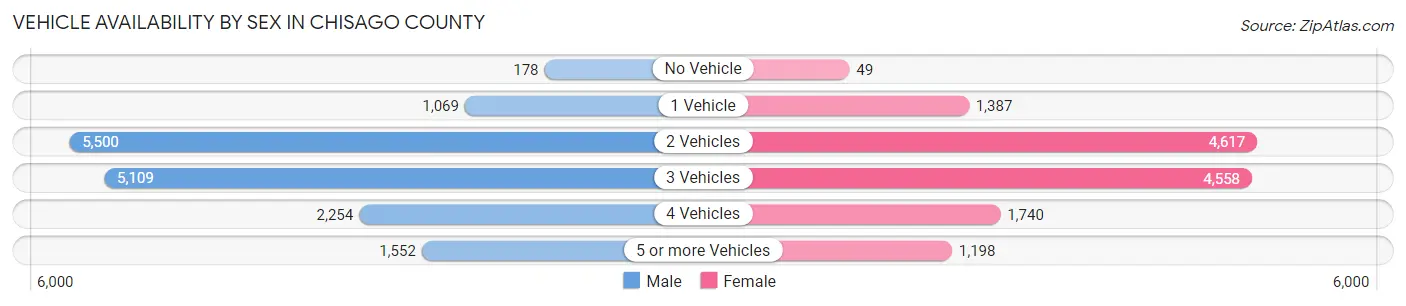
Vehicle Availability by Sex in Chisago County
The most prevalent vehicle ownership categories in Chisago County are males with 2 vehicles (5,500, accounting for 35.1%) and females with 2 vehicles (4,617, making up 40.6%).
| Vehicles Available | Male | Female |
| No Vehicle | 178 (1.1%) | 49 (0.4%) |
| 1 Vehicle | 1,069 (6.8%) | 1,387 (10.2%) |
| 2 Vehicles | 5,500 (35.1%) | 4,617 (34.1%) |
| 3 Vehicles | 5,109 (32.6%) | 4,558 (33.6%) |
| 4 Vehicles | 2,254 (14.4%) | 1,740 (12.8%) |
| 5 or more Vehicles | 1,552 (9.9%) | 1,198 (8.8%) |
| Total | 15,662 (100.0%) | 13,549 (100.0%) |
Commute Time in Chisago County
The most frequently occuring commute durations in Chisago County are 45 to 59 minutes (4,316 commuters, 16.5%), 60 to 89 minutes (3,022 commuters, 11.5%), and 20 to 24 minutes (2,909 commuters, 11.1%).
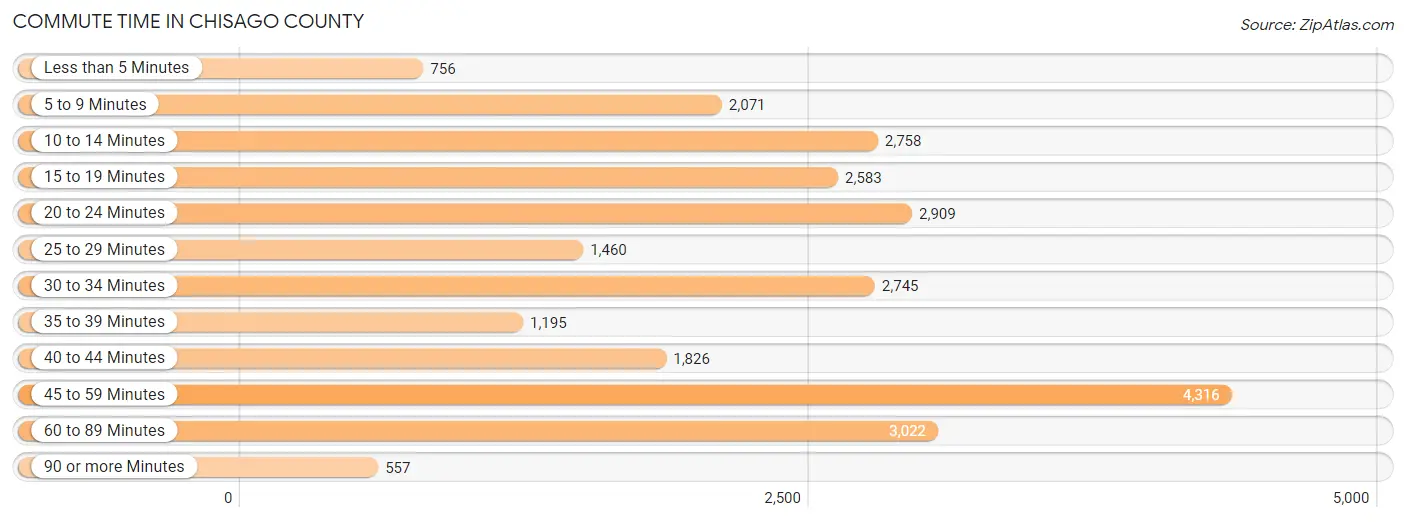
| Commute Time | # Commuters | % Commuters |
| Less than 5 Minutes | 756 | 2.9% |
| 5 to 9 Minutes | 2,071 | 7.9% |
| 10 to 14 Minutes | 2,758 | 10.5% |
| 15 to 19 Minutes | 2,583 | 9.9% |
| 20 to 24 Minutes | 2,909 | 11.1% |
| 25 to 29 Minutes | 1,460 | 5.6% |
| 30 to 34 Minutes | 2,745 | 10.5% |
| 35 to 39 Minutes | 1,195 | 4.6% |
| 40 to 44 Minutes | 1,826 | 7.0% |
| 45 to 59 Minutes | 4,316 | 16.5% |
| 60 to 89 Minutes | 3,022 | 11.5% |
| 90 or more Minutes | 557 | 2.1% |
Commute Time by Sex in Chisago County
The most common commute times in Chisago County are 45 to 59 minutes (2,792 commuters, 19.4%) for males and 20 to 24 minutes (1,763 commuters, 15.0%) for females.
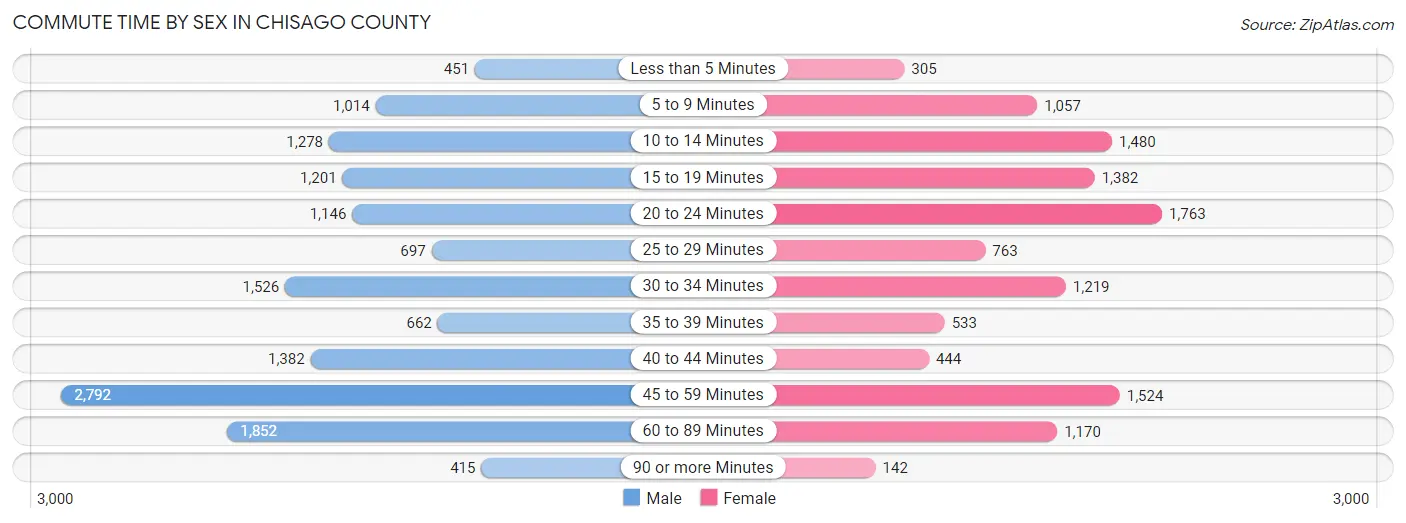
| Commute Time | Male | Female |
| Less than 5 Minutes | 451 (3.1%) | 305 (2.6%) |
| 5 to 9 Minutes | 1,014 (7.0%) | 1,057 (9.0%) |
| 10 to 14 Minutes | 1,278 (8.9%) | 1,480 (12.6%) |
| 15 to 19 Minutes | 1,201 (8.3%) | 1,382 (11.7%) |
| 20 to 24 Minutes | 1,146 (8.0%) | 1,763 (15.0%) |
| 25 to 29 Minutes | 697 (4.8%) | 763 (6.5%) |
| 30 to 34 Minutes | 1,526 (10.6%) | 1,219 (10.3%) |
| 35 to 39 Minutes | 662 (4.6%) | 533 (4.5%) |
| 40 to 44 Minutes | 1,382 (9.6%) | 444 (3.8%) |
| 45 to 59 Minutes | 2,792 (19.4%) | 1,524 (12.9%) |
| 60 to 89 Minutes | 1,852 (12.9%) | 1,170 (9.9%) |
| 90 or more Minutes | 415 (2.9%) | 142 (1.2%) |
Time of Departure to Work by Sex in Chisago County
The most frequent times of departure to work in Chisago County are 6:00 AM to 6:29 AM (1,885, 13.1%) for males and 7:00 AM to 7:29 AM (2,124, 18.0%) for females.
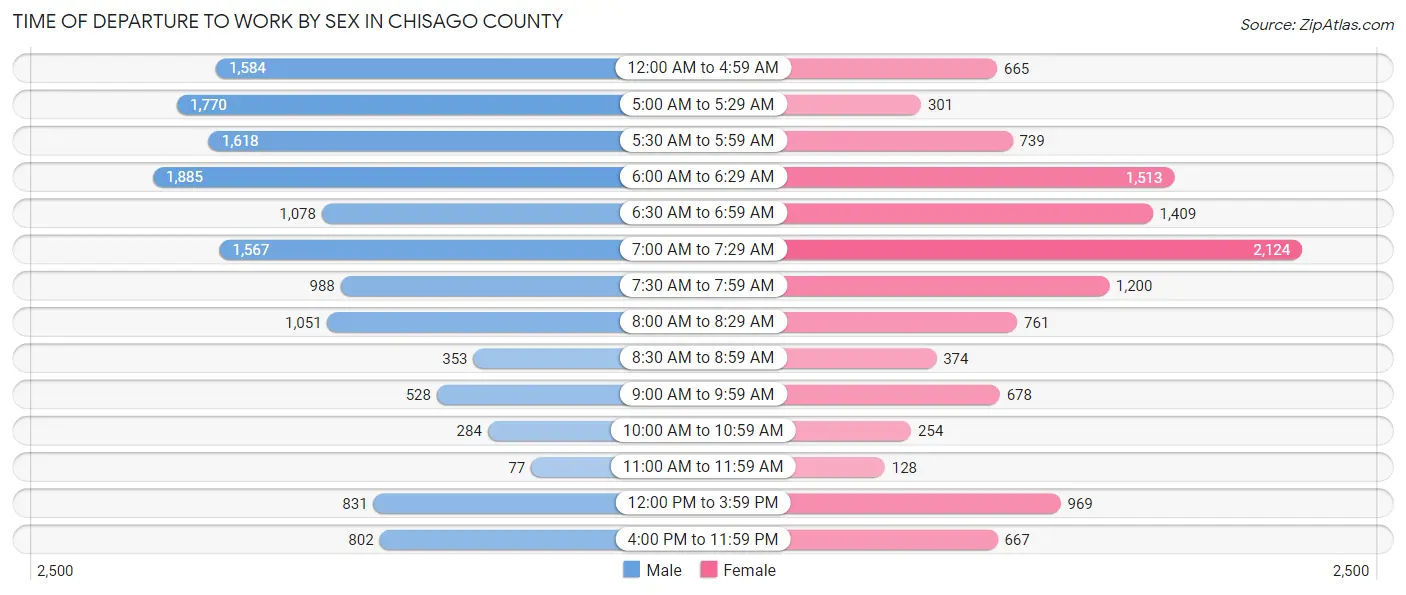
| Time of Departure | Male | Female |
| 12:00 AM to 4:59 AM | 1,584 (11.0%) | 665 (5.6%) |
| 5:00 AM to 5:29 AM | 1,770 (12.3%) | 301 (2.5%) |
| 5:30 AM to 5:59 AM | 1,618 (11.2%) | 739 (6.3%) |
| 6:00 AM to 6:29 AM | 1,885 (13.1%) | 1,513 (12.8%) |
| 6:30 AM to 6:59 AM | 1,078 (7.5%) | 1,409 (12.0%) |
| 7:00 AM to 7:29 AM | 1,567 (10.9%) | 2,124 (18.0%) |
| 7:30 AM to 7:59 AM | 988 (6.9%) | 1,200 (10.2%) |
| 8:00 AM to 8:29 AM | 1,051 (7.3%) | 761 (6.5%) |
| 8:30 AM to 8:59 AM | 353 (2.5%) | 374 (3.2%) |
| 9:00 AM to 9:59 AM | 528 (3.7%) | 678 (5.8%) |
| 10:00 AM to 10:59 AM | 284 (2.0%) | 254 (2.2%) |
| 11:00 AM to 11:59 AM | 77 (0.5%) | 128 (1.1%) |
| 12:00 PM to 3:59 PM | 831 (5.8%) | 969 (8.2%) |
| 4:00 PM to 11:59 PM | 802 (5.6%) | 667 (5.7%) |
| Total | 14,416 (100.0%) | 11,782 (100.0%) |
Housing Occupancy in Chisago County
Occupancy by Ownership in Chisago County
Of the total 20,911 dwellings in Chisago County, owner-occupied units account for 18,085 (86.5%), while renter-occupied units make up 2,826 (13.5%).
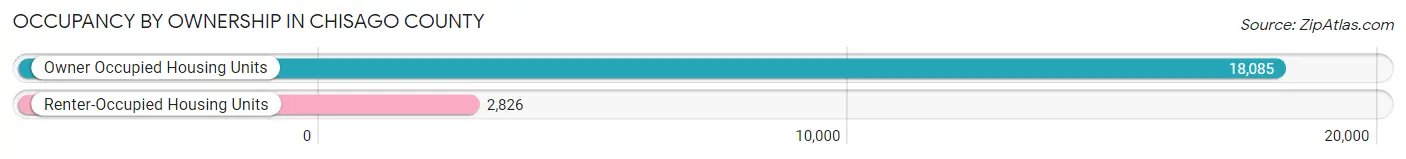
| Occupancy | # Housing Units | % Housing Units |
| Owner Occupied Housing Units | 18,085 | 86.5% |
| Renter-Occupied Housing Units | 2,826 | 13.5% |
| Total Occupied Housing Units | 20,911 | 100.0% |
Occupancy by Household Size in Chisago County
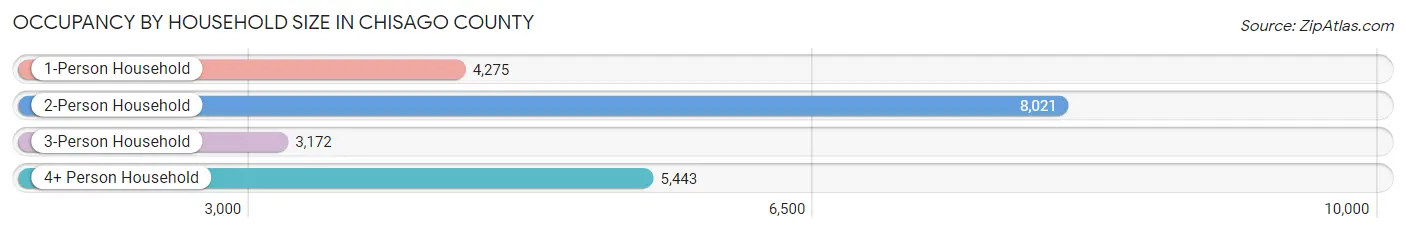
| Household Size | # Housing Units | % Housing Units |
| 1-Person Household | 4,275 | 20.4% |
| 2-Person Household | 8,021 | 38.4% |
| 3-Person Household | 3,172 | 15.2% |
| 4+ Person Household | 5,443 | 26.0% |
| Total Housing Units | 20,911 | 100.0% |
Occupancy by Ownership by Household Size in Chisago County
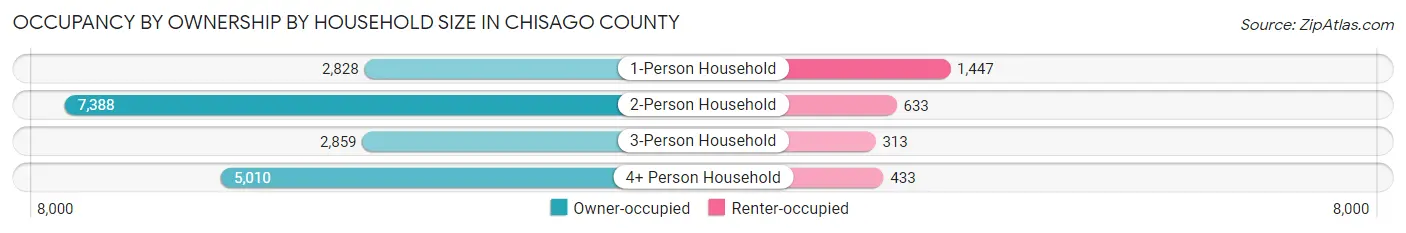
| Household Size | Owner-occupied | Renter-occupied |
| 1-Person Household | 2,828 (66.1%) | 1,447 (33.9%) |
| 2-Person Household | 7,388 (92.1%) | 633 (7.9%) |
| 3-Person Household | 2,859 (90.1%) | 313 (9.9%) |
| 4+ Person Household | 5,010 (92.0%) | 433 (8.0%) |
| Total Housing Units | 18,085 (86.5%) | 2,826 (13.5%) |
Occupancy by Educational Attainment in Chisago County
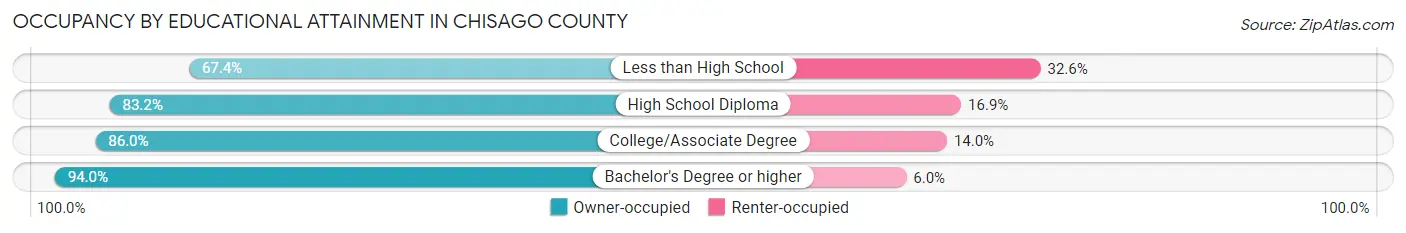
| Household Size | Owner-occupied | Renter-occupied |
| Less than High School | 511 (67.4%) | 247 (32.6%) |
| High School Diploma | 4,931 (83.2%) | 999 (16.9%) |
| College/Associate Degree | 7,791 (86.0%) | 1,271 (14.0%) |
| Bachelor's Degree or higher | 4,852 (94.0%) | 309 (6.0%) |
Occupancy by Age of Householder in Chisago County
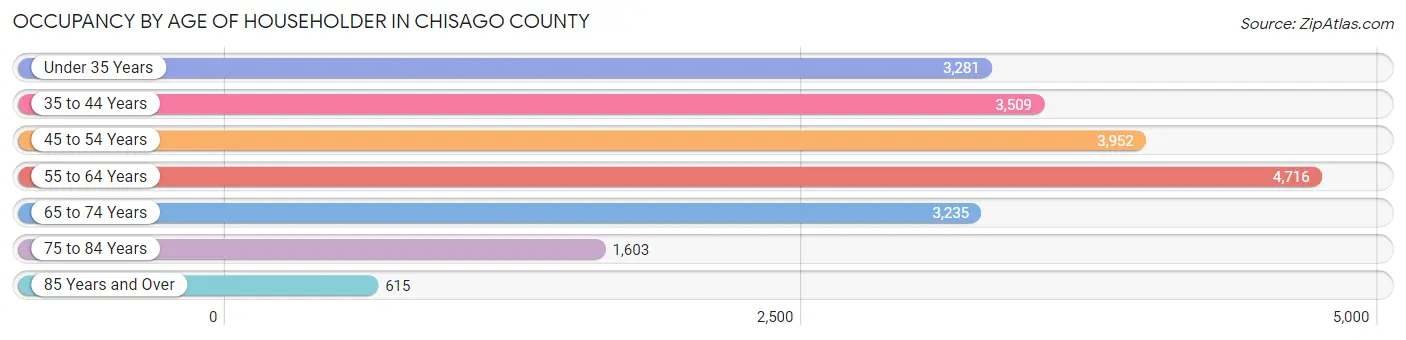
| Age Bracket | # Households | % Households |
| Under 35 Years | 3,281 | 15.7% |
| 35 to 44 Years | 3,509 | 16.8% |
| 45 to 54 Years | 3,952 | 18.9% |
| 55 to 64 Years | 4,716 | 22.6% |
| 65 to 74 Years | 3,235 | 15.5% |
| 75 to 84 Years | 1,603 | 7.7% |
| 85 Years and Over | 615 | 2.9% |
| Total | 20,911 | 100.0% |
Housing Finances in Chisago County
Median Income by Occupancy in Chisago County
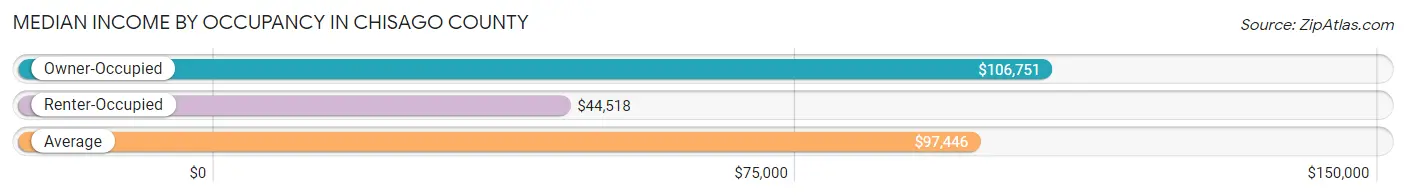
| Occupancy Type | # Households | Median Income |
| Owner-Occupied | 18,085 (86.5%) | $106,751 |
| Renter-Occupied | 2,826 (13.5%) | $44,518 |
| Average | 20,911 (100.0%) | $97,446 |
Occupancy by Householder Income Bracket in Chisago County
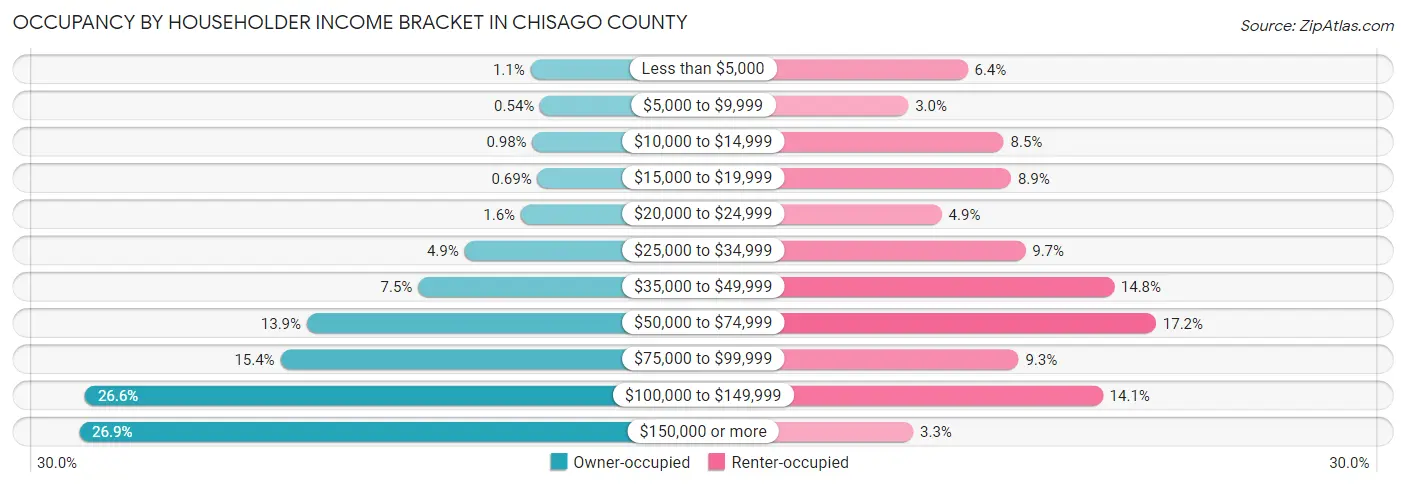
| Income Bracket | Owner-occupied | Renter-occupied |
| Less than $5,000 | 198 (1.1%) | 181 (6.4%) |
| $5,000 to $9,999 | 98 (0.5%) | 85 (3.0%) |
| $10,000 to $14,999 | 178 (1.0%) | 239 (8.5%) |
| $15,000 to $19,999 | 124 (0.7%) | 251 (8.9%) |
| $20,000 to $24,999 | 297 (1.6%) | 139 (4.9%) |
| $25,000 to $34,999 | 879 (4.9%) | 274 (9.7%) |
| $35,000 to $49,999 | 1,359 (7.5%) | 417 (14.8%) |
| $50,000 to $74,999 | 2,509 (13.9%) | 485 (17.2%) |
| $75,000 to $99,999 | 2,781 (15.4%) | 263 (9.3%) |
| $100,000 to $149,999 | 4,801 (26.6%) | 399 (14.1%) |
| $150,000 or more | 4,861 (26.9%) | 93 (3.3%) |
| Total | 18,085 (100.0%) | 2,826 (100.0%) |
Monthly Housing Cost Tiers in Chisago County
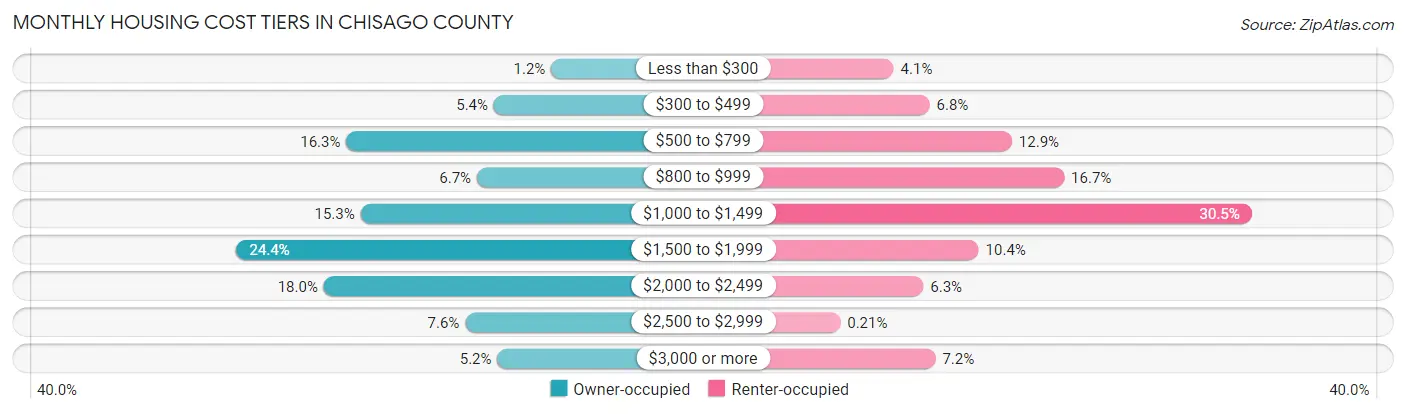
| Monthly Cost | Owner-occupied | Renter-occupied |
| Less than $300 | 220 (1.2%) | 117 (4.1%) |
| $300 to $499 | 984 (5.4%) | 192 (6.8%) |
| $500 to $799 | 2,950 (16.3%) | 363 (12.9%) |
| $800 to $999 | 1,209 (6.7%) | 472 (16.7%) |
| $1,000 to $1,499 | 2,759 (15.3%) | 862 (30.5%) |
| $1,500 to $1,999 | 4,412 (24.4%) | 294 (10.4%) |
| $2,000 to $2,499 | 3,250 (18.0%) | 179 (6.3%) |
| $2,500 to $2,999 | 1,365 (7.5%) | 6 (0.2%) |
| $3,000 or more | 936 (5.2%) | 204 (7.2%) |
| Total | 18,085 (100.0%) | 2,826 (100.0%) |
Physical Housing Characteristics in Chisago County
Housing Structures in Chisago County
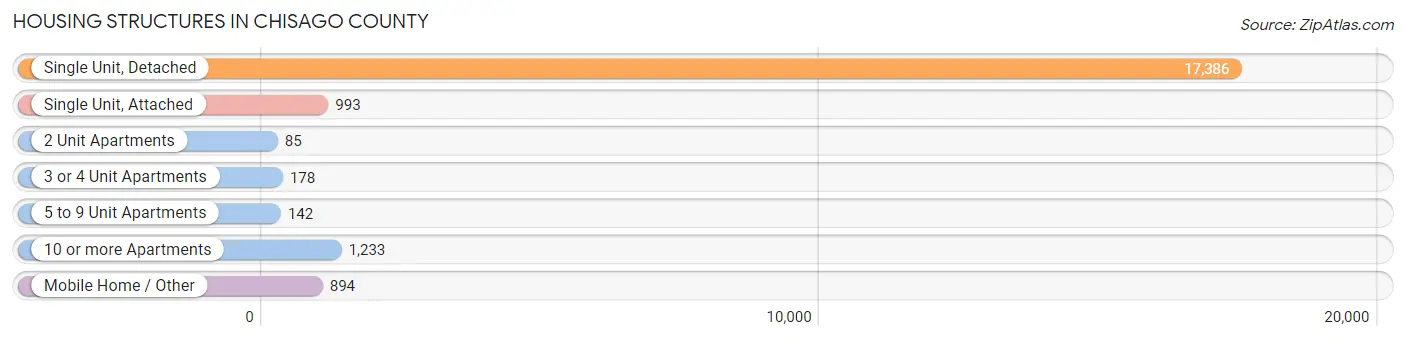
| Structure Type | # Housing Units | % Housing Units |
| Single Unit, Detached | 17,386 | 83.1% |
| Single Unit, Attached | 993 | 4.8% |
| 2 Unit Apartments | 85 | 0.4% |
| 3 or 4 Unit Apartments | 178 | 0.9% |
| 5 to 9 Unit Apartments | 142 | 0.7% |
| 10 or more Apartments | 1,233 | 5.9% |
| Mobile Home / Other | 894 | 4.3% |
| Total | 20,911 | 100.0% |
Housing Structures by Occupancy in Chisago County
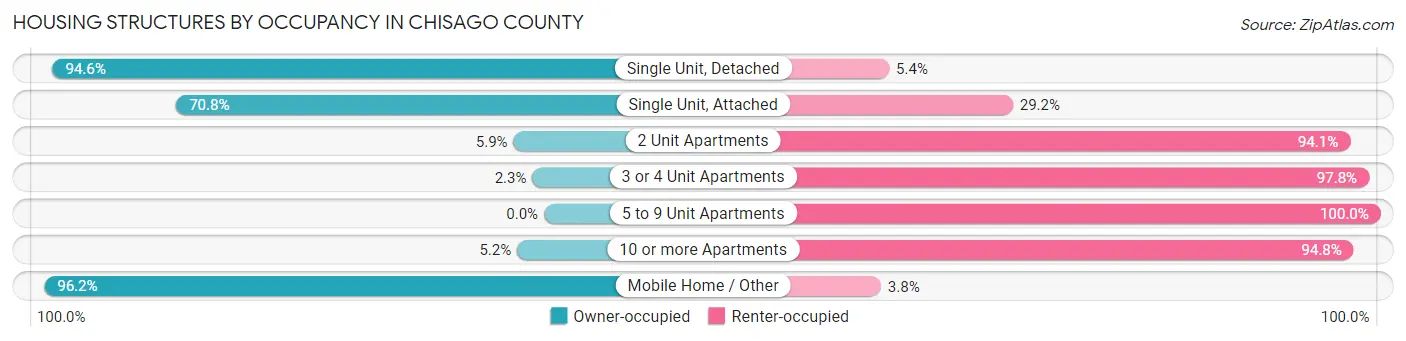
| Structure Type | Owner-occupied | Renter-occupied |
| Single Unit, Detached | 16,449 (94.6%) | 937 (5.4%) |
| Single Unit, Attached | 703 (70.8%) | 290 (29.2%) |
| 2 Unit Apartments | 5 (5.9%) | 80 (94.1%) |
| 3 or 4 Unit Apartments | 4 (2.2%) | 174 (97.8%) |
| 5 to 9 Unit Apartments | 0 (0.0%) | 142 (100.0%) |
| 10 or more Apartments | 64 (5.2%) | 1,169 (94.8%) |
| Mobile Home / Other | 860 (96.2%) | 34 (3.8%) |
| Total | 18,085 (86.5%) | 2,826 (13.5%) |
Housing Structures by Number of Rooms in Chisago County
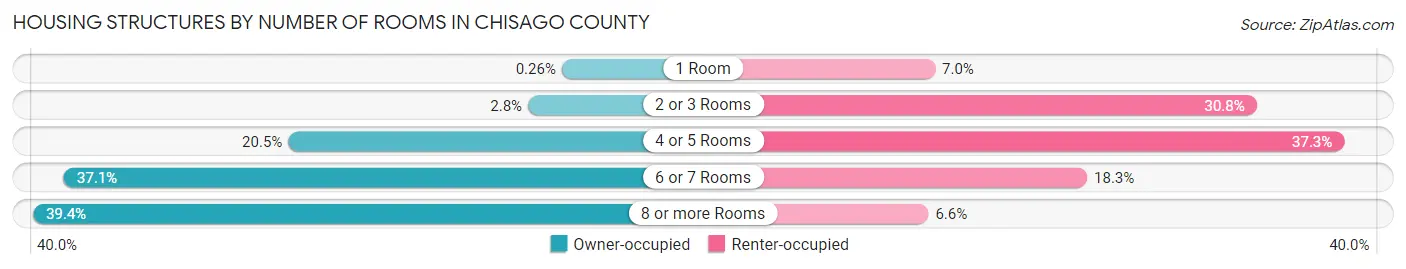
| Number of Rooms | Owner-occupied | Renter-occupied |
| 1 Room | 47 (0.3%) | 199 (7.0%) |
| 2 or 3 Rooms | 500 (2.8%) | 871 (30.8%) |
| 4 or 5 Rooms | 3,708 (20.5%) | 1,054 (37.3%) |
| 6 or 7 Rooms | 6,708 (37.1%) | 517 (18.3%) |
| 8 or more Rooms | 7,122 (39.4%) | 185 (6.6%) |
| Total | 18,085 (100.0%) | 2,826 (100.0%) |
Housing Structure by Heating Type in Chisago County
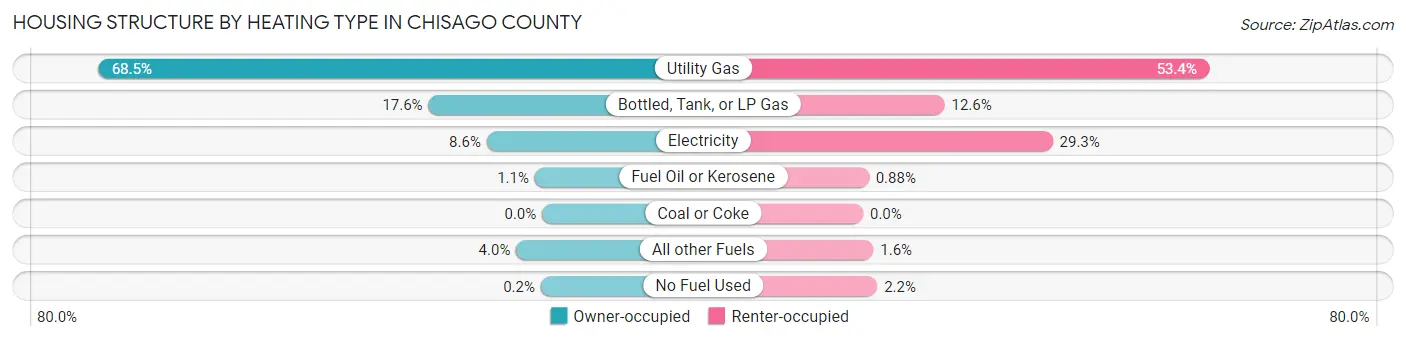
| Heating Type | Owner-occupied | Renter-occupied |
| Utility Gas | 12,395 (68.5%) | 1,510 (53.4%) |
| Bottled, Tank, or LP Gas | 3,177 (17.6%) | 356 (12.6%) |
| Electricity | 1,548 (8.6%) | 828 (29.3%) |
| Fuel Oil or Kerosene | 205 (1.1%) | 25 (0.9%) |
| Coal or Coke | 0 (0.0%) | 0 (0.0%) |
| All other Fuels | 724 (4.0%) | 45 (1.6%) |
| No Fuel Used | 36 (0.2%) | 62 (2.2%) |
| Total | 18,085 (100.0%) | 2,826 (100.0%) |
Household Vehicle Usage in Chisago County
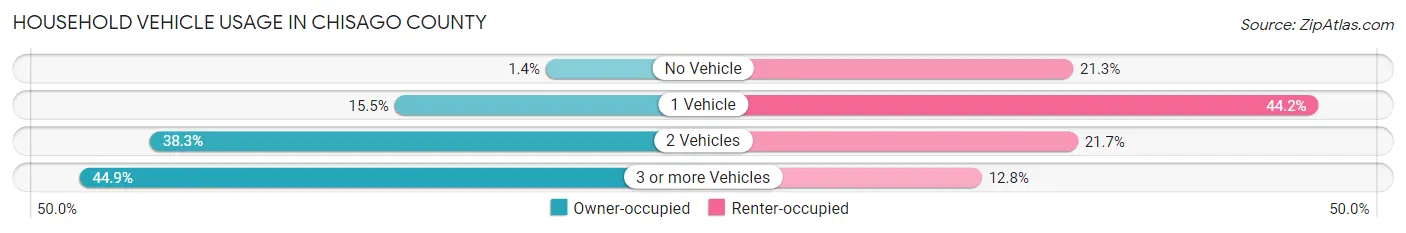
| Vehicles per Household | Owner-occupied | Renter-occupied |
| No Vehicle | 244 (1.3%) | 602 (21.3%) |
| 1 Vehicle | 2,798 (15.5%) | 1,249 (44.2%) |
| 2 Vehicles | 6,929 (38.3%) | 614 (21.7%) |
| 3 or more Vehicles | 8,114 (44.9%) | 361 (12.8%) |
| Total | 18,085 (100.0%) | 2,826 (100.0%) |
Real Estate & Mortgages in Chisago County
Real Estate and Mortgage Overview in Chisago County
| Characteristic | Without Mortgage | With Mortgage |
| Housing Units | 5,481 | 12,604 |
| Median Property Value | $282,200 | $307,000 |
| Median Household Income | $75,166 | $3,970 |
| Monthly Housing Costs | $674 | $917 |
| Real Estate Taxes | $3,242 | $150 |
Property Value by Mortgage Status in Chisago County
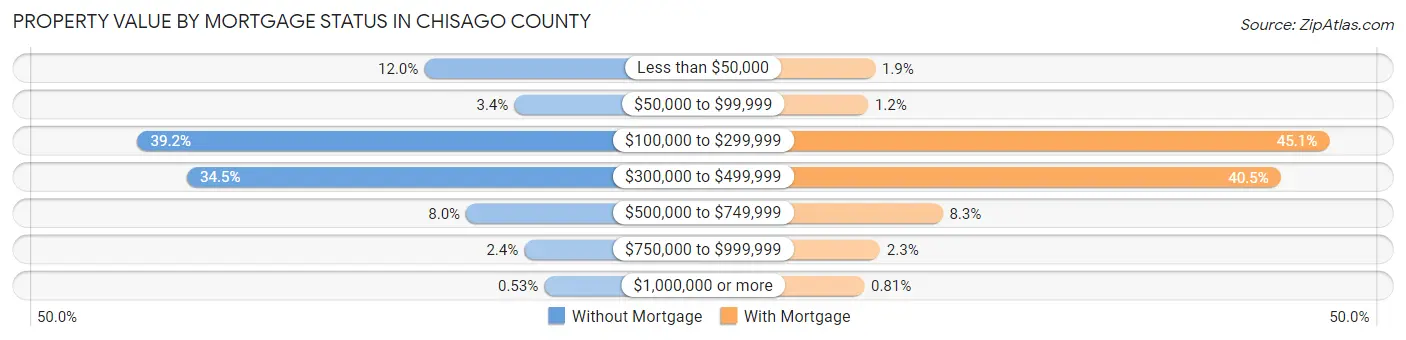
| Property Value | Without Mortgage | With Mortgage |
| Less than $50,000 | 655 (11.9%) | 233 (1.8%) |
| $50,000 to $99,999 | 185 (3.4%) | 149 (1.2%) |
| $100,000 to $299,999 | 2,150 (39.2%) | 5,683 (45.1%) |
| $300,000 to $499,999 | 1,892 (34.5%) | 5,101 (40.5%) |
| $500,000 to $749,999 | 437 (8.0%) | 1,044 (8.3%) |
| $750,000 to $999,999 | 133 (2.4%) | 292 (2.3%) |
| $1,000,000 or more | 29 (0.5%) | 102 (0.8%) |
| Total | 5,481 (100.0%) | 12,604 (100.0%) |
Household Income by Mortgage Status in Chisago County
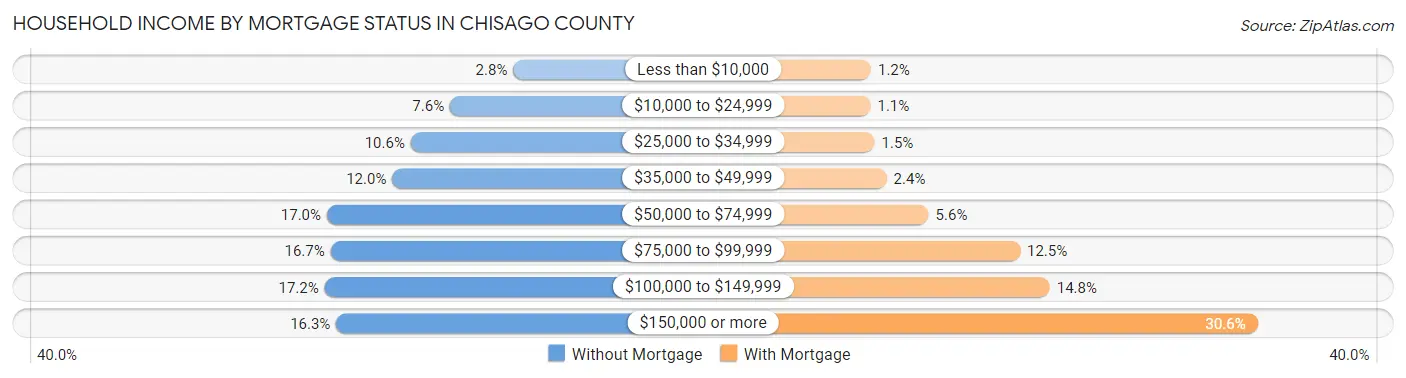
| Household Income | Without Mortgage | With Mortgage |
| Less than $10,000 | 152 (2.8%) | 149 (1.2%) |
| $10,000 to $24,999 | 416 (7.6%) | 144 (1.1%) |
| $25,000 to $34,999 | 580 (10.6%) | 183 (1.5%) |
| $35,000 to $49,999 | 657 (12.0%) | 299 (2.4%) |
| $50,000 to $74,999 | 930 (17.0%) | 702 (5.6%) |
| $75,000 to $99,999 | 915 (16.7%) | 1,579 (12.5%) |
| $100,000 to $149,999 | 940 (17.2%) | 1,866 (14.8%) |
| $150,000 or more | 891 (16.3%) | 3,861 (30.6%) |
| Total | 5,481 (100.0%) | 12,604 (100.0%) |
Property Value to Household Income Ratio in Chisago County
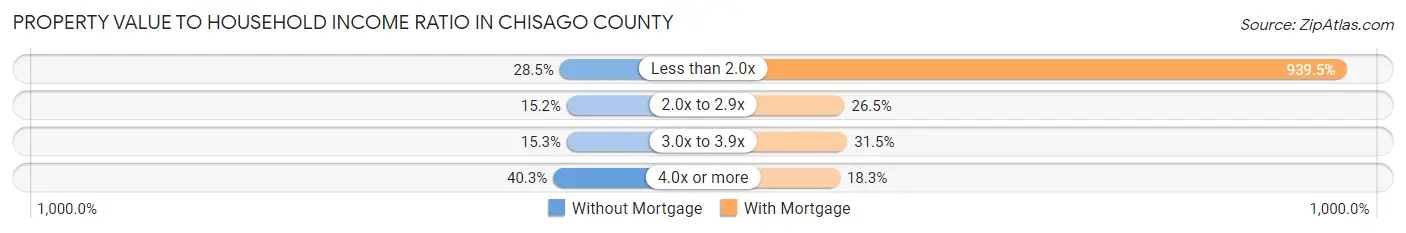
| Value-to-Income Ratio | Without Mortgage | With Mortgage |
| Less than 2.0x | 1,562 (28.5%) | 118,412 (939.5%) |
| 2.0x to 2.9x | 833 (15.2%) | 3,345 (26.5%) |
| 3.0x to 3.9x | 836 (15.2%) | 3,974 (31.5%) |
| 4.0x or more | 2,206 (40.3%) | 2,302 (18.3%) |
| Total | 5,481 (100.0%) | 12,604 (100.0%) |
Real Estate Taxes by Mortgage Status in Chisago County
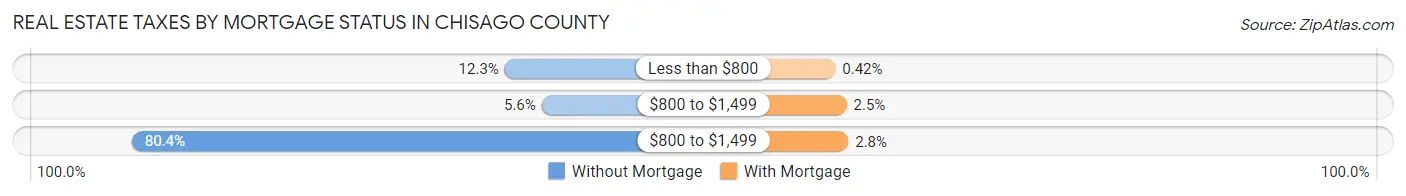
| Property Taxes | Without Mortgage | With Mortgage |
| Less than $800 | 675 (12.3%) | 53 (0.4%) |
| $800 to $1,499 | 306 (5.6%) | 313 (2.5%) |
| $800 to $1,499 | 4,408 (80.4%) | 351 (2.8%) |
| Total | 5,481 (100.0%) | 12,604 (100.0%) |
Health & Disability in Chisago County
Health Insurance Coverage by Age in Chisago County
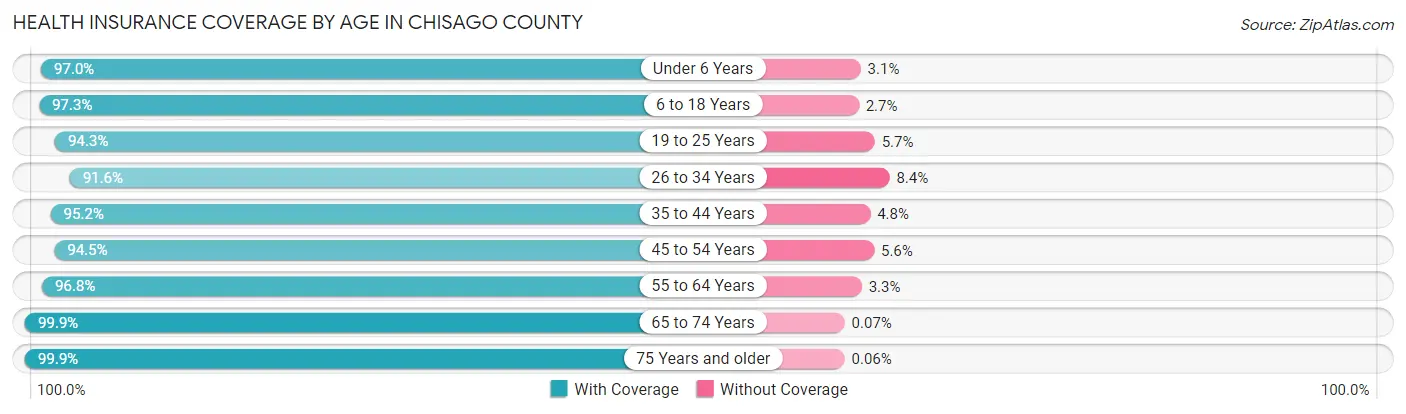
| Age Bracket | With Coverage | Without Coverage |
| Under 6 Years | 3,656 (97.0%) | 115 (3.0%) |
| 6 to 18 Years | 9,543 (97.3%) | 264 (2.7%) |
| 19 to 25 Years | 3,692 (94.3%) | 222 (5.7%) |
| 26 to 34 Years | 5,496 (91.6%) | 505 (8.4%) |
| 35 to 44 Years | 6,974 (95.2%) | 355 (4.8%) |
| 45 to 54 Years | 7,153 (94.5%) | 420 (5.6%) |
| 55 to 64 Years | 8,222 (96.8%) | 276 (3.3%) |
| 65 to 74 Years | 5,473 (99.9%) | 4 (0.1%) |
| 75 Years and older | 3,298 (99.9%) | 2 (0.1%) |
| Total | 53,507 (96.1%) | 2,163 (3.9%) |
Health Insurance Coverage by Citizenship Status in Chisago County
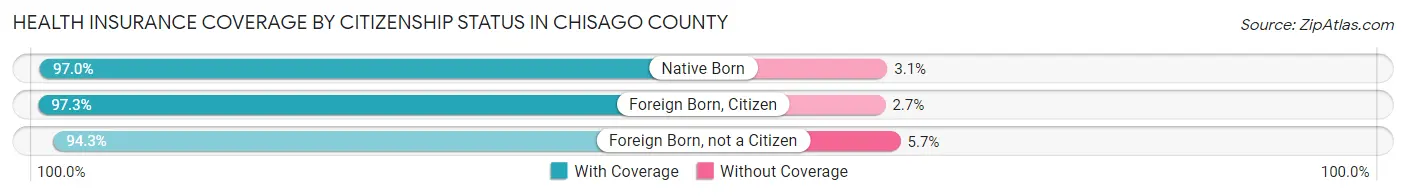
| Citizenship Status | With Coverage | Without Coverage |
| Native Born | 3,656 (97.0%) | 115 (3.0%) |
| Foreign Born, Citizen | 9,543 (97.3%) | 264 (2.7%) |
| Foreign Born, not a Citizen | 3,692 (94.3%) | 222 (5.7%) |
Health Insurance Coverage by Household Income in Chisago County
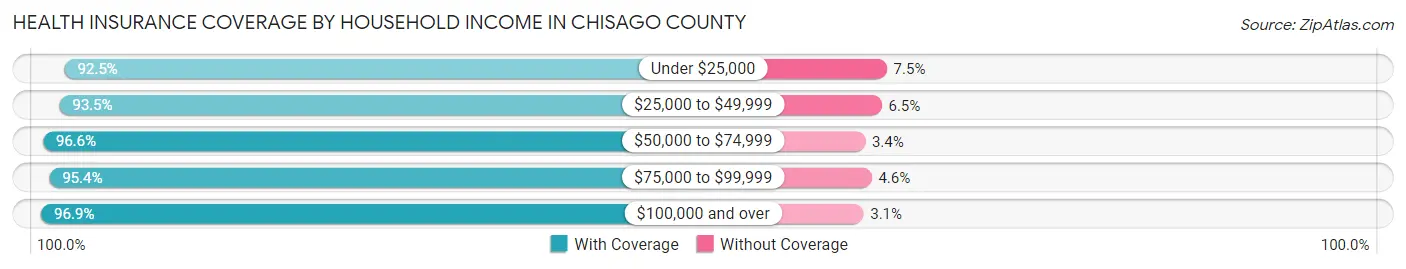
| Household Income | With Coverage | Without Coverage |
| Under $25,000 | 2,453 (92.5%) | 198 (7.5%) |
| $25,000 to $49,999 | 5,037 (93.5%) | 351 (6.5%) |
| $50,000 to $74,999 | 6,761 (96.6%) | 239 (3.4%) |
| $75,000 to $99,999 | 7,283 (95.4%) | 353 (4.6%) |
| $100,000 and over | 31,435 (96.9%) | 1,001 (3.1%) |
Public vs Private Health Insurance Coverage by Age in Chisago County
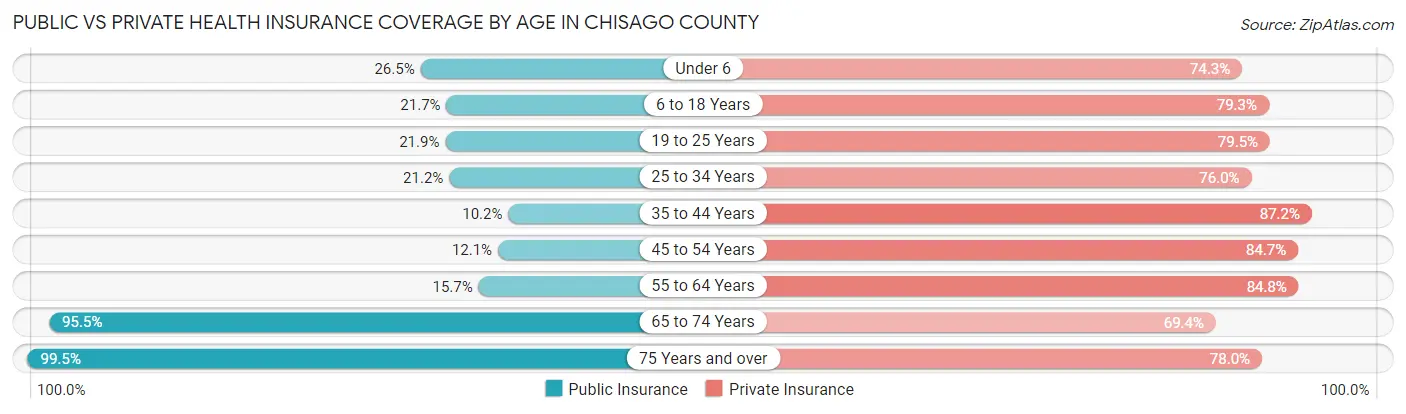
| Age Bracket | Public Insurance | Private Insurance |
| Under 6 | 1,000 (26.5%) | 2,802 (74.3%) |
| 6 to 18 Years | 2,129 (21.7%) | 7,772 (79.2%) |
| 19 to 25 Years | 858 (21.9%) | 3,110 (79.5%) |
| 25 to 34 Years | 1,272 (21.2%) | 4,562 (76.0%) |
| 35 to 44 Years | 749 (10.2%) | 6,393 (87.2%) |
| 45 to 54 Years | 919 (12.1%) | 6,413 (84.7%) |
| 55 to 64 Years | 1,338 (15.7%) | 7,206 (84.8%) |
| 65 to 74 Years | 5,229 (95.5%) | 3,802 (69.4%) |
| 75 Years and over | 3,282 (99.5%) | 2,573 (78.0%) |
| Total | 16,776 (30.1%) | 44,633 (80.2%) |
Disability Status by Sex by Age in Chisago County
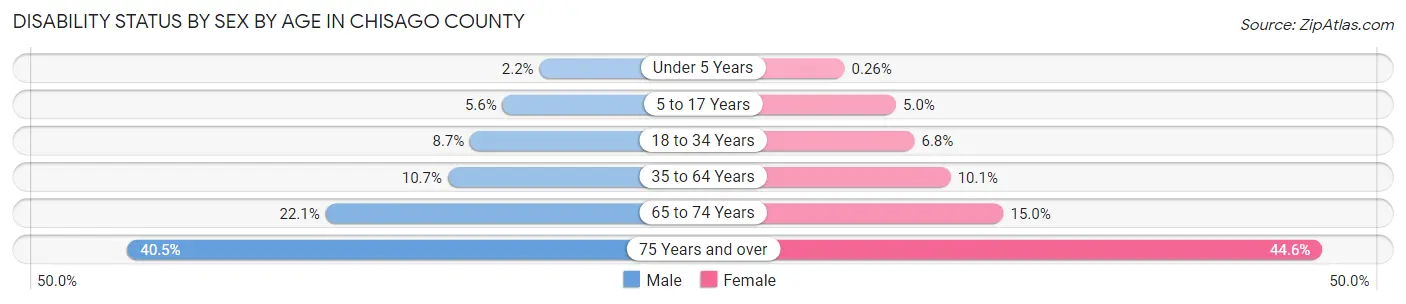
| Age Bracket | Male | Female |
| Under 5 Years | 36 (2.2%) | 4 (0.3%) |
| 5 to 17 Years | 283 (5.6%) | 233 (5.0%) |
| 18 to 34 Years | 483 (8.6%) | 343 (6.8%) |
| 35 to 64 Years | 1,295 (10.7%) | 1,145 (10.1%) |
| 65 to 74 Years | 606 (22.1%) | 410 (15.0%) |
| 75 Years and over | 630 (40.5%) | 777 (44.6%) |
Disability Class by Sex by Age in Chisago County
Disability Class: Hearing Difficulty
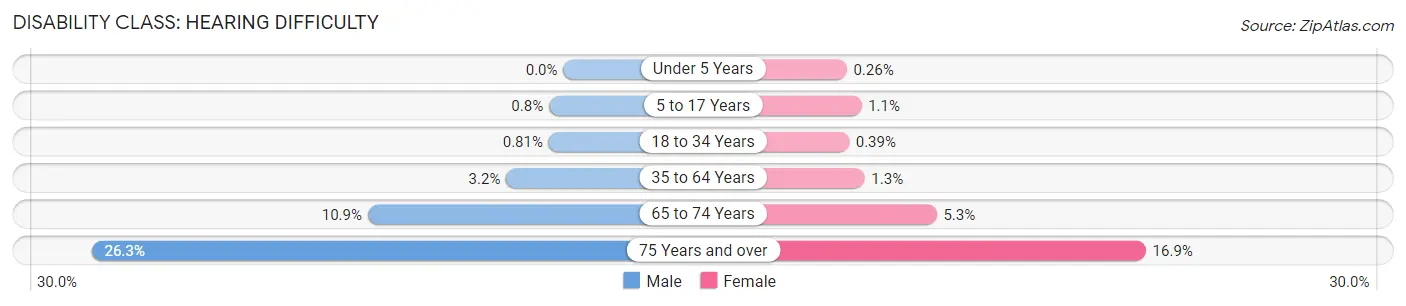
| Age Bracket | Male | Female |
| Under 5 Years | 0 (0.0%) | 4 (0.3%) |
| 5 to 17 Years | 40 (0.8%) | 50 (1.1%) |
| 18 to 34 Years | 45 (0.8%) | 20 (0.4%) |
| 35 to 64 Years | 384 (3.2%) | 143 (1.3%) |
| 65 to 74 Years | 299 (10.9%) | 144 (5.3%) |
| 75 Years and over | 409 (26.3%) | 295 (16.9%) |
Disability Class: Vision Difficulty
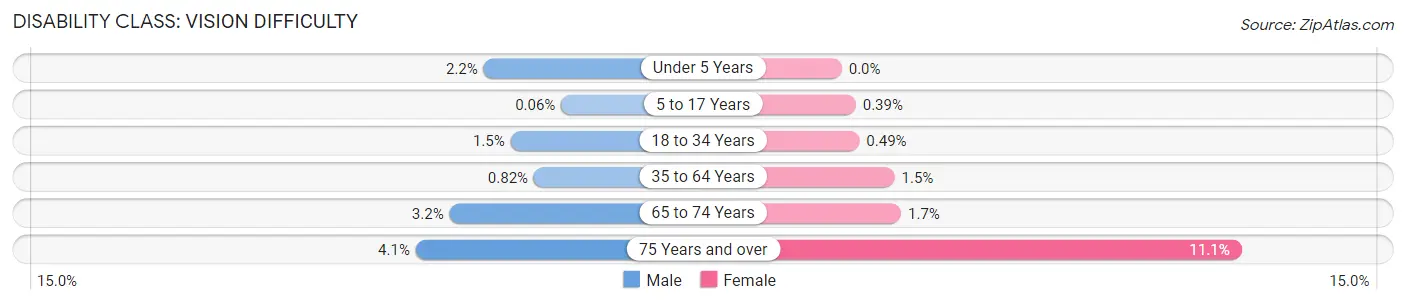
| Age Bracket | Male | Female |
| Under 5 Years | 36 (2.2%) | 0 (0.0%) |
| 5 to 17 Years | 3 (0.1%) | 18 (0.4%) |
| 18 to 34 Years | 82 (1.5%) | 25 (0.5%) |
| 35 to 64 Years | 99 (0.8%) | 167 (1.5%) |
| 65 to 74 Years | 87 (3.2%) | 45 (1.7%) |
| 75 Years and over | 64 (4.1%) | 194 (11.1%) |
Disability Class: Cognitive Difficulty
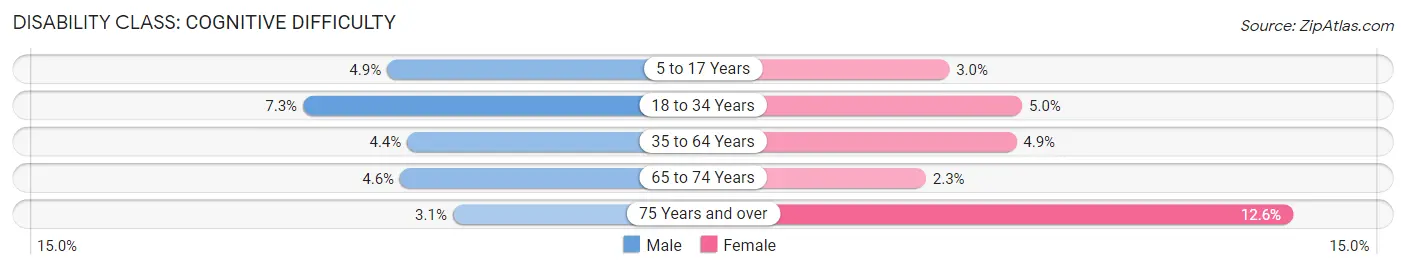
| Age Bracket | Male | Female |
| 5 to 17 Years | 246 (4.9%) | 138 (3.0%) |
| 18 to 34 Years | 405 (7.2%) | 255 (5.0%) |
| 35 to 64 Years | 525 (4.3%) | 550 (4.9%) |
| 65 to 74 Years | 125 (4.5%) | 64 (2.3%) |
| 75 Years and over | 48 (3.1%) | 219 (12.6%) |
Disability Class: Ambulatory Difficulty
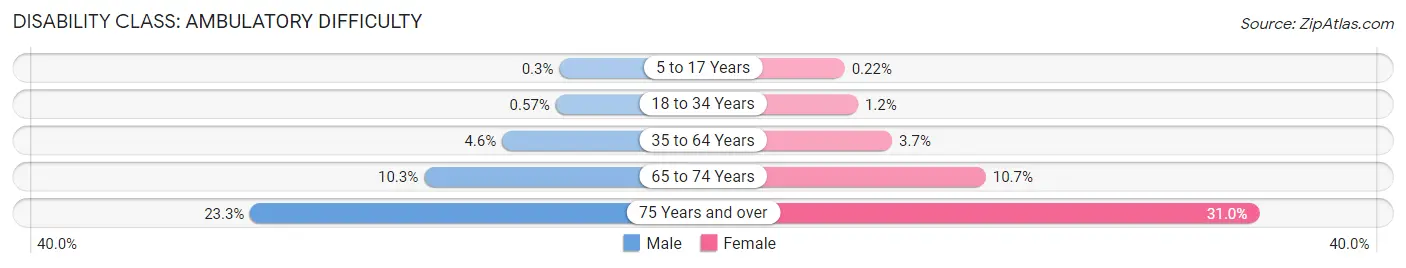
| Age Bracket | Male | Female |
| 5 to 17 Years | 15 (0.3%) | 10 (0.2%) |
| 18 to 34 Years | 32 (0.6%) | 61 (1.2%) |
| 35 to 64 Years | 549 (4.5%) | 423 (3.7%) |
| 65 to 74 Years | 284 (10.3%) | 292 (10.7%) |
| 75 Years and over | 362 (23.3%) | 540 (31.0%) |
Disability Class: Self-Care Difficulty
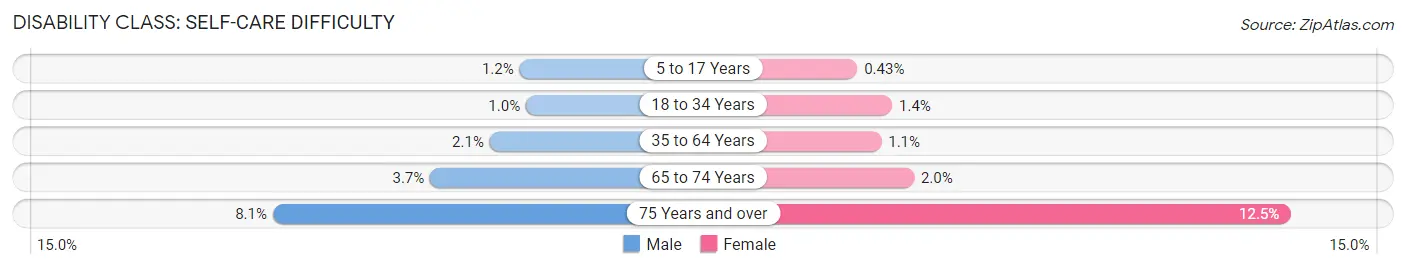
| Age Bracket | Male | Female |
| 5 to 17 Years | 61 (1.2%) | 20 (0.4%) |
| 18 to 34 Years | 58 (1.0%) | 71 (1.4%) |
| 35 to 64 Years | 247 (2.1%) | 124 (1.1%) |
| 65 to 74 Years | 102 (3.7%) | 55 (2.0%) |
| 75 Years and over | 126 (8.1%) | 218 (12.5%) |
Technology Access in Chisago County
Computing Device Access in Chisago County
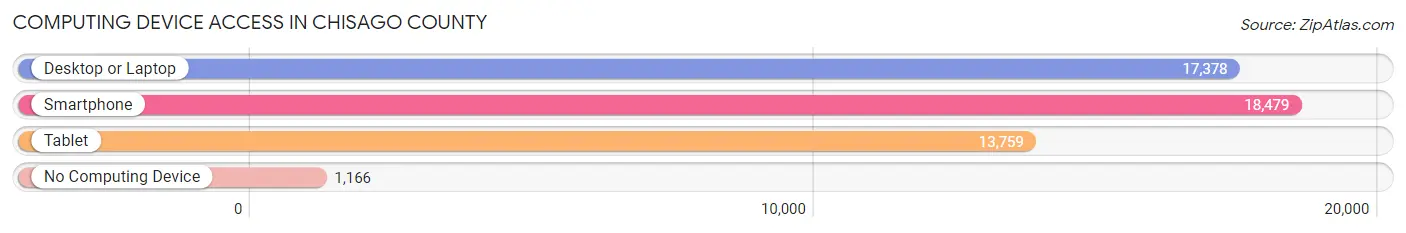
| Device Type | # Households | % Households |
| Desktop or Laptop | 17,378 | 83.1% |
| Smartphone | 18,479 | 88.4% |
| Tablet | 13,759 | 65.8% |
| No Computing Device | 1,166 | 5.6% |
| Total | 20,911 | 100.0% |
Internet Access in Chisago County
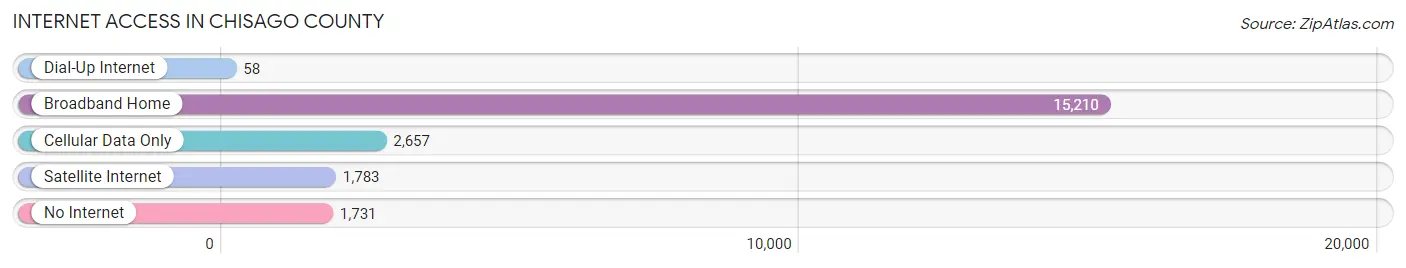
| Internet Type | # Households | % Households |
| Dial-Up Internet | 58 | 0.3% |
| Broadband Home | 15,210 | 72.7% |
| Cellular Data Only | 2,657 | 12.7% |
| Satellite Internet | 1,783 | 8.5% |
| No Internet | 1,731 | 8.3% |
| Total | 20,911 | 100.0% |
Chisago County Summary
Chisago County is located in east-central Minnesota, about 40 miles north of the Twin Cities. It is bordered by Isanti County to the north, Anoka County to the east, Washington County to the south, and Pine County to the west. The county seat is Center City, and the largest city is North Branch. The county was established in 1851 and named after the Chisago Lakes, which were named after the Chippewa word for “large lake.”
History
The area that is now Chisago County was originally inhabited by the Ojibwe people. The first European settlers arrived in the area in the early 1800s, and the county was officially established in 1851. The county was initially divided into two townships, Chisago and Rush Point. The first county seat was located in Rush Point, but it was moved to Center City in 1858.
The county experienced rapid growth in the late 19th and early 20th centuries, as the logging and farming industries flourished. The county was also home to several resorts, which attracted visitors from the Twin Cities and beyond. The county’s population peaked in the 1950s, but has since declined due to the decline of the logging and farming industries.
Geography
Chisago County covers an area of 545 square miles, of which 543 square miles is land and 2 square miles is water. The county is located in east-central Minnesota, about 40 miles north of the Twin Cities. It is bordered by Isanti County to the north, Anoka County to the east, Washington County to the south, and Pine County to the west.
The county is mostly flat, with some rolling hills in the northern and western parts. The highest point in the county is located in the northwest corner, at an elevation of 1,092 feet. The county is home to several lakes, including Chisago Lake, Green Lake, and South Center Lake.
Economy
The economy of Chisago County is largely based on agriculture and tourism. The county is home to several farms, which produce a variety of crops, including corn, soybeans, and hay. The county is also home to several resorts, which attract visitors from the Twin Cities and beyond.
The county is also home to several manufacturing companies, including a paper mill in North Branch and a plastics factory in Rush City. The county is also home to several retail stores, including a Walmart in North Branch and a Target in Rush City.
Demographics
As of the 2010 census, the population of Chisago County was 53,887. The population is mostly white (94.3%), with small percentages of African Americans (1.2%), Asians (1.1%), and Native Americans (0.4%). The median household income is $63,945, and the median home value is $212,400.
The county is home to several cities and towns, including Center City, North Branch, Rush City, and Taylors Falls. The county is also home to several unincorporated communities, including Chisago City, Harris, and Shafer.
Common Questions
What is the Total Population of Chisago County?
Total Population of Chisago County is 56,927.
What is the Total Male Population of Chisago County?
Total Male Population of Chisago County is 29,651.
What is the Total Female Population of Chisago County?
Total Female Population of Chisago County is 27,276.
What is the Ratio of Males per 100 Females in Chisago County?
There are 108.71 Males per 100 Females in Chisago County.
What is the Ratio of Females per 100 Males in Chisago County?
There are 91.99 Females per 100 Males in Chisago County.
What is the Median Population Age in Chisago County?
Median Population Age in Chisago County is 40.8 Years.
What is the Average Family Size in Chisago County
Average Family Size in Chisago County is 3.0 People.
What is the Average Household Size in Chisago County
Average Household Size in Chisago County is 2.6 People.
What is Per Capita Income in Chisago County?
Per Capita income in Chisago County is $41,814.
What is the Median Family Income in Chisago County?
Median Family Income in Chisago County is $112,631.
What is the Median Household income in Chisago County?
Median Household Income in Chisago County is $97,446.
What is Income or Wage Gap in Chisago County?
Income or Wage Gap in Chisago County is 30.9%.
Women in Chisago County earn 69.1 cents for every dollar earned by a man.
What is Family Income Deficit in Chisago County?
Family Income Deficit in Chisago County is $11,824.
Families that are below poverty line in Chisago County earn $11,824 less on average than the poverty threshold level.
What is Inequality or Gini Index in Chisago County?
Inequality or Gini Index in Chisago County is 0.38.
How Large is the Labor Force in Chisago County?
There are 31,269 People in the Labor Forcein in Chisago County.
What is the Percentage of People in the Labor Force in Chisago County?
68.1% of People are in the Labor Force in Chisago County.
What is the Unemployment Rate in Chisago County?
Unemployment Rate in Chisago County is 3.7%.