Cities with the Highest Percentage of Population with a Degree in Communications in Indiana
RELATED REPORTS & OPTIONS
Communications
Indiana
Compare Cities
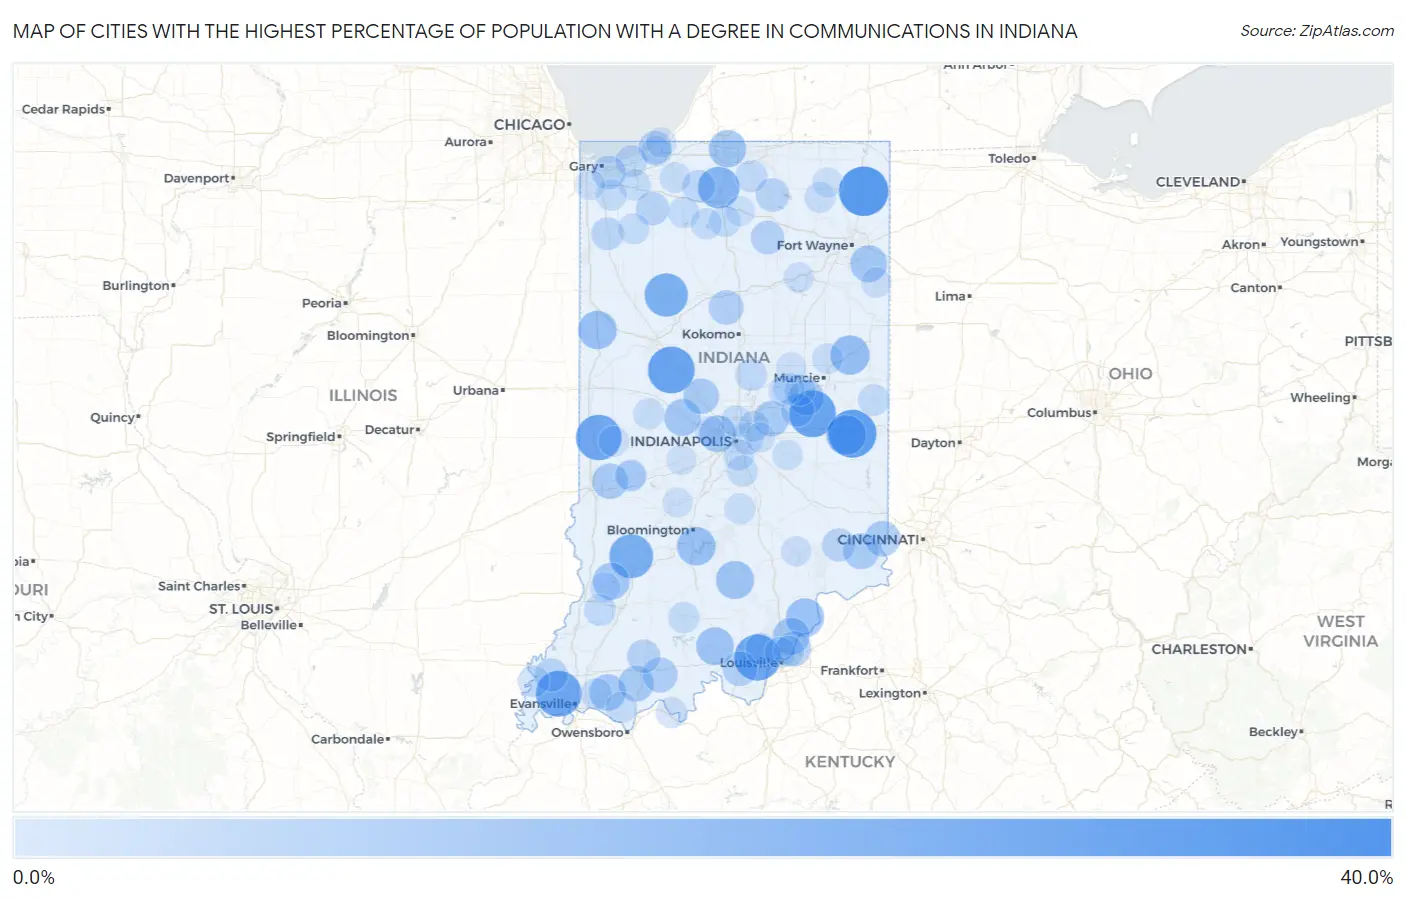
Map of Cities with the Highest Percentage of Population with a Degree in Communications in Indiana
0.0%
40.0%
Cities with the Highest Percentage of Population with a Degree in Communications in Indiana
| City | % Graduates | vs State | vs National | |
| 1. | Belleville | 30.6% | 3.7%(+27.0)#1 | 4.1%(+26.5)#219 |
| 2. | Waterloo | 28.3% | 3.7%(+24.6)#2 | 4.1%(+24.1)#254 |
| 3. | Hessen Cassel | 26.3% | 3.7%(+22.7)#3 | 4.1%(+22.2)#287 |
| 4. | East Germantown | 26.3% | 3.7%(+22.7)#4 | 4.1%(+22.2)#288 |
| 5. | Clarks Hill | 25.0% | 3.7%(+21.3)#5 | 4.1%(+20.9)#304 |
| 6. | Cadiz | 25.0% | 3.7%(+21.3)#6 | 4.1%(+20.9)#315 |
| 7. | Georgetown | 24.3% | 3.7%(+20.7)#7 | 4.1%(+20.2)#330 |
| 8. | Parkers Settlement | 23.9% | 3.7%(+20.2)#8 | 4.1%(+19.8)#342 |
| 9. | Montezuma | 23.7% | 3.7%(+20.0)#9 | 4.1%(+19.5)#346 |
| 10. | Lyons | 21.4% | 3.7%(+17.8)#10 | 4.1%(+17.3)#394 |
| 11. | Monticello | 20.9% | 3.7%(+17.2)#11 | 4.1%(+16.7)#418 |
| 12. | La Paz | 18.9% | 3.7%(+15.3)#12 | 4.1%(+14.8)#502 |
| 13. | Mount Auburn | 16.7% | 3.7%(+13.0)#13 | 4.1%(+12.5)#629 |
| 14. | Redkey | 16.0% | 3.7%(+12.4)#14 | 4.1%(+11.9)#666 |
| 15. | Boswell | 15.2% | 3.7%(+11.6)#15 | 4.1%(+11.1)#735 |
| 16. | Smithville Sanders | 15.1% | 3.7%(+11.5)#16 | 4.1%(+11.0)#740 |
| 17. | New Washington | 14.9% | 3.7%(+11.2)#17 | 4.1%(+10.8)#762 |
| 18. | Medora | 14.6% | 3.7%(+11.0)#18 | 4.1%(+10.5)#783 |
| 19. | Marengo | 14.3% | 3.7%(+10.6)#19 | 4.1%(+10.2)#813 |
| 20. | Indian Village | 14.0% | 3.7%(+10.3)#20 | 4.1%(+9.82)#872 |
| 21. | Charlestown | 13.4% | 3.7%(+9.77)#21 | 4.1%(+9.28)#917 |
| 22. | Hoagland | 13.3% | 3.7%(+9.68)#22 | 4.1%(+9.20)#926 |
| 23. | Edwardsport | 13.3% | 3.7%(+9.68)#23 | 4.1%(+9.20)#932 |
| 24. | Jamestown | 13.3% | 3.7%(+9.64)#24 | 4.1%(+9.15)#949 |
| 25. | Clermont | 13.2% | 3.7%(+9.57)#25 | 4.1%(+9.09)#960 |
| 26. | Boonville | 12.9% | 3.7%(+9.27)#26 | 4.1%(+8.78)#993 |
| 27. | Middletown | 12.0% | 3.7%(+8.35)#27 | 4.1%(+7.86)#1,129 |
| 28. | Dillsboro | 12.0% | 3.7%(+8.35)#28 | 4.1%(+7.86)#1,130 |
| 29. | Seelyville | 12.0% | 3.7%(+8.35)#29 | 4.1%(+7.86)#1,133 |
| 30. | Ulen | 11.9% | 3.7%(+8.21)#30 | 4.1%(+7.73)#1,161 |
| 31. | Lawrenceburg | 11.9% | 3.7%(+8.20)#31 | 4.1%(+7.72)#1,163 |
| 32. | Fortville | 11.8% | 3.7%(+8.16)#32 | 4.1%(+7.68)#1,171 |
| 33. | Gentryville | 11.8% | 3.7%(+8.11)#33 | 4.1%(+7.63)#1,185 |
| 34. | St Meinrad | 11.3% | 3.7%(+7.63)#34 | 4.1%(+7.14)#1,267 |
| 35. | Utica | 11.3% | 3.7%(+7.62)#35 | 4.1%(+7.13)#1,271 |
| 36. | Corydon | 10.9% | 3.7%(+7.20)#36 | 4.1%(+6.72)#1,371 |
| 37. | Walton | 10.8% | 3.7%(+7.16)#37 | 4.1%(+6.68)#1,379 |
| 38. | New Chicago | 9.9% | 3.7%(+6.21)#38 | 4.1%(+5.72)#1,633 |
| 39. | Claypool | 9.7% | 3.7%(+6.03)#39 | 4.1%(+5.54)#1,685 |
| 40. | Huntingburg | 9.5% | 3.7%(+5.83)#40 | 4.1%(+5.35)#1,756 |
| 41. | Milford | 9.5% | 3.7%(+5.81)#41 | 4.1%(+5.32)#1,762 |
| 42. | Barbee | 9.3% | 3.7%(+5.70)#42 | 4.1%(+5.21)#1,793 |
| 43. | Pottawattamie Park | 9.3% | 3.7%(+5.67)#43 | 4.1%(+5.19)#1,801 |
| 44. | La Crosse | 9.3% | 3.7%(+5.65)#44 | 4.1%(+5.17)#1,810 |
| 45. | Poseyville | 9.3% | 3.7%(+5.62)#45 | 4.1%(+5.14)#1,817 |
| 46. | Versailles | 9.1% | 3.7%(+5.44)#46 | 4.1%(+4.96)#1,862 |
| 47. | Markleville | 9.1% | 3.7%(+5.44)#47 | 4.1%(+4.96)#1,871 |
| 48. | Walkerton | 8.7% | 3.7%(+5.03)#48 | 4.1%(+4.54)#2,050 |
| 49. | Roselawn | 8.6% | 3.7%(+4.98)#49 | 4.1%(+4.50)#2,066 |
| 50. | Atlanta | 7.8% | 3.7%(+4.19)#50 | 4.1%(+3.71)#2,445 |
| 51. | Galena | 7.8% | 3.7%(+4.13)#51 | 4.1%(+3.65)#2,476 |
| 52. | Wakarusa | 7.7% | 3.7%(+4.07)#52 | 4.1%(+3.59)#2,500 |
| 53. | Porter | 7.6% | 3.7%(+3.94)#53 | 4.1%(+3.45)#2,596 |
| 54. | Warren Park | 7.5% | 3.7%(+3.86)#54 | 4.1%(+3.38)#2,643 |
| 55. | Monroe City | 7.5% | 3.7%(+3.85)#55 | 4.1%(+3.36)#2,650 |
| 56. | New Harmony | 7.4% | 3.7%(+3.73)#56 | 4.1%(+3.25)#2,729 |
| 57. | Lynn | 7.3% | 3.7%(+3.62)#57 | 4.1%(+3.14)#2,820 |
| 58. | Argos | 7.2% | 3.7%(+3.55)#58 | 4.1%(+3.06)#2,871 |
| 59. | Knox | 7.1% | 3.7%(+3.49)#59 | 4.1%(+3.01)#2,908 |
| 60. | West Baden Springs | 7.1% | 3.7%(+3.49)#60 | 4.1%(+3.01)#2,919 |
| 61. | Chandler | 7.1% | 3.7%(+3.44)#61 | 4.1%(+2.96)#2,958 |
| 62. | Knightsville | 7.0% | 3.7%(+3.37)#62 | 4.1%(+2.88)#3,018 |
| 63. | Valparaiso | 7.0% | 3.7%(+3.36)#63 | 4.1%(+2.88)#3,025 |
| 64. | New Whiteland | 7.0% | 3.7%(+3.35)#64 | 4.1%(+2.87)#3,031 |
| 65. | Williams Creek | 7.0% | 3.7%(+3.35)#65 | 4.1%(+2.87)#3,034 |
| 66. | Culver | 7.0% | 3.7%(+3.33)#66 | 4.1%(+2.85)#3,056 |
| 67. | Woodlawn Heights | 7.0% | 3.7%(+3.33)#67 | 4.1%(+2.84)#3,065 |
| 68. | Chesterfield | 6.9% | 3.7%(+3.28)#68 | 4.1%(+2.80)#3,089 |
| 69. | Winfield | 6.9% | 3.7%(+3.25)#69 | 4.1%(+2.77)#3,111 |
| 70. | Foxcliff Estates | 6.9% | 3.7%(+3.25)#70 | 4.1%(+2.77)#3,113 |
| 71. | Wheatfield | 6.9% | 3.7%(+3.25)#71 | 4.1%(+2.76)#3,119 |
| 72. | Richland | 6.9% | 3.7%(+3.25)#72 | 4.1%(+2.76)#3,120 |
| 73. | Homecroft | 6.8% | 3.7%(+3.17)#73 | 4.1%(+2.69)#3,177 |
| 74. | Albion | 6.7% | 3.7%(+3.08)#74 | 4.1%(+2.60)#3,281 |
| 75. | Cordry Sweetwater Lakes | 6.7% | 3.7%(+3.02)#75 | 4.1%(+2.53)#3,323 |
| 76. | Harmony | 6.7% | 3.7%(+3.02)#76 | 4.1%(+2.53)#3,330 |
| 77. | New Market | 6.7% | 3.7%(+3.02)#77 | 4.1%(+2.53)#3,337 |
| 78. | Kingsbury | 6.7% | 3.7%(+3.02)#78 | 4.1%(+2.53)#3,351 |
| 79. | Clarksville | 6.6% | 3.7%(+2.96)#79 | 4.1%(+2.48)#3,399 |
| 80. | Eaton | 6.6% | 3.7%(+2.95)#80 | 4.1%(+2.47)#3,408 |
| 81. | Cannelton | 6.6% | 3.7%(+2.95)#81 | 4.1%(+2.47)#3,409 |
| 82. | Lawrence | 6.5% | 3.7%(+2.90)#82 | 4.1%(+2.41)#3,453 |
| 83. | Jeffersonville | 6.4% | 3.7%(+2.78)#83 | 4.1%(+2.30)#3,569 |
| 84. | Edgewood | 6.4% | 3.7%(+2.71)#84 | 4.1%(+2.22)#3,633 |
| 85. | Rockville | 6.3% | 3.7%(+2.64)#85 | 4.1%(+2.16)#3,694 |
| 86. | Morristown | 6.2% | 3.7%(+2.60)#86 | 4.1%(+2.11)#3,750 |
| 87. | Decatur | 6.1% | 3.7%(+2.48)#87 | 4.1%(+1.99)#3,885 |
| 88. | North Vernon | 6.1% | 3.7%(+2.46)#88 | 4.1%(+1.98)#3,903 |
| 89. | Andrews | 6.0% | 3.7%(+2.35)#89 | 4.1%(+1.86)#4,036 |
| 90. | Brownsburg | 6.0% | 3.7%(+2.32)#90 | 4.1%(+1.84)#4,064 |
| 91. | Trail Creek | 6.0% | 3.7%(+2.32)#91 | 4.1%(+1.84)#4,067 |
| 92. | Schererville | 5.9% | 3.7%(+2.23)#92 | 4.1%(+1.75)#4,152 |
| 93. | Bicknell | 5.9% | 3.7%(+2.23)#93 | 4.1%(+1.75)#4,156 |
| 94. | Michiana Shores | 5.9% | 3.7%(+2.23)#94 | 4.1%(+1.75)#4,169 |
| 95. | Stilesville | 5.9% | 3.7%(+2.23)#95 | 4.1%(+1.75)#4,179 |
| 96. | Cumberland | 5.9% | 3.7%(+2.21)#96 | 4.1%(+1.72)#4,206 |
| 97. | Rome City | 5.9% | 3.7%(+2.20)#97 | 4.1%(+1.72)#4,224 |
| 98. | Alexandria | 5.8% | 3.7%(+2.15)#98 | 4.1%(+1.66)#4,284 |
| 99. | Bourbon | 5.8% | 3.7%(+2.11)#99 | 4.1%(+1.63)#4,325 |
| 100. | Gosport | 5.7% | 3.7%(+2.06)#100 | 4.1%(+1.58)#4,384 |
Common Questions
What are the Top 10 Cities with the Highest Percentage of Population with a Degree in Communications in Indiana?
Top 10 Cities with the Highest Percentage of Population with a Degree in Communications in Indiana are:
#1
28.3%
#2
26.3%
#3
25.0%
#4
25.0%
#5
24.3%
#6
23.9%
#7
23.7%
#8
21.4%
#9
20.9%
#10
18.9%
What city has the Highest Percentage of Population with a Degree in Communications in Indiana?
Waterloo has the Highest Percentage of Population with a Degree in Communications in Indiana with 28.3%.
What is the Percentage of Population with a Degree in Communications in the State of Indiana?
Percentage of Population with a Degree in Communications in Indiana is 3.7%.
What is the Percentage of Population with a Degree in Communications in the United States?
Percentage of Population with a Degree in Communications in the United States is 4.1%.