Dutch College, Under 1 year
COMPARE
Dutch
Select to Compare
College, Under 1 year
Dutch College, Under 1 year
65.3%
COLLEGE, UNDER 1 YEAR
46.1/ 100
METRIC RATING
180th/ 347
METRIC RANK
Dutch College, Under 1 year Correlation Chart
The statistical analysis conducted on geographies consisting of 554,354,714 people shows a mild negative correlation between the proportion of Dutch and percentage of population with at least college, under 1 year education in the United States with a correlation coefficient (R) of -0.382 and weighted average of 65.3%. On average, for every 1% (one percent) increase in Dutch within a typical geography, there is a decrease of 0.23% in percentage of population with at least college, under 1 year education.
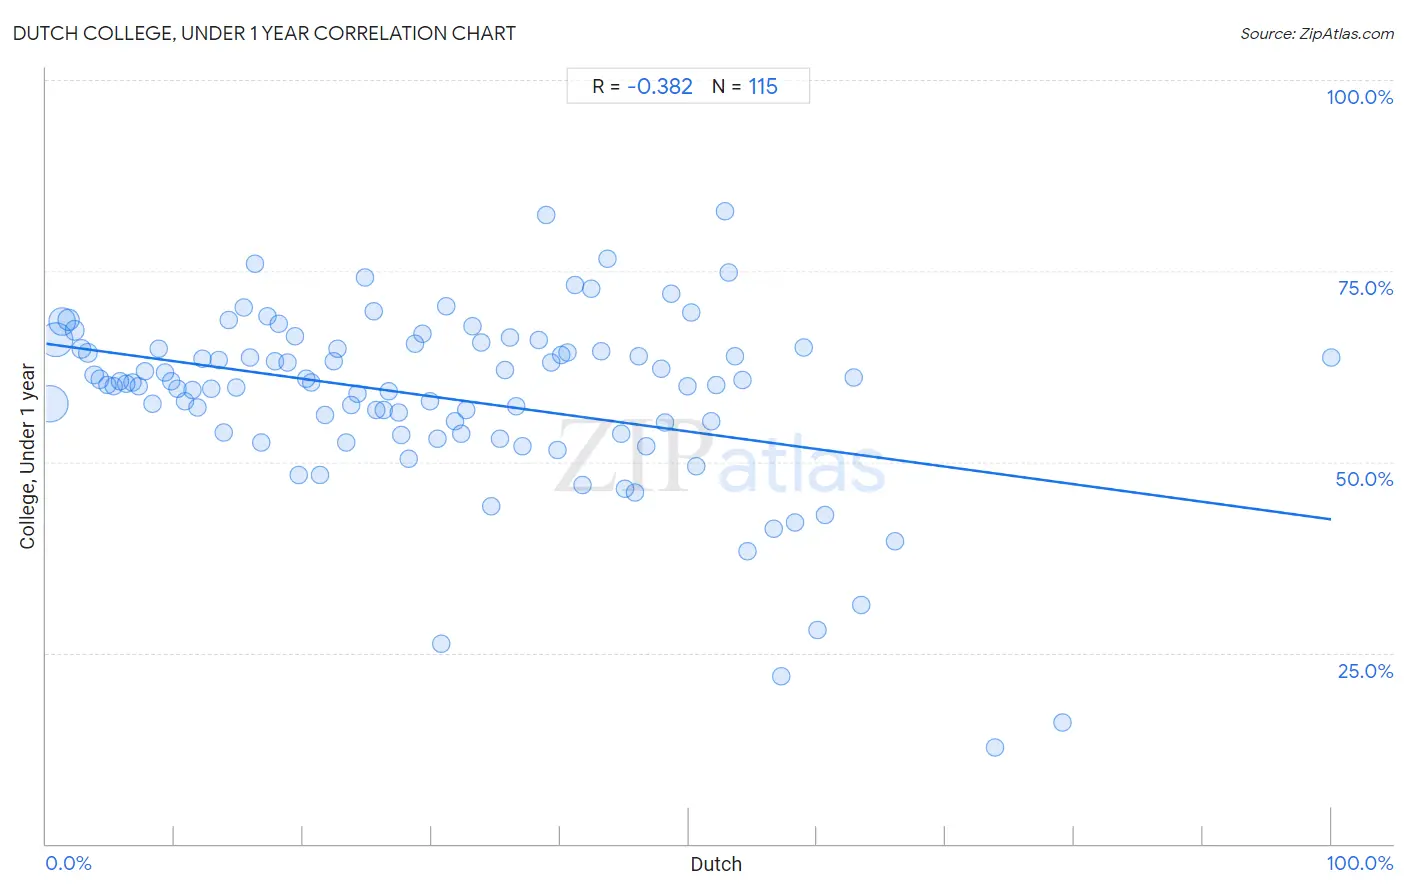
It is essential to understand that the correlation between the percentage of Dutch and percentage of population with at least college, under 1 year education does not imply a direct cause-and-effect relationship. It remains uncertain whether the presence of Dutch influences an upward or downward trend in the level of percentage of population with at least college, under 1 year education within an area, or if Dutch simply ended up residing in those areas with higher or lower levels of percentage of population with at least college, under 1 year education due to other factors.
Demographics Similar to Dutch by College, Under 1 year
In terms of college, under 1 year, the demographic groups most similar to Dutch are Spaniard (65.3%, a difference of 0.030%), Immigrants from Africa (65.3%, a difference of 0.060%), Guamanian/Chamorro (65.4%, a difference of 0.090%), German Russian (65.4%, a difference of 0.10%), and Immigrants from North Macedonia (65.4%, a difference of 0.11%).
| Demographics | Rating | Rank | College, Under 1 year |
| Swiss | 53.9 /100 | #173 | Average 65.5% |
| Immigrants from Bosnia and Herzegovina | 50.0 /100 | #174 | Average 65.4% |
| Scotch-Irish | 49.5 /100 | #175 | Average 65.4% |
| French | 48.9 /100 | #176 | Average 65.4% |
| Immigrants from North Macedonia | 48.6 /100 | #177 | Average 65.4% |
| German Russians | 48.3 /100 | #178 | Average 65.4% |
| Guamanians/Chamorros | 48.2 /100 | #179 | Average 65.4% |
| Dutch | 46.1 /100 | #180 | Average 65.3% |
| Spaniards | 45.5 /100 | #181 | Average 65.3% |
| Immigrants from Africa | 44.7 /100 | #182 | Average 65.3% |
| Immigrants from Poland | 42.6 /100 | #183 | Average 65.2% |
| Bermudans | 42.0 /100 | #184 | Average 65.2% |
| Sri Lankans | 41.7 /100 | #185 | Average 65.2% |
| Immigrants from Sierra Leone | 39.7 /100 | #186 | Fair 65.1% |
| Immigrants from Southern Europe | 34.3 /100 | #187 | Fair 64.9% |
Dutch College, Under 1 year Correlation Summary
| Measurement | Dutch Data | College, Under 1 year Data |
| Minimum | 0.27% | 12.6% |
| Maximum | 100.0% | 82.8% |
| Range | 99.7% | 70.1% |
| Mean | 30.6% | 58.4% |
| Median | 28.7% | 60.4% |
| Interquartile 25% (IQ1) | 14.2% | 53.7% |
| Interquartile 75% (IQ3) | 45.1% | 64.8% |
| Interquartile Range (IQR) | 30.9% | 11.1% |
| Standard Deviation (Sample) | 19.7% | 11.9% |
| Standard Deviation (Population) | 19.7% | 11.8% |
Correlation Details
| Dutch Percentile | Sample Size | College, Under 1 year |
[ 0.0% - 0.5% ] 0.27% | 193,077,359 | 57.6% |
[ 0.5% - 1.0% ] 0.74% | 173,485,816 | 66.0% |
[ 1.0% - 1.5% ] 1.22% | 97,820,805 | 68.4% |
[ 1.5% - 2.0% ] 1.72% | 42,377,265 | 68.6% |
[ 2.0% - 2.5% ] 2.23% | 19,198,990 | 67.2% |
[ 2.5% - 3.0% ] 2.71% | 9,713,874 | 64.8% |
[ 3.0% - 3.5% ] 3.23% | 5,251,147 | 64.3% |
[ 3.5% - 4.0% ] 3.73% | 3,029,093 | 61.4% |
[ 4.0% - 4.5% ] 4.22% | 1,896,561 | 60.8% |
[ 4.5% - 5.0% ] 4.75% | 1,323,472 | 60.0% |
[ 5.0% - 5.5% ] 5.24% | 919,286 | 59.9% |
[ 5.5% - 6.0% ] 5.77% | 799,253 | 60.6% |
[ 6.0% - 6.5% ] 6.19% | 611,840 | 60.2% |
[ 6.5% - 7.0% ] 6.72% | 411,240 | 60.4% |
[ 7.0% - 7.5% ] 7.23% | 377,817 | 59.9% |
[ 7.5% - 8.0% ] 7.70% | 336,568 | 61.9% |
[ 8.0% - 8.5% ] 8.24% | 258,277 | 57.7% |
[ 8.5% - 9.0% ] 8.78% | 345,640 | 64.8% |
[ 9.0% - 9.5% ] 9.25% | 270,702 | 61.6% |
[ 9.5% - 10.0% ] 9.73% | 150,889 | 60.6% |
[ 10.0% - 10.5% ] 10.26% | 194,382 | 59.6% |
[ 10.5% - 11.0% ] 10.78% | 128,594 | 58.0% |
[ 11.0% - 11.5% ] 11.38% | 102,395 | 59.5% |
[ 11.5% - 12.0% ] 11.79% | 83,273 | 57.1% |
[ 12.0% - 12.5% ] 12.20% | 265,960 | 63.5% |
[ 12.5% - 13.0% ] 12.81% | 114,169 | 59.6% |
[ 13.0% - 13.5% ] 13.40% | 88,093 | 63.4% |
[ 13.5% - 14.0% ] 13.78% | 85,350 | 53.8% |
[ 14.0% - 14.5% ] 14.16% | 68,366 | 68.6% |
[ 14.5% - 15.0% ] 14.76% | 105,623 | 59.7% |
[ 15.0% - 15.5% ] 15.40% | 50,066 | 70.3% |
[ 15.5% - 16.0% ] 15.84% | 180,160 | 63.7% |
[ 16.0% - 16.5% ] 16.23% | 189,954 | 76.0% |
[ 16.5% - 17.0% ] 16.77% | 25,393 | 52.5% |
[ 17.0% - 17.5% ] 17.21% | 60,627 | 69.1% |
[ 17.5% - 18.0% ] 17.80% | 78,644 | 63.1% |
[ 18.0% - 18.5% ] 18.08% | 47,022 | 68.1% |
[ 18.5% - 19.0% ] 18.73% | 35,782 | 63.0% |
[ 19.0% - 19.5% ] 19.37% | 64,744 | 66.4% |
[ 19.5% - 20.0% ] 19.61% | 20,323 | 48.3% |
[ 20.0% - 20.5% ] 20.23% | 10,815 | 60.9% |
[ 20.5% - 21.0% ] 20.66% | 16,414 | 60.5% |
[ 21.0% - 21.5% ] 21.26% | 7,202 | 48.2% |
[ 21.5% - 22.0% ] 21.67% | 3,779 | 56.1% |
[ 22.0% - 22.5% ] 22.33% | 38,028 | 63.2% |
[ 22.5% - 23.0% ] 22.65% | 84,471 | 64.7% |
[ 23.0% - 23.5% ] 23.31% | 5,852 | 52.6% |
[ 23.5% - 24.0% ] 23.77% | 18,464 | 57.5% |
[ 24.0% - 24.5% ] 24.23% | 49,965 | 59.0% |
[ 24.5% - 25.0% ] 24.78% | 2,155 | 74.2% |
[ 25.0% - 25.5% ] 25.47% | 33,691 | 69.8% |
[ 25.5% - 26.0% ] 25.69% | 2,783 | 56.8% |
[ 26.0% - 26.5% ] 26.23% | 8,570 | 56.8% |
[ 26.5% - 27.0% ] 26.68% | 30,309 | 59.3% |
[ 27.0% - 27.5% ] 27.40% | 21,806 | 56.5% |
[ 27.5% - 28.0% ] 27.63% | 5,515 | 53.5% |
[ 28.0% - 28.5% ] 28.21% | 4,353 | 50.5% |
[ 28.5% - 29.0% ] 28.73% | 63,863 | 65.5% |
[ 29.0% - 29.5% ] 29.27% | 17,833 | 66.7% |
[ 29.5% - 30.0% ] 29.86% | 1,393 | 57.9% |
[ 30.0% - 30.5% ] 30.41% | 7,662 | 53.0% |
[ 30.5% - 31.0% ] 30.77% | 156 | 26.1% |
[ 31.0% - 31.5% ] 31.13% | 30,575 | 70.4% |
[ 31.5% - 32.0% ] 31.79% | 7,797 | 55.3% |
[ 32.0% - 32.5% ] 32.31% | 2,061 | 53.7% |
[ 32.5% - 33.0% ] 32.72% | 2,610 | 56.7% |
[ 33.0% - 33.5% ] 33.19% | 467 | 67.8% |
[ 33.5% - 34.0% ] 33.87% | 1,435 | 65.7% |
[ 34.5% - 35.0% ] 34.59% | 899 | 44.1% |
[ 35.0% - 35.5% ] 35.29% | 1,159 | 53.0% |
[ 35.5% - 36.0% ] 35.71% | 5,315 | 62.0% |
[ 36.0% - 36.5% ] 36.07% | 28,428 | 66.3% |
[ 36.5% - 37.0% ] 36.60% | 3,989 | 57.4% |
[ 37.0% - 37.5% ] 37.04% | 1,150 | 52.0% |
[ 38.0% - 38.5% ] 38.32% | 428 | 66.0% |
[ 38.5% - 39.0% ] 38.94% | 208 | 82.3% |
[ 39.0% - 39.5% ] 39.33% | 989 | 63.1% |
[ 39.5% - 40.0% ] 39.75% | 478 | 51.6% |
[ 40.0% - 40.5% ] 40.09% | 23,394 | 63.9% |
[ 40.5% - 41.0% ] 40.54% | 30,571 | 64.3% |
[ 41.0% - 41.5% ] 41.12% | 41,002 | 73.1% |
[ 41.5% - 42.0% ] 41.74% | 5,218 | 46.9% |
[ 42.0% - 42.5% ] 42.37% | 7,116 | 72.7% |
[ 43.0% - 43.5% ] 43.16% | 8,080 | 64.5% |
[ 43.5% - 44.0% ] 43.71% | 318 | 76.6% |
[ 44.5% - 45.0% ] 44.78% | 8,483 | 53.6% |
[ 45.0% - 45.5% ] 45.08% | 4,887 | 46.4% |
[ 45.5% - 46.0% ] 45.83% | 408 | 46.1% |
[ 46.0% - 46.5% ] 46.14% | 11,008 | 63.8% |
[ 46.5% - 47.0% ] 46.66% | 1,749 | 52.1% |
[ 47.5% - 48.0% ] 47.83% | 1,708 | 62.1% |
[ 48.0% - 48.5% ] 48.19% | 1,629 | 55.2% |
[ 48.5% - 49.0% ] 48.68% | 7,130 | 72.0% |
[ 49.5% - 50.0% ] 49.86% | 1,416 | 60.0% |
[ 50.0% - 50.5% ] 50.22% | 20,042 | 69.5% |
[ 50.5% - 51.0% ] 50.62% | 81 | 49.4% |
[ 51.5% - 52.0% ] 51.76% | 1,022 | 55.3% |
[ 52.0% - 52.5% ] 52.17% | 1,428 | 60.1% |
[ 52.5% - 53.0% ] 52.78% | 1,114 | 82.8% |
[ 53.0% - 53.5% ] 53.12% | 642 | 74.8% |
[ 53.5% - 54.0% ] 53.63% | 179 | 63.8% |
[ 54.0% - 54.5% ] 54.14% | 2,087 | 60.8% |
[ 54.5% - 55.0% ] 54.55% | 473 | 38.3% |
[ 56.5% - 57.0% ] 56.59% | 751 | 41.3% |
[ 57.0% - 57.5% ] 57.23% | 318 | 22.0% |
[ 58.0% - 58.5% ] 58.30% | 578 | 42.1% |
[ 58.5% - 59.0% ] 58.93% | 1,064 | 64.9% |
[ 60.0% - 60.5% ] 60.00% | 25 | 28.0% |
[ 60.5% - 61.0% ] 60.59% | 477 | 43.1% |
[ 62.5% - 63.0% ] 62.87% | 676 | 61.1% |
[ 63.0% - 63.5% ] 63.44% | 1,012 | 31.3% |
[ 66.0% - 66.5% ] 66.10% | 351 | 39.6% |
[ 73.5% - 74.0% ] 73.81% | 126 | 12.6% |
[ 79.0% - 79.5% ] 79.12% | 182 | 16.0% |
[ 99.5% - 100.0% ] 100.00% | 88 | 63.6% |