Warren AFB, WY Map & Demographics
Warren AFB Map
Warren AFB Overview
$25,439
PER CAPITA INCOME
$58,723
AVG FAMILY INCOME
$58,856
AVG HOUSEHOLD INCOME
35.3%
WAGE / INCOME GAP [ % ]
64.7¢/ $1
WAGE / INCOME GAP [ $ ]
$6,497
FAMILY INCOME DEFICIT
0.33
INEQUALITY / GINI INDEX
2,836
TOTAL POPULATION
1,637
MALE POPULATION
1,199
FEMALE POPULATION
136.53
MALES / 100 FEMALES
73.24
FEMALES / 100 MALES
22.2
MEDIAN AGE
3.0
AVG FAMILY SIZE
2.9
AVG HOUSEHOLD SIZE
1,777
LABOR FORCE [ PEOPLE ]
89.1%
PERCENT IN LABOR FORCE
11.8%
UNEMPLOYMENT RATE
Income in Warren AFB
Income Overview in Warren AFB
Per Capita Income in Warren AFB is $25,439, while median incomes of families and households are $58,723 and $58,856 respectively.
| Characteristic | Number | Measure |
| Per Capita Income | 2,836 | $25,439 |
| Median Family Income | 746 | $58,723 |
| Mean Family Income | 746 | $73,696 |
| Median Household Income | 773 | $58,856 |
| Mean Household Income | 773 | $75,033 |
| Income Deficit | 746 | $6,497 |
| Wage / Income Gap (%) | 2,836 | 35.32% |
| Wage / Income Gap ($) | 2,836 | 64.68¢ per $1 |
| Gini / Inequality Index | 2,836 | 0.33 |
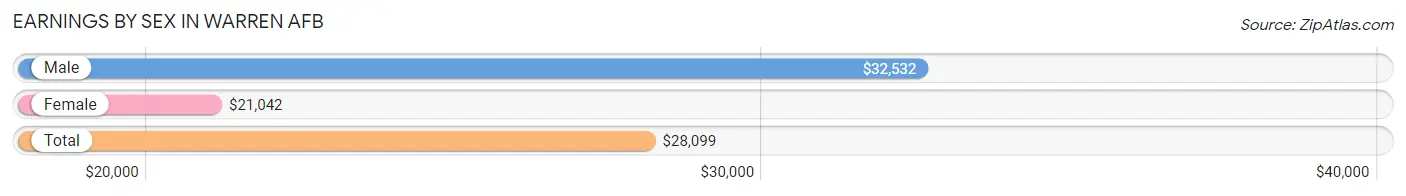
Earnings by Sex in Warren AFB
Average Earnings in Warren AFB are $28,099, $32,532 for men and $21,042 for women, a difference of 35.3%.
| Sex | Number | Average Earnings |
| Male | 1,191 (65.1%) | $32,532 |
| Female | 638 (34.9%) | $21,042 |
| Total | 1,829 (100.0%) | $28,099 |
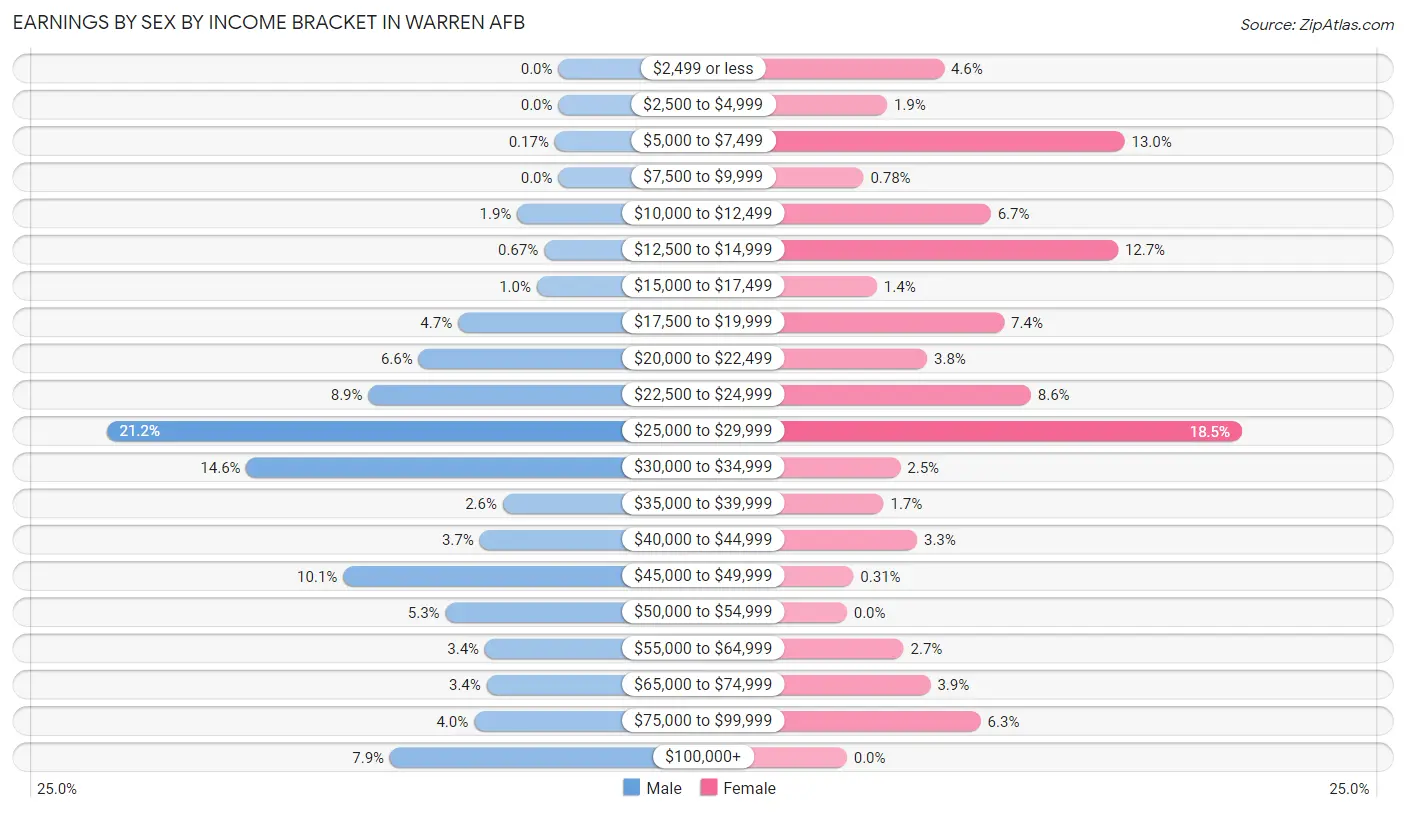
Earnings by Sex by Income Bracket in Warren AFB
The most common earnings brackets in Warren AFB are $25,000 to $29,999 for men (252 | 21.2%) and $25,000 to $29,999 for women (118 | 18.5%).
| Income | Male | Female |
| $2,499 or less | 0 (0.0%) | 29 (4.5%) |
| $2,500 to $4,999 | 0 (0.0%) | 12 (1.9%) |
| $5,000 to $7,499 | 2 (0.2%) | 83 (13.0%) |
| $7,500 to $9,999 | 0 (0.0%) | 5 (0.8%) |
| $10,000 to $12,499 | 23 (1.9%) | 43 (6.7%) |
| $12,500 to $14,999 | 8 (0.7%) | 81 (12.7%) |
| $15,000 to $17,499 | 12 (1.0%) | 9 (1.4%) |
| $17,500 to $19,999 | 56 (4.7%) | 47 (7.4%) |
| $20,000 to $22,499 | 78 (6.6%) | 24 (3.8%) |
| $22,500 to $24,999 | 106 (8.9%) | 55 (8.6%) |
| $25,000 to $29,999 | 252 (21.2%) | 118 (18.5%) |
| $30,000 to $34,999 | 174 (14.6%) | 16 (2.5%) |
| $35,000 to $39,999 | 31 (2.6%) | 11 (1.7%) |
| $40,000 to $44,999 | 44 (3.7%) | 21 (3.3%) |
| $45,000 to $49,999 | 120 (10.1%) | 2 (0.3%) |
| $50,000 to $54,999 | 63 (5.3%) | 0 (0.0%) |
| $55,000 to $64,999 | 41 (3.4%) | 17 (2.7%) |
| $65,000 to $74,999 | 40 (3.4%) | 25 (3.9%) |
| $75,000 to $99,999 | 47 (4.0%) | 40 (6.3%) |
| $100,000+ | 94 (7.9%) | 0 (0.0%) |
| Total | 1,191 (100.0%) | 638 (100.0%) |
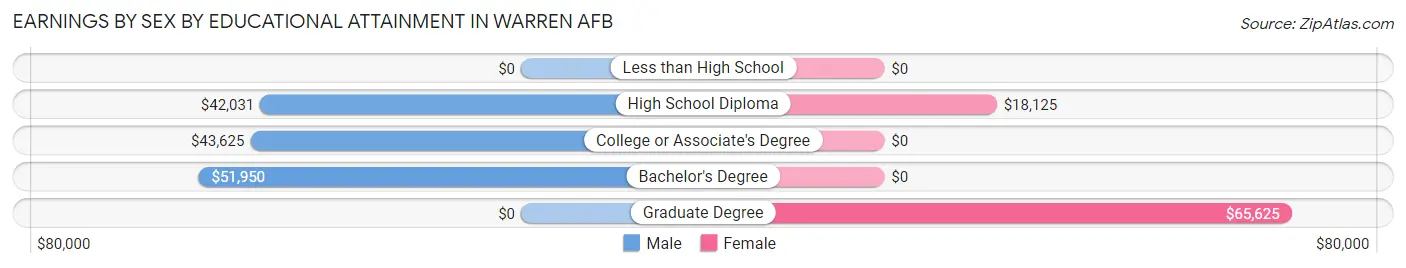
Earnings by Sex by Educational Attainment in Warren AFB
Average earnings in Warren AFB are $49,936 for men and $19,417 for women, a difference of 61.1%. Men with an educational attainment of bachelor's degree enjoy the highest average annual earnings of $51,950, while those with high school diploma education earn the least with $42,031. Women with an educational attainment of graduate degree earn the most with the average annual earnings of $65,625, while those with high school diploma education have the smallest earnings of $18,125.
| Educational Attainment | Male Income | Female Income |
| Less than High School | - | - |
| High School Diploma | $42,031 | $18,125 |
| College or Associate's Degree | $43,625 | $0 |
| Bachelor's Degree | $51,950 | $0 |
| Graduate Degree | - | - |
| Total | $49,936 | $19,417 |
Family Income in Warren AFB
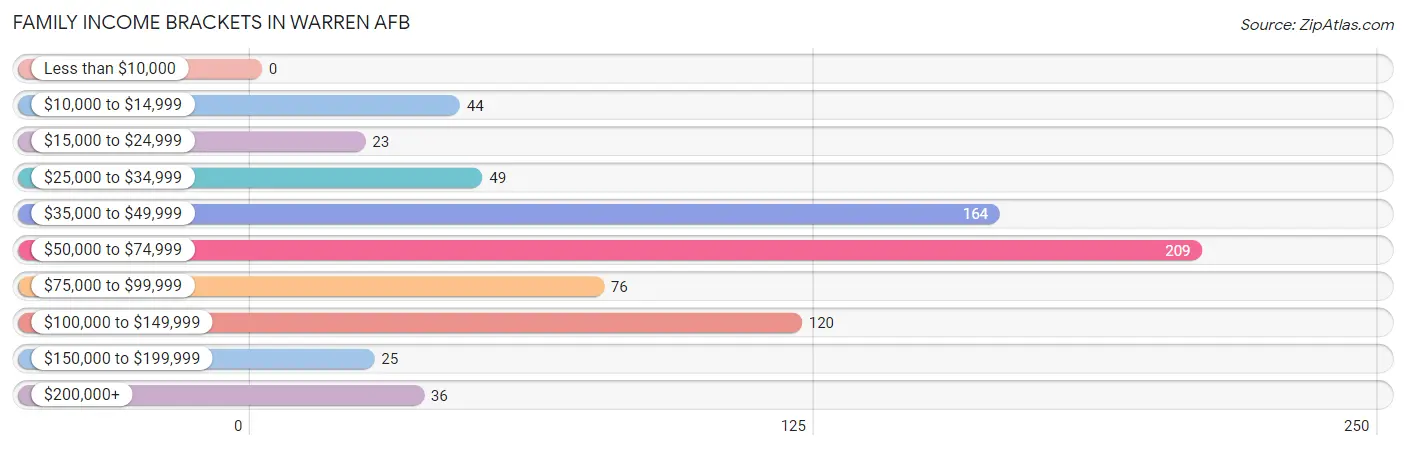
Family Income Brackets in Warren AFB
According to the Warren AFB family income data, there are 209 families falling into the $50,000 to $74,999 income range, which is the most common income bracket and makes up 28.0% of all families.
| Income Bracket | # Families | % Families |
| Less than $10,000 | 0 | 0.0% |
| $10,000 to $14,999 | 44 | 5.9% |
| $15,000 to $24,999 | 23 | 3.1% |
| $25,000 to $34,999 | 49 | 6.6% |
| $35,000 to $49,999 | 164 | 22.0% |
| $50,000 to $74,999 | 209 | 28.0% |
| $75,000 to $99,999 | 76 | 10.2% |
| $100,000 to $149,999 | 120 | 16.1% |
| $150,000 to $199,999 | 25 | 3.4% |
| $200,000+ | 36 | 4.8% |
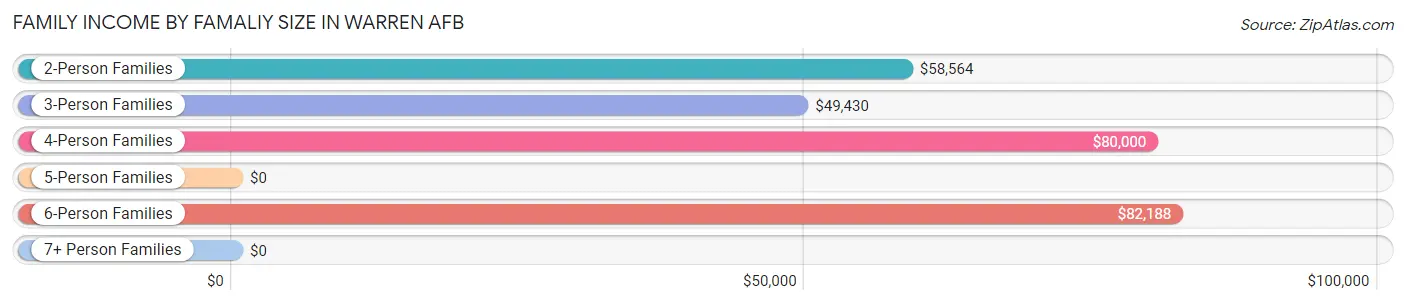
Family Income by Famaliy Size in Warren AFB
6-person families (16 | 2.1%) account for the highest median family income in Warren AFB with $82,188 per family, while 2-person families (232 | 31.1%) have the highest median income of $29,282 per family member.
| Income Bracket | # Families | Median Income |
| 2-Person Families | 232 (31.1%) | $58,564 |
| 3-Person Families | 255 (34.2%) | $49,430 |
| 4-Person Families | 198 (26.5%) | $80,000 |
| 5-Person Families | 45 (6.0%) | $0 |
| 6-Person Families | 16 (2.1%) | $82,188 |
| 7+ Person Families | 0 (0.0%) | $0 |
| Total | 746 (100.0%) | $58,723 |
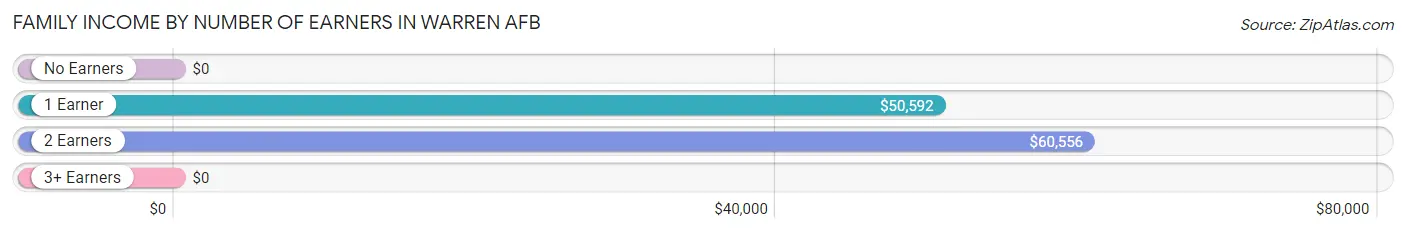
Family Income by Number of Earners in Warren AFB
| Number of Earners | # Families | Median Income |
| No Earners | 0 (0.0%) | $0 |
| 1 Earner | 308 (41.3%) | $50,592 |
| 2 Earners | 422 (56.6%) | $60,556 |
| 3+ Earners | 16 (2.1%) | $0 |
| Total | 746 (100.0%) | $58,723 |
Household Income in Warren AFB
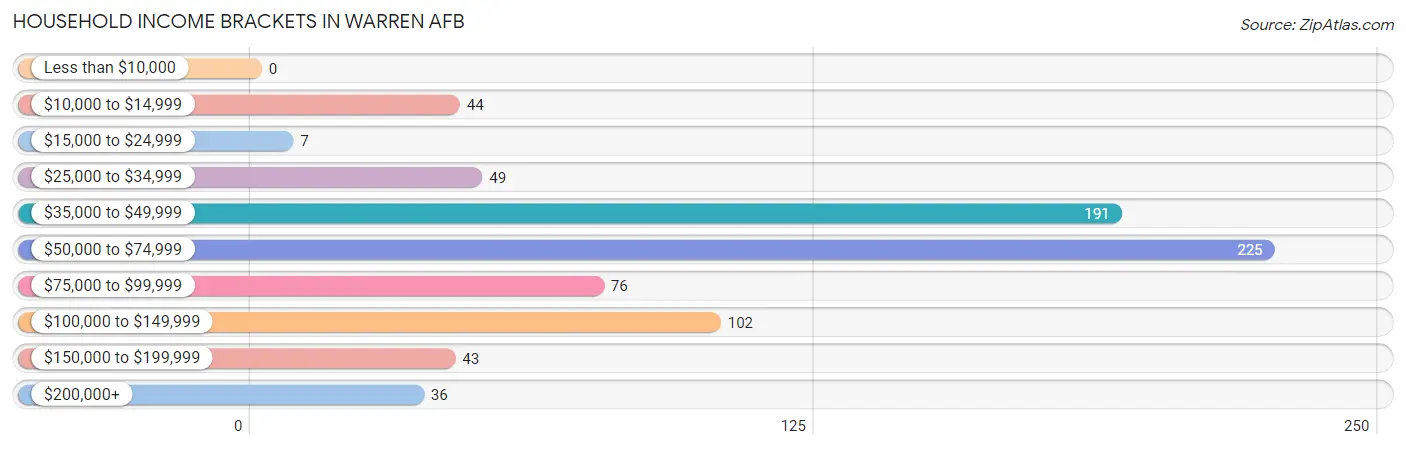
Household Income Brackets in Warren AFB
With 225 households falling in the category, the $50,000 to $74,999 income range is the most frequent in Warren AFB, accounting for 29.1% of all households.
| Income Bracket | # Households | % Households |
| Less than $10,000 | 0 | 0.0% |
| $10,000 to $14,999 | 44 | 5.7% |
| $15,000 to $24,999 | 7 | 0.9% |
| $25,000 to $34,999 | 49 | 6.3% |
| $35,000 to $49,999 | 191 | 24.7% |
| $50,000 to $74,999 | 225 | 29.1% |
| $75,000 to $99,999 | 76 | 9.8% |
| $100,000 to $149,999 | 102 | 13.2% |
| $150,000 to $199,999 | 43 | 5.6% |
| $200,000+ | 36 | 4.7% |
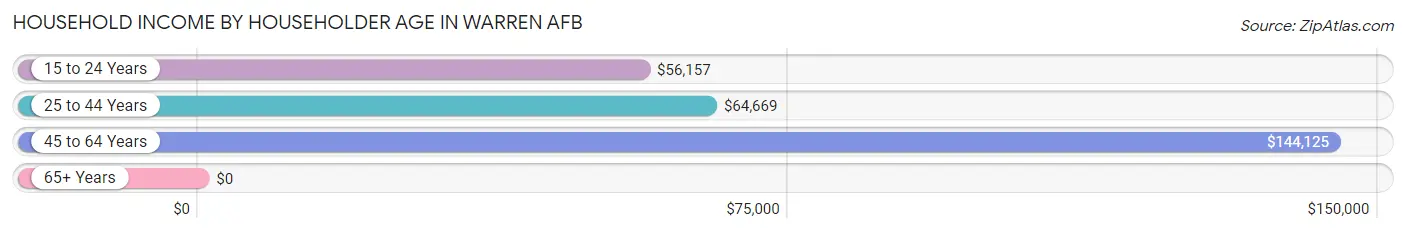
Household Income by Householder Age in Warren AFB
The median household income in Warren AFB is $58,856, with the highest median household income of $144,125 found in the 45 to 64 years age bracket for the primary householder. A total of 57 households (7.4%) fall into this category.
| Income Bracket | # Households | Median Income |
| 15 to 24 Years | 207 (26.8%) | $56,157 |
| 25 to 44 Years | 509 (65.8%) | $64,669 |
| 45 to 64 Years | 57 (7.4%) | $144,125 |
| 65+ Years | 0 (0.0%) | $0 |
| Total | 773 (100.0%) | $58,856 |
Poverty in Warren AFB
Income Below Poverty by Sex and Age in Warren AFB
With 1.8% poverty level for males and 11.2% for females among the residents of Warren AFB, 5 year old males and 12 to 14 year old females are the most vulnerable to poverty, with 14 males (100.0%) and 27 females (31.0%) in their respective age groups living below the poverty level.
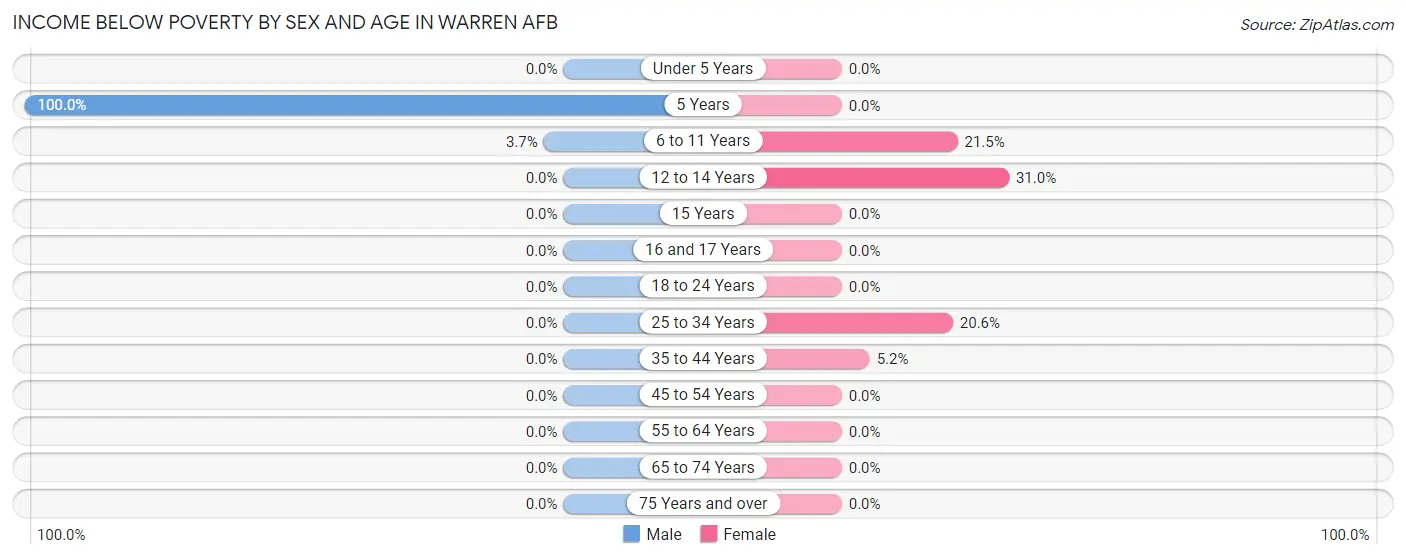
| Age Bracket | Male | Female |
| Under 5 Years | 0 (0.0%) | 0 (0.0%) |
| 5 Years | 14 (100.0%) | 0 (0.0%) |
| 6 to 11 Years | 7 (3.7%) | 29 (21.5%) |
| 12 to 14 Years | 0 (0.0%) | 27 (31.0%) |
| 15 Years | 0 (0.0%) | 0 (0.0%) |
| 16 and 17 Years | 0 (0.0%) | 0 (0.0%) |
| 18 to 24 Years | 0 (0.0%) | 0 (0.0%) |
| 25 to 34 Years | 0 (0.0%) | 60 (20.6%) |
| 35 to 44 Years | 0 (0.0%) | 7 (5.2%) |
| 45 to 54 Years | 0 (0.0%) | 0 (0.0%) |
| 55 to 64 Years | 0 (0.0%) | 0 (0.0%) |
| 65 to 74 Years | 0 (0.0%) | 0 (0.0%) |
| 75 Years and over | 0 (0.0%) | 0 (0.0%) |
| Total | 21 (1.8%) | 123 (11.2%) |
Income Above Poverty by Sex and Age in Warren AFB
According to the poverty statistics in Warren AFB, males aged under 5 years and females aged under 5 years are the age groups that are most secure financially, with 100.0% of males and 100.0% of females in these age groups living above the poverty line.
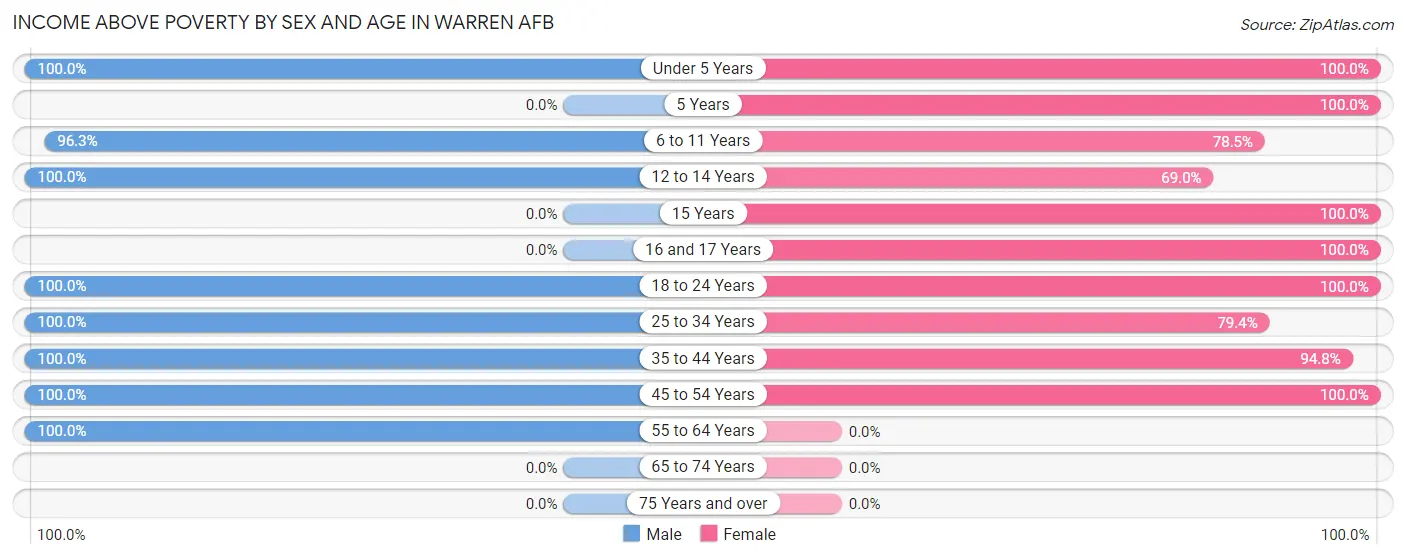
| Age Bracket | Male | Female |
| Under 5 Years | 198 (100.0%) | 90 (100.0%) |
| 5 Years | 0 (0.0%) | 41 (100.0%) |
| 6 to 11 Years | 184 (96.3%) | 106 (78.5%) |
| 12 to 14 Years | 28 (100.0%) | 60 (69.0%) |
| 15 Years | 0 (0.0%) | 58 (100.0%) |
| 16 and 17 Years | 0 (0.0%) | 31 (100.0%) |
| 18 to 24 Years | 206 (100.0%) | 179 (100.0%) |
| 25 to 34 Years | 352 (100.0%) | 231 (79.4%) |
| 35 to 44 Years | 130 (100.0%) | 128 (94.8%) |
| 45 to 54 Years | 48 (100.0%) | 53 (100.0%) |
| 55 to 64 Years | 4 (100.0%) | 0 (0.0%) |
| 65 to 74 Years | 0 (0.0%) | 0 (0.0%) |
| 75 Years and over | 0 (0.0%) | 0 (0.0%) |
| Total | 1,150 (98.2%) | 977 (88.8%) |
Income Below Poverty Among Married-Couple Families in Warren AFB
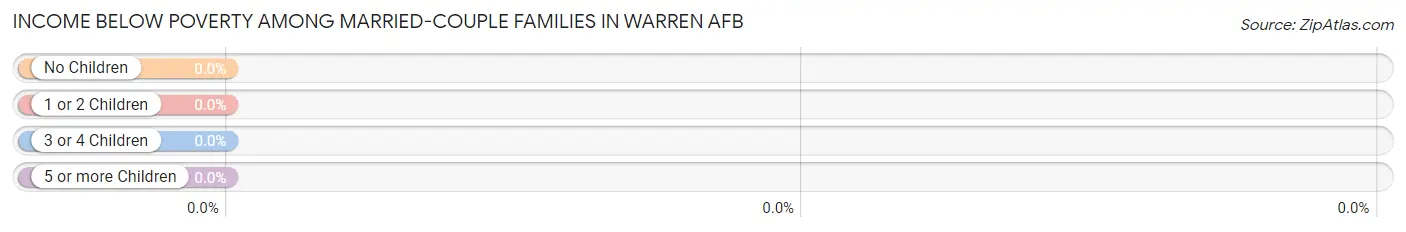
| Children | Above Poverty | Below Poverty |
| No Children | 152 (100.0%) | 0 (0.0%) |
| 1 or 2 Children | 412 (100.0%) | 0 (0.0%) |
| 3 or 4 Children | 61 (100.0%) | 0 (0.0%) |
| 5 or more Children | 0 (0.0%) | 0 (0.0%) |
| Total | 625 (100.0%) | 0 (0.0%) |
Income Below Poverty Among Single-Parent Households in Warren AFB
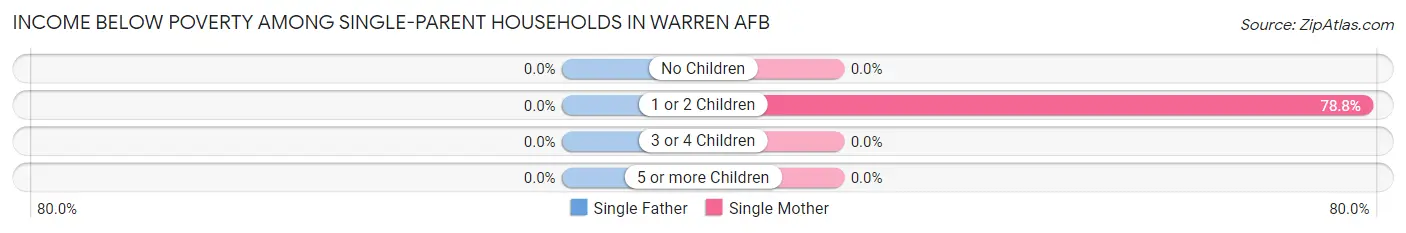
| Children | Single Father | Single Mother |
| No Children | 0 (0.0%) | 0 (0.0%) |
| 1 or 2 Children | 0 (0.0%) | 67 (78.8%) |
| 3 or 4 Children | 0 (0.0%) | 0 (0.0%) |
| 5 or more Children | 0 (0.0%) | 0 (0.0%) |
| Total | 0 (0.0%) | 67 (78.8%) |
Income Below Poverty Among Married-Couple vs Single-Parent Households in Warren AFB
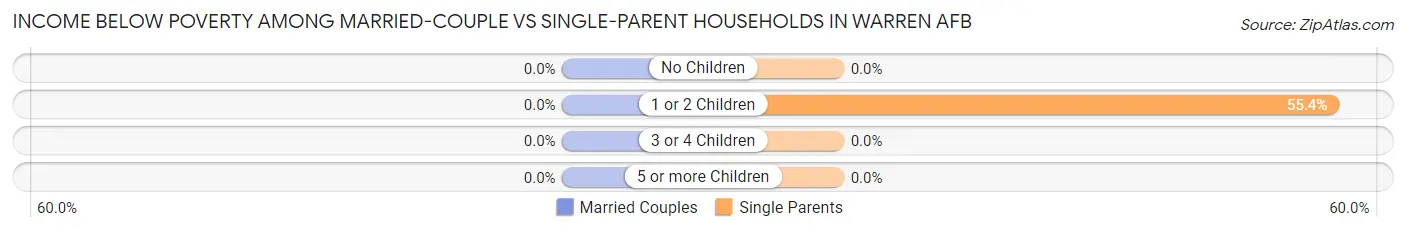
| Children | Married-Couple Families | Single-Parent Households |
| No Children | 0 (0.0%) | 0 (0.0%) |
| 1 or 2 Children | 0 (0.0%) | 67 (55.4%) |
| 3 or 4 Children | 0 (0.0%) | 0 (0.0%) |
| 5 or more Children | 0 (0.0%) | 0 (0.0%) |
| Total | 0 (0.0%) | 67 (55.4%) |
Race in Warren AFB
The most populous races in Warren AFB are White / Caucasian (2,216 | 78.1%), Hispanic or Latino (447 | 15.8%), and Two or more Races (358 | 12.6%).
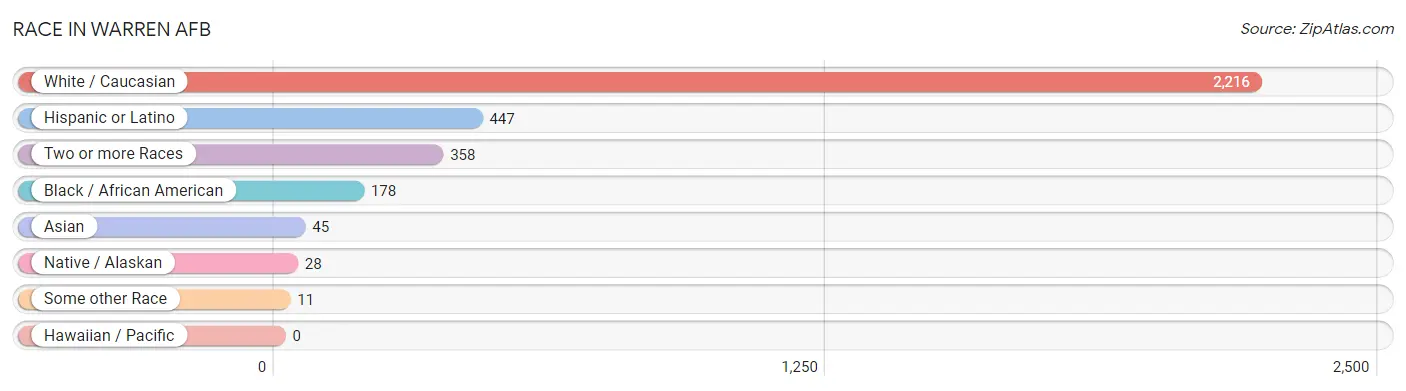
| Race | # Population | % Population |
| Asian | 45 | 1.6% |
| Black / African American | 178 | 6.3% |
| Hawaiian / Pacific | 0 | 0.0% |
| Hispanic or Latino | 447 | 15.8% |
| Native / Alaskan | 28 | 1.0% |
| White / Caucasian | 2,216 | 78.1% |
| Two or more Races | 358 | 12.6% |
| Some other Race | 11 | 0.4% |
| Total | 2,836 | 100.0% |
Ancestry in Warren AFB
The most populous ancestries reported in Warren AFB are German (486 | 17.1%), Mexican (271 | 9.6%), Norwegian (210 | 7.4%), European (188 | 6.6%), and English (186 | 6.6%), together accounting for 47.3% of all Warren AFB residents.
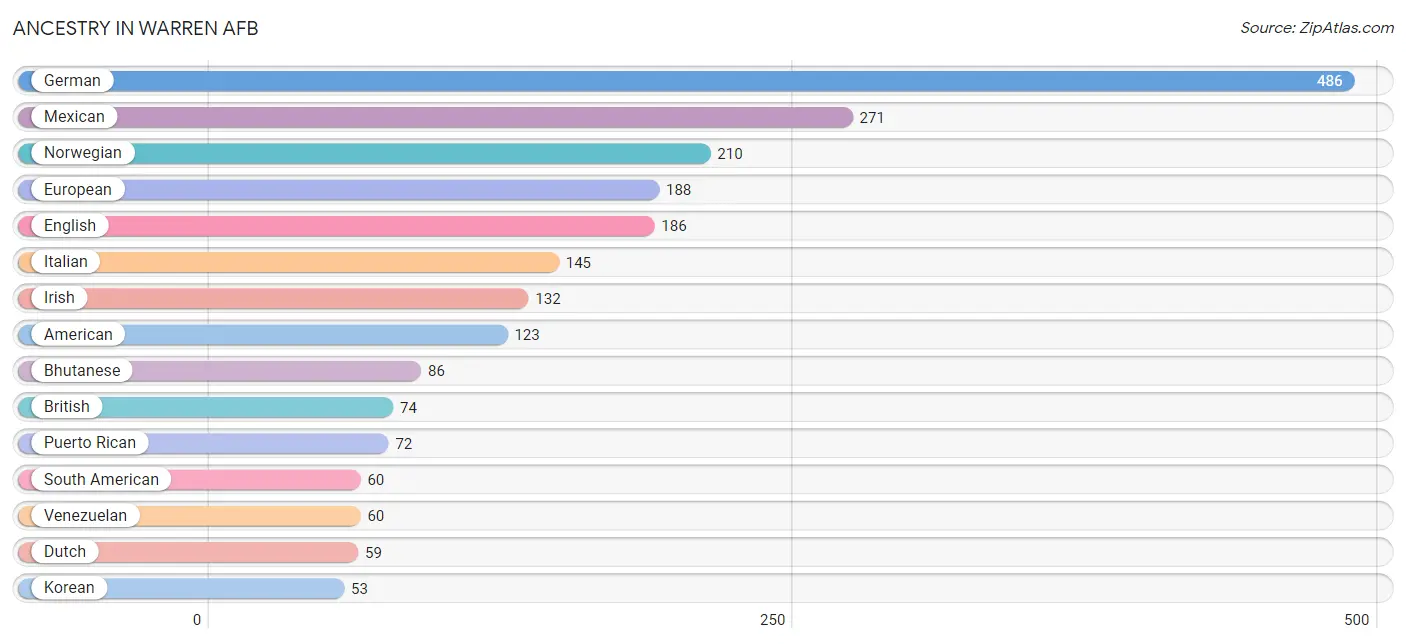
| Ancestry | # Population | % Population |
| African | 19 | 0.7% |
| American | 123 | 4.3% |
| Arab | 1 | 0.0% |
| Bhutanese | 86 | 3.0% |
| Blackfeet | 9 | 0.3% |
| Brazilian | 1 | 0.0% |
| British | 74 | 2.6% |
| Burmese | 3 | 0.1% |
| Celtic | 24 | 0.9% |
| Cherokee | 22 | 0.8% |
| Croatian | 18 | 0.6% |
| Czech | 14 | 0.5% |
| Danish | 39 | 1.4% |
| Dutch | 59 | 2.1% |
| Eastern European | 22 | 0.8% |
| English | 186 | 6.6% |
| European | 188 | 6.6% |
| French | 32 | 1.1% |
| French Canadian | 6 | 0.2% |
| German | 486 | 17.1% |
| Irish | 132 | 4.6% |
| Italian | 145 | 5.1% |
| Jamaican | 2 | 0.1% |
| Korean | 53 | 1.9% |
| Mexican | 271 | 9.6% |
| Norwegian | 210 | 7.4% |
| Palestinian | 1 | 0.0% |
| Polish | 36 | 1.3% |
| Puerto Rican | 72 | 2.5% |
| Russian | 2 | 0.1% |
| Scandinavian | 16 | 0.6% |
| Scotch-Irish | 4 | 0.1% |
| Scottish | 21 | 0.7% |
| Shoshone | 37 | 1.3% |
| South American | 60 | 2.1% |
| Spaniard | 11 | 0.4% |
| Spanish | 11 | 0.4% |
| Subsaharan African | 19 | 0.7% |
| Swedish | 16 | 0.6% |
| Swiss | 4 | 0.1% |
| Venezuelan | 60 | 2.1% |
| Welsh | 35 | 1.2% | View All 42 Rows |
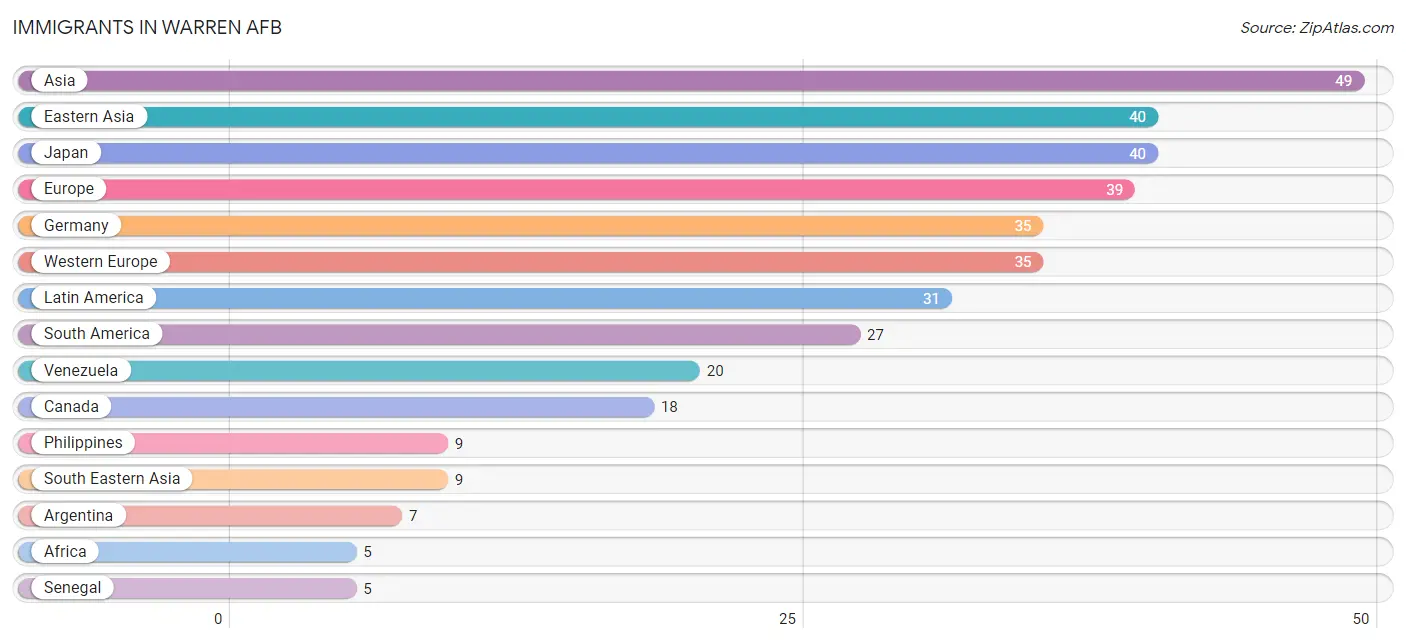
Immigrants in Warren AFB
The most numerous immigrant groups reported in Warren AFB came from Asia (49 | 1.7%), Eastern Asia (40 | 1.4%), Japan (40 | 1.4%), Europe (39 | 1.4%), and Germany (35 | 1.2%), together accounting for 7.2% of all Warren AFB residents.
| Immigration Origin | # Population | % Population |
| Africa | 5 | 0.2% |
| Argentina | 7 | 0.3% |
| Asia | 49 | 1.7% |
| Canada | 18 | 0.6% |
| Central America | 4 | 0.1% |
| Eastern Asia | 40 | 1.4% |
| Europe | 39 | 1.4% |
| Germany | 35 | 1.2% |
| Japan | 40 | 1.4% |
| Latin America | 31 | 1.1% |
| Mexico | 4 | 0.1% |
| Philippines | 9 | 0.3% |
| Senegal | 5 | 0.2% |
| South America | 27 | 0.9% |
| South Eastern Asia | 9 | 0.3% |
| Southern Europe | 4 | 0.1% |
| Spain | 4 | 0.1% |
| Venezuela | 20 | 0.7% |
| Western Africa | 5 | 0.2% |
| Western Europe | 35 | 1.2% | View All 20 Rows |
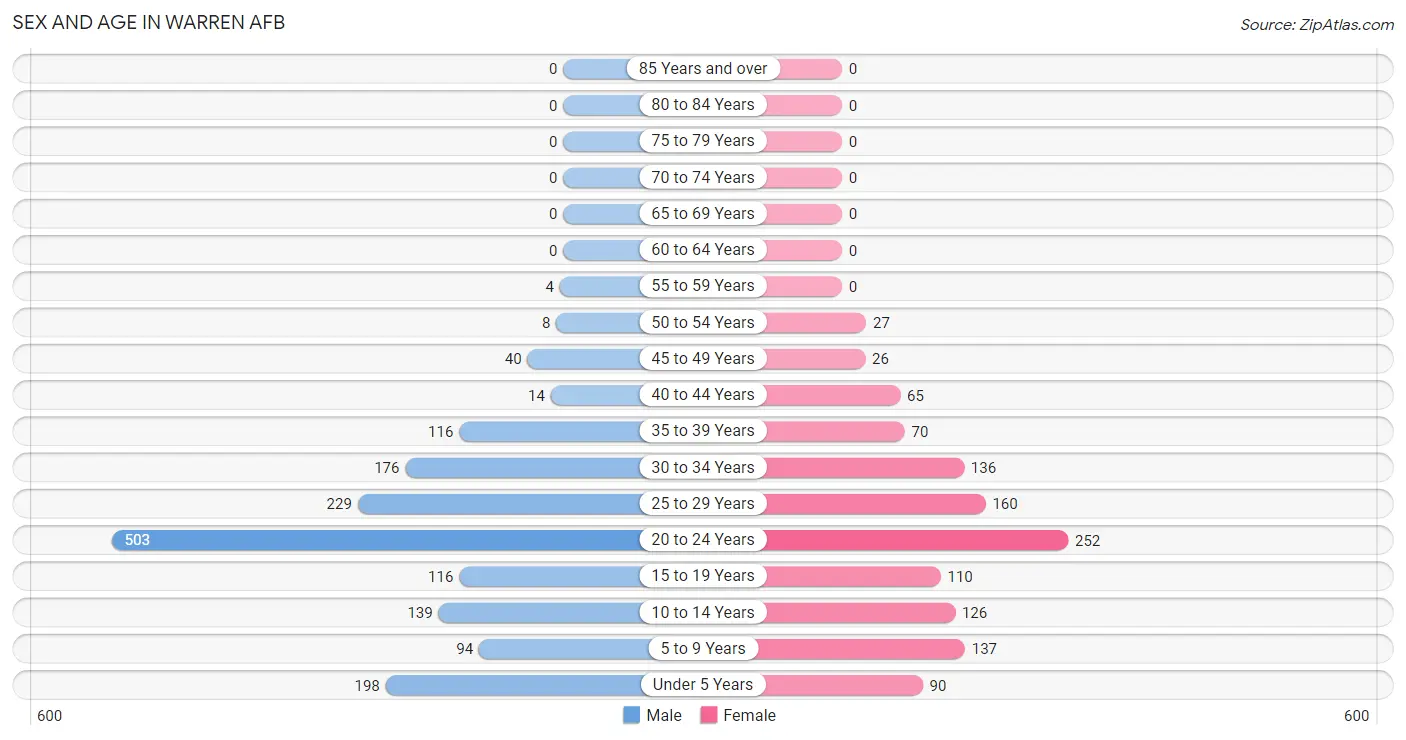
Sex and Age in Warren AFB
Sex and Age in Warren AFB
The most populous age groups in Warren AFB are 20 to 24 Years (503 | 30.7%) for men and 20 to 24 Years (252 | 21.0%) for women.
| Age Bracket | Male | Female |
| Under 5 Years | 198 (12.1%) | 90 (7.5%) |
| 5 to 9 Years | 94 (5.7%) | 137 (11.4%) |
| 10 to 14 Years | 139 (8.5%) | 126 (10.5%) |
| 15 to 19 Years | 116 (7.1%) | 110 (9.2%) |
| 20 to 24 Years | 503 (30.7%) | 252 (21.0%) |
| 25 to 29 Years | 229 (14.0%) | 160 (13.3%) |
| 30 to 34 Years | 176 (10.7%) | 136 (11.3%) |
| 35 to 39 Years | 116 (7.1%) | 70 (5.8%) |
| 40 to 44 Years | 14 (0.9%) | 65 (5.4%) |
| 45 to 49 Years | 40 (2.4%) | 26 (2.2%) |
| 50 to 54 Years | 8 (0.5%) | 27 (2.2%) |
| 55 to 59 Years | 4 (0.2%) | 0 (0.0%) |
| 60 to 64 Years | 0 (0.0%) | 0 (0.0%) |
| 65 to 69 Years | 0 (0.0%) | 0 (0.0%) |
| 70 to 74 Years | 0 (0.0%) | 0 (0.0%) |
| 75 to 79 Years | 0 (0.0%) | 0 (0.0%) |
| 80 to 84 Years | 0 (0.0%) | 0 (0.0%) |
| 85 Years and over | 0 (0.0%) | 0 (0.0%) |
| Total | 1,637 (100.0%) | 1,199 (100.0%) |
Families and Households in Warren AFB
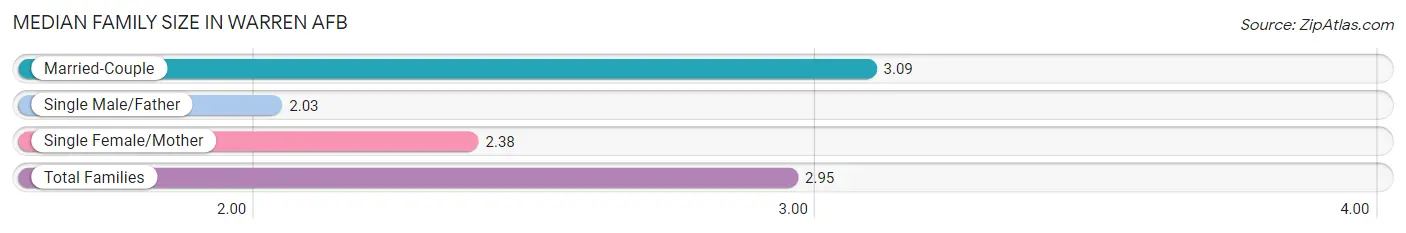
Median Family Size in Warren AFB
The median family size in Warren AFB is 2.95 persons per family, with married-couple families (625 | 83.8%) accounting for the largest median family size of 3.09 persons per family. On the other hand, single male/father families (36 | 4.8%) represent the smallest median family size with 2.03 persons per family.
| Family Type | # Families | Family Size |
| Married-Couple | 625 (83.8%) | 3.09 |
| Single Male/Father | 36 (4.8%) | 2.03 |
| Single Female/Mother | 85 (11.4%) | 2.38 |
| Total Families | 746 (100.0%) | 2.95 |
Median Household Size in Warren AFB
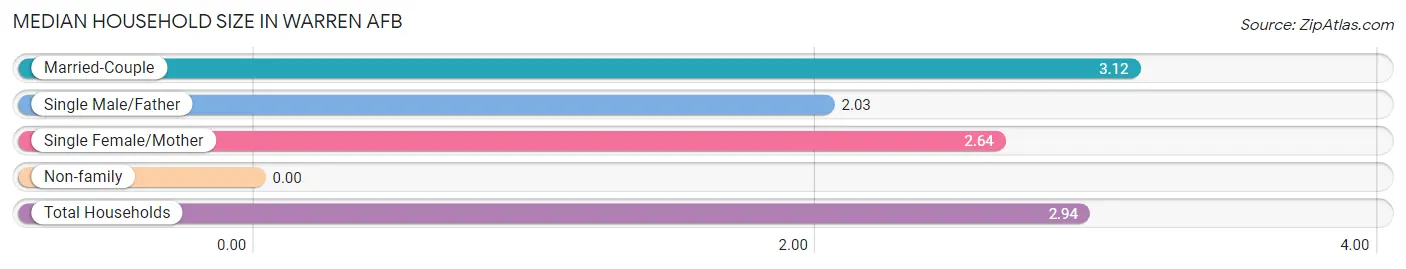
| Household Type | # Households | Household Size |
| Married-Couple | 625 (80.8%) | 3.12 |
| Single Male/Father | 36 (4.7%) | 2.03 |
| Single Female/Mother | 85 (11.0%) | 2.64 |
| Non-family | 27 (3.5%) | - |
| Total Households | 773 (100.0%) | 2.94 |
Household Size by Marriage Status in Warren AFB
Out of a total of 773 households in Warren AFB, 746 (96.5%) are family households, while 27 (3.5%) are nonfamily households. The most numerous type of family households are 3-person households, comprising 239, and the most common type of nonfamily households are 1-person households, comprising 27.
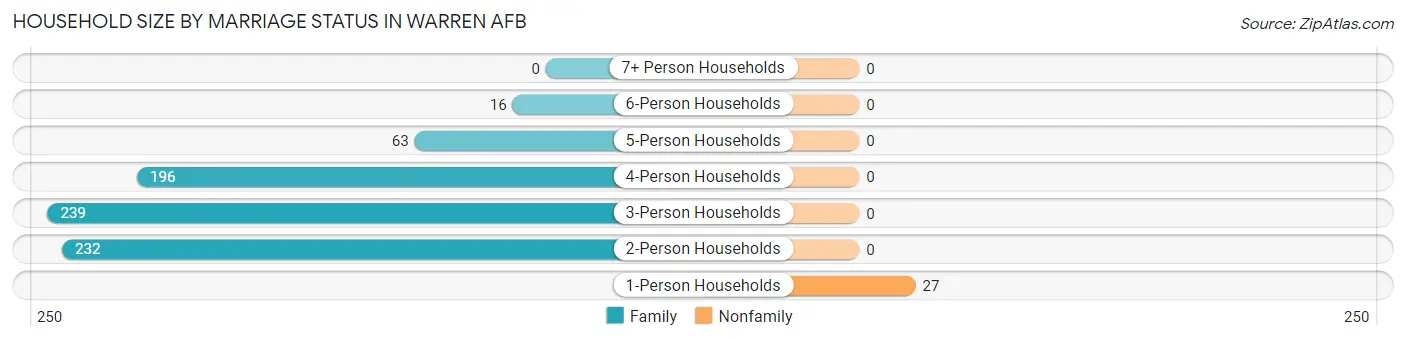
| Household Size | Family Households | Nonfamily Households |
| 1-Person Households | - | 27 (3.5%) |
| 2-Person Households | 232 (30.0%) | 0 (0.0%) |
| 3-Person Households | 239 (30.9%) | 0 (0.0%) |
| 4-Person Households | 196 (25.4%) | 0 (0.0%) |
| 5-Person Households | 63 (8.2%) | 0 (0.0%) |
| 6-Person Households | 16 (2.1%) | 0 (0.0%) |
| 7+ Person Households | 0 (0.0%) | 0 (0.0%) |
| Total | 746 (96.5%) | 27 (3.5%) |
Female Fertility in Warren AFB
Fertility by Age in Warren AFB
Average fertility rate in Warren AFB is 24.0 births per 1,000 women. Women in the age bracket of 20 to 34 years have the highest fertility rate with 36.0 births per 1,000 women. Women in the age bracket of 20 to 34 years acount for 100.0% of all women with births.
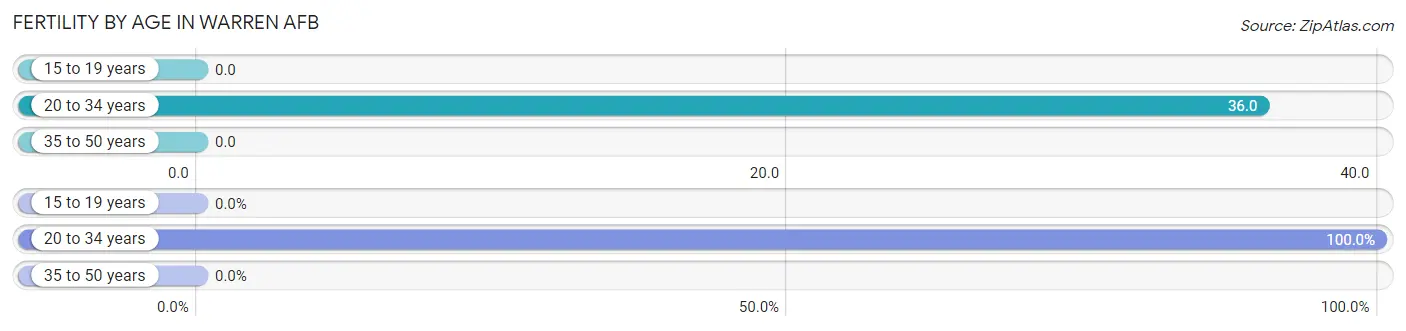
| Age Bracket | Women with Births | Births / 1,000 Women |
| 15 to 19 years | 0 (0.0%) | 0.0 |
| 20 to 34 years | 20 (100.0%) | 36.0 |
| 35 to 50 years | 0 (0.0%) | 0.0 |
| Total | 20 (100.0%) | 24.0 |
Fertility by Age by Marriage Status in Warren AFB
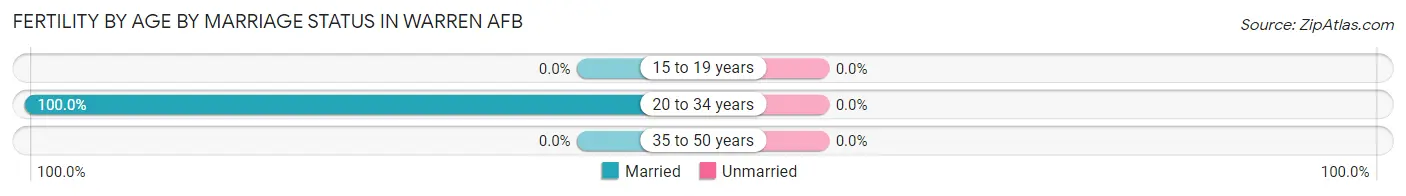
| Age Bracket | Married | Unmarried |
| 15 to 19 years | 0 (0.0%) | 0 (0.0%) |
| 20 to 34 years | 20 (100.0%) | 0 (0.0%) |
| 35 to 50 years | 0 (0.0%) | 0 (0.0%) |
| Total | 20 (100.0%) | 0 (0.0%) |
Fertility by Education in Warren AFB
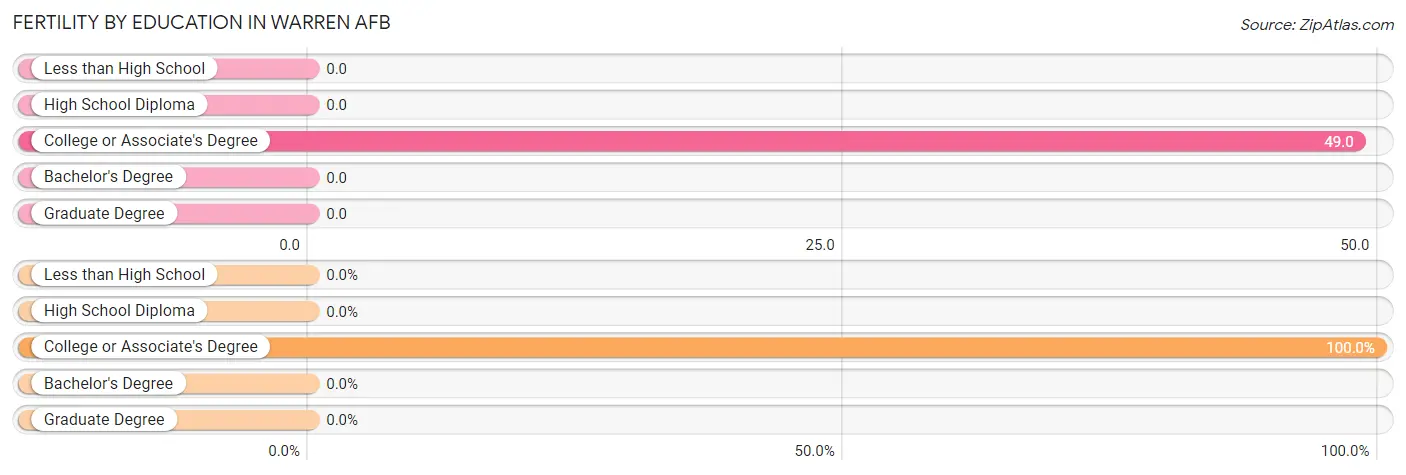
| Educational Attainment | Women with Births | Births / 1,000 Women |
| Less than High School | 0 (0.0%) | 0.0 |
| High School Diploma | 0 (0.0%) | 0.0 |
| College or Associate's Degree | 20 (100.0%) | 49.0 |
| Bachelor's Degree | 0 (0.0%) | 0.0 |
| Graduate Degree | 0 (0.0%) | 0.0 |
| Total | 20 (100.0%) | 24.0 |
Fertility by Education by Marriage Status in Warren AFB
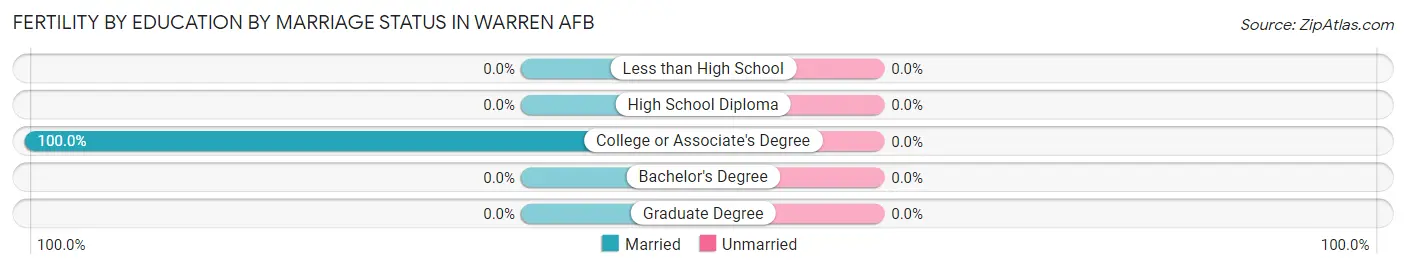
| Educational Attainment | Married | Unmarried |
| Less than High School | 0 (0.0%) | 0 (0.0%) |
| High School Diploma | 0 (0.0%) | 0 (0.0%) |
| College or Associate's Degree | 20 (100.0%) | 0 (0.0%) |
| Bachelor's Degree | 0 (0.0%) | 0 (0.0%) |
| Graduate Degree | 0 (0.0%) | 0 (0.0%) |
| Total | 20 (100.0%) | 0 (0.0%) |
Employment Characteristics in Warren AFB
Employment by Class of Employer in Warren AFB
Among the 1,679 employed individuals in Warren AFB, federal government employees (1,180 | 70.3%), private company employees (319 | 19.0%), and not-for-profit organizations (85 | 5.1%) make up the most common classes of employment.
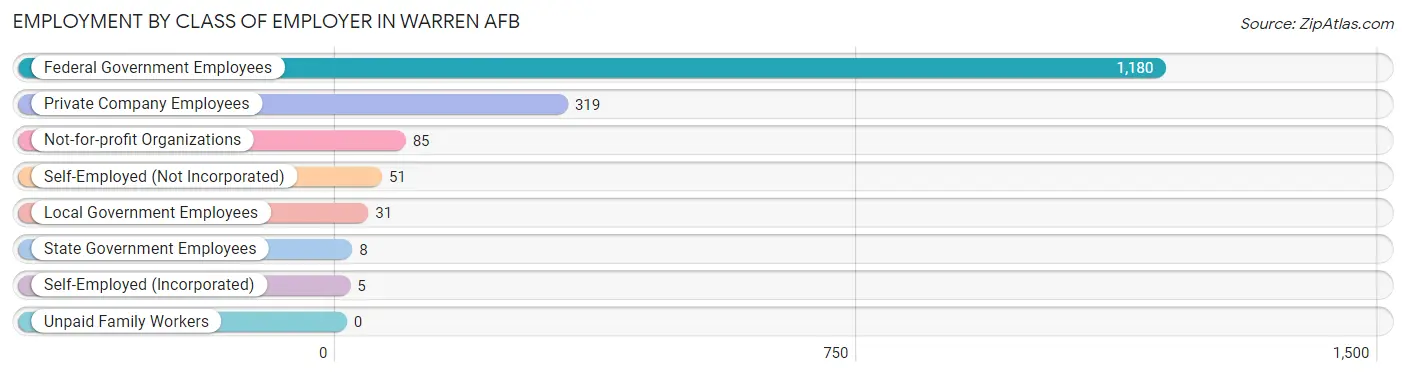
| Employer Class | # Employees | % Employees |
| Private Company Employees | 319 | 19.0% |
| Self-Employed (Incorporated) | 5 | 0.3% |
| Self-Employed (Not Incorporated) | 51 | 3.0% |
| Not-for-profit Organizations | 85 | 5.1% |
| Local Government Employees | 31 | 1.8% |
| State Government Employees | 8 | 0.5% |
| Federal Government Employees | 1,180 | 70.3% |
| Unpaid Family Workers | 0 | 0.0% |
| Total | 1,679 | 100.0% |
Employment Status by Age in Warren AFB
According to the labor force statistics for Warren AFB, out of the total population over 16 years of age (1,994), 89.1% or 1,777 individuals are in the labor force, with 11.8% or 210 of them unemployed. The age group with the highest labor force participation rate is 55 to 59 years, with 100.0% or 4 individuals in the labor force. Within the labor force, the 35 to 44 years age range has the highest percentage of unemployed individuals, with 41.9% or 92 of them being unemployed.
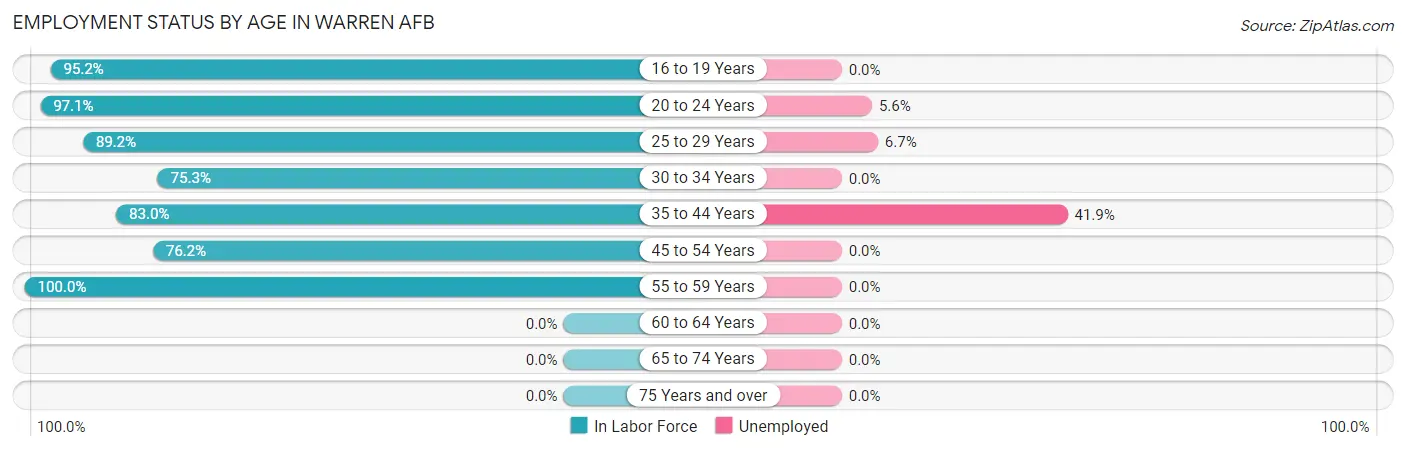
| Age Bracket | In Labor Force | Unemployed |
| 16 to 19 Years | 160 (95.2%) | 0 (0.0%) |
| 20 to 24 Years | 733 (97.1%) | 41 (5.6%) |
| 25 to 29 Years | 347 (89.2%) | 23 (6.7%) |
| 30 to 34 Years | 235 (75.3%) | 0 (0.0%) |
| 35 to 44 Years | 220 (83.0%) | 92 (41.9%) |
| 45 to 54 Years | 77 (76.2%) | 0 (0.0%) |
| 55 to 59 Years | 4 (100.0%) | 0 (0.0%) |
| 60 to 64 Years | 0 (0.0%) | 0 (0.0%) |
| 65 to 74 Years | 0 (0.0%) | 0 (0.0%) |
| 75 Years and over | 0 (0.0%) | 0 (0.0%) |
| Total | 1,777 (89.1%) | 210 (11.8%) |
Employment Status by Educational Attainment in Warren AFB
According to labor force statistics for Warren AFB, 82.4% of individuals (883) out of the total population between 25 and 64 years of age (1,071) are in the labor force, with 14.8% or 131 of them being unemployed. The group with the highest labor force participation rate are those with the educational attainment of college / associate degree, with 84.3% or 381 individuals in the labor force. Within the labor force, individuals with bachelor's degree or higher education have the highest percentage of unemployment, with 41.6% or 154 of them being unemployed.
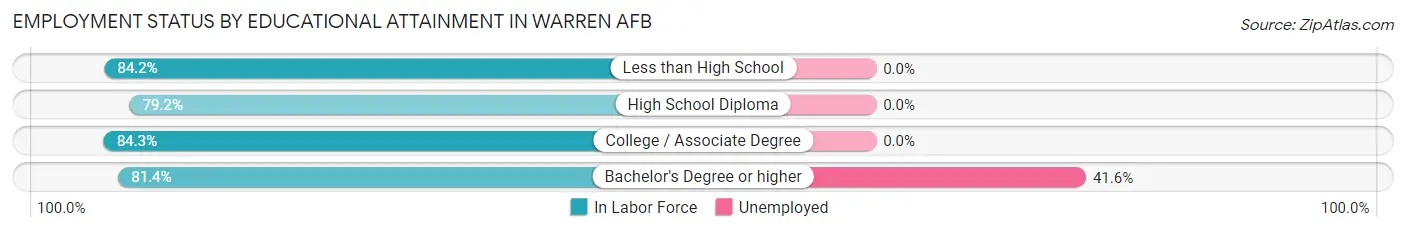
| Educational Attainment | In Labor Force | Unemployed |
| Less than High School | 32 (84.2%) | 0 (0.0%) |
| High School Diploma | 99 (79.2%) | 0 (0.0%) |
| College / Associate Degree | 381 (84.3%) | 0 (0.0%) |
| Bachelor's Degree or higher | 371 (81.4%) | 190 (41.6%) |
| Total | 883 (82.4%) | 159 (14.8%) |
Employment Occupations by Sex in Warren AFB
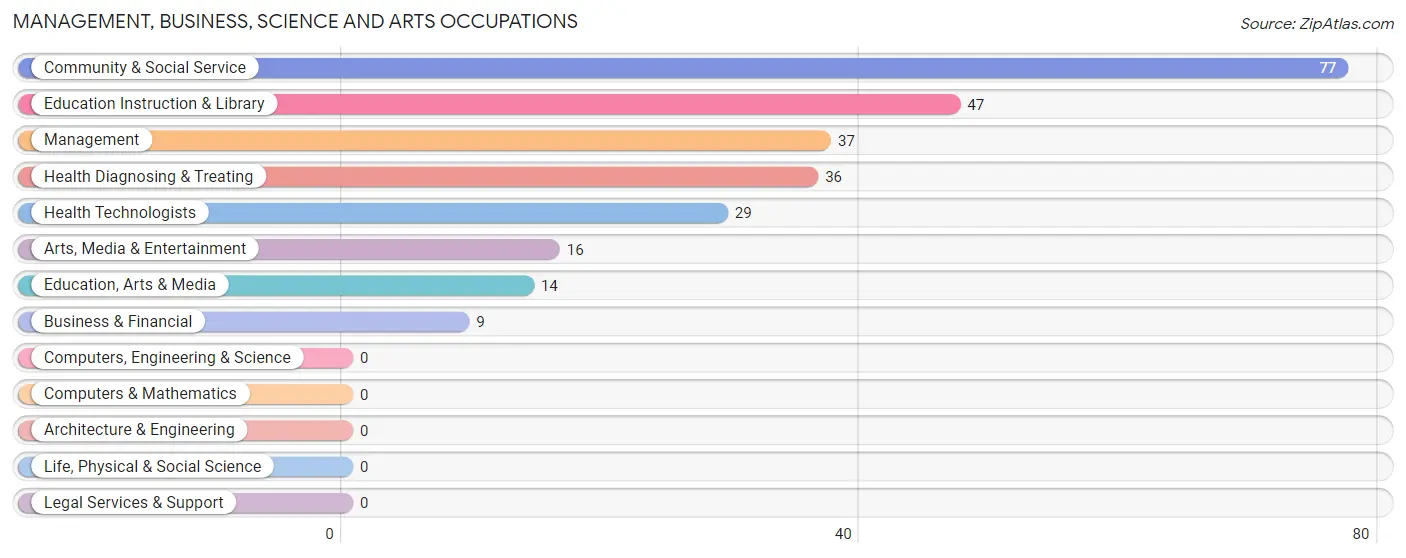
Management, Business, Science and Arts Occupations
The most common Management, Business, Science and Arts occupations in Warren AFB are Community & Social Service (77 | 14.1%), Education Instruction & Library (47 | 8.6%), Management (37 | 6.8%), Health Diagnosing & Treating (36 | 6.6%), and Health Technologists (29 | 5.3%).
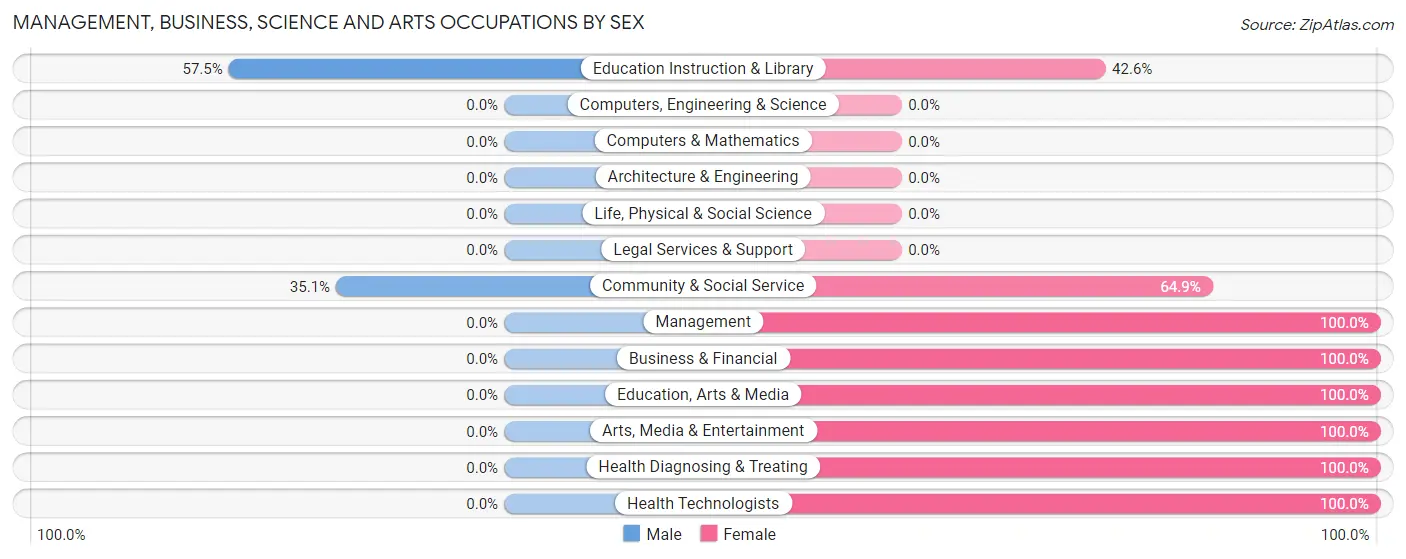
Management, Business, Science and Arts Occupations by Sex
Within the Management, Business, Science and Arts occupations in Warren AFB, the most male-oriented occupations are Education Instruction & Library (57.5%), and Community & Social Service (35.1%), while the most female-oriented occupations are Management (100.0%), Business & Financial (100.0%), and Education, Arts & Media (100.0%).
| Occupation | Male | Female |
| Management | 0 (0.0%) | 37 (100.0%) |
| Business & Financial | 0 (0.0%) | 9 (100.0%) |
| Computers, Engineering & Science | 0 (0.0%) | 0 (0.0%) |
| Computers & Mathematics | 0 (0.0%) | 0 (0.0%) |
| Architecture & Engineering | 0 (0.0%) | 0 (0.0%) |
| Life, Physical & Social Science | 0 (0.0%) | 0 (0.0%) |
| Community & Social Service | 27 (35.1%) | 50 (64.9%) |
| Education, Arts & Media | 0 (0.0%) | 14 (100.0%) |
| Legal Services & Support | 0 (0.0%) | 0 (0.0%) |
| Education Instruction & Library | 27 (57.5%) | 20 (42.5%) |
| Arts, Media & Entertainment | 0 (0.0%) | 16 (100.0%) |
| Health Diagnosing & Treating | 0 (0.0%) | 36 (100.0%) |
| Health Technologists | 0 (0.0%) | 29 (100.0%) |
| Total (Category) | 27 (17.0%) | 132 (83.0%) |
| Total (Overall) | 153 (28.1%) | 391 (71.9%) |
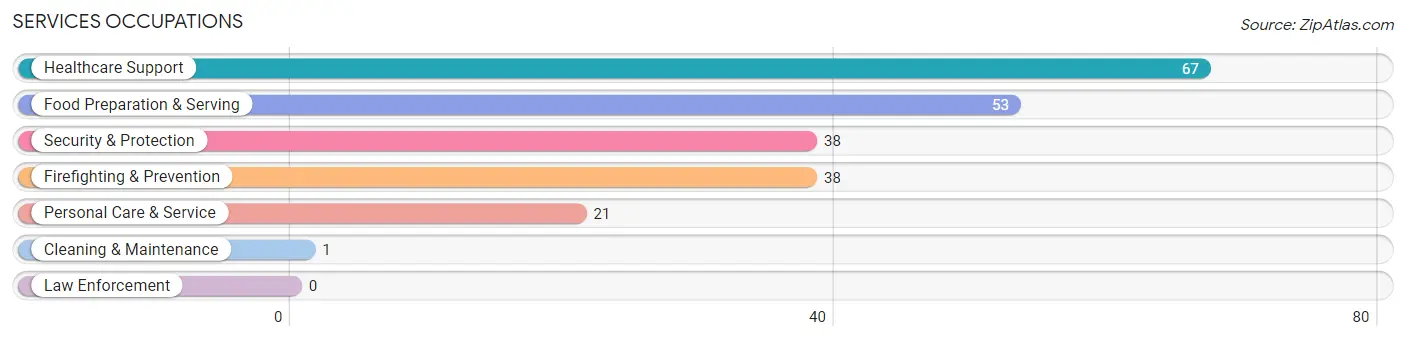
Services Occupations
The most common Services occupations in Warren AFB are Healthcare Support (67 | 12.3%), Food Preparation & Serving (53 | 9.7%), Security & Protection (38 | 7.0%), Firefighting & Prevention (38 | 7.0%), and Personal Care & Service (21 | 3.9%).
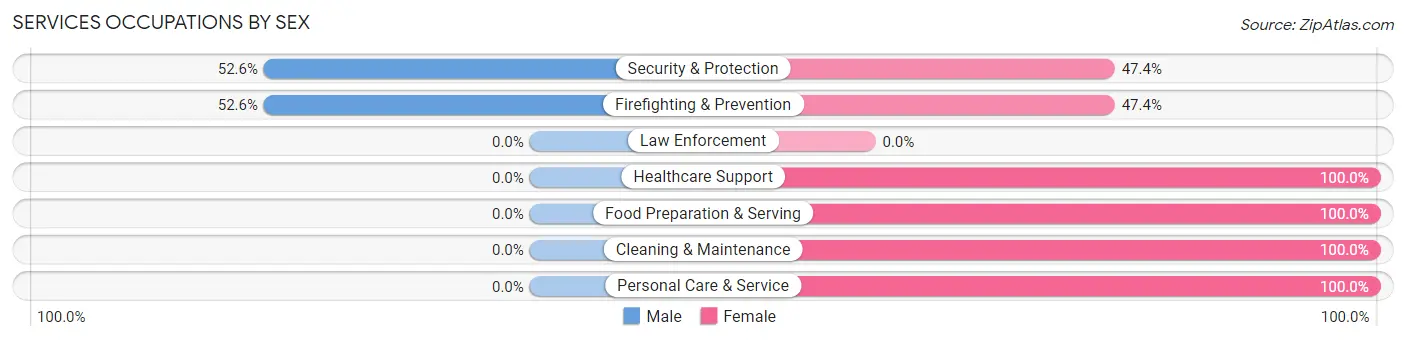
Services Occupations by Sex
Within the Services occupations in Warren AFB, the most male-oriented occupations are Security & Protection (52.6%), and Firefighting & Prevention (52.6%), while the most female-oriented occupations are Healthcare Support (100.0%), Food Preparation & Serving (100.0%), and Cleaning & Maintenance (100.0%).
| Occupation | Male | Female |
| Healthcare Support | 0 (0.0%) | 67 (100.0%) |
| Security & Protection | 20 (52.6%) | 18 (47.4%) |
| Firefighting & Prevention | 20 (52.6%) | 18 (47.4%) |
| Law Enforcement | 0 (0.0%) | 0 (0.0%) |
| Food Preparation & Serving | 0 (0.0%) | 53 (100.0%) |
| Cleaning & Maintenance | 0 (0.0%) | 1 (100.0%) |
| Personal Care & Service | 0 (0.0%) | 21 (100.0%) |
| Total (Category) | 20 (11.1%) | 160 (88.9%) |
| Total (Overall) | 153 (28.1%) | 391 (71.9%) |
Sales and Office Occupations
The most common Sales and Office occupations in Warren AFB are Office & Administration (76 | 14.0%), and Sales & Related (34 | 6.2%).
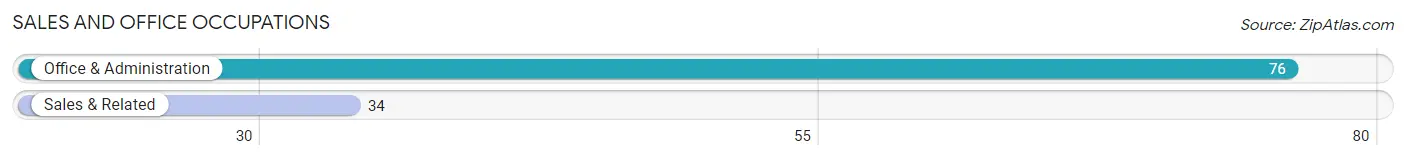
Sales and Office Occupations by Sex
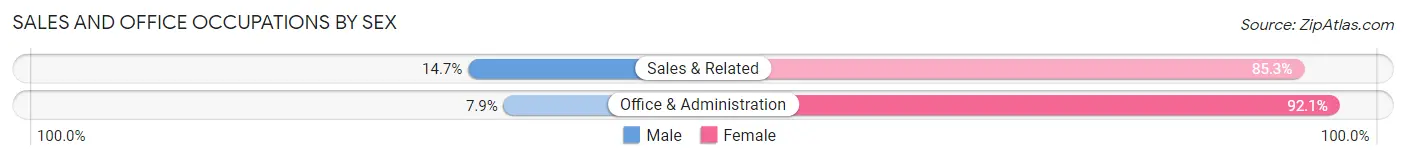
| Occupation | Male | Female |
| Sales & Related | 5 (14.7%) | 29 (85.3%) |
| Office & Administration | 6 (7.9%) | 70 (92.1%) |
| Total (Category) | 11 (10.0%) | 99 (90.0%) |
| Total (Overall) | 153 (28.1%) | 391 (71.9%) |
Natural Resources, Construction and Maintenance Occupations
The most common Natural Resources, Construction and Maintenance occupations in Warren AFB are Construction & Extraction (52 | 9.6%), Installation, Maintenance & Repair (27 | 5.0%), and Farming, Fishing & Forestry (8 | 1.5%).
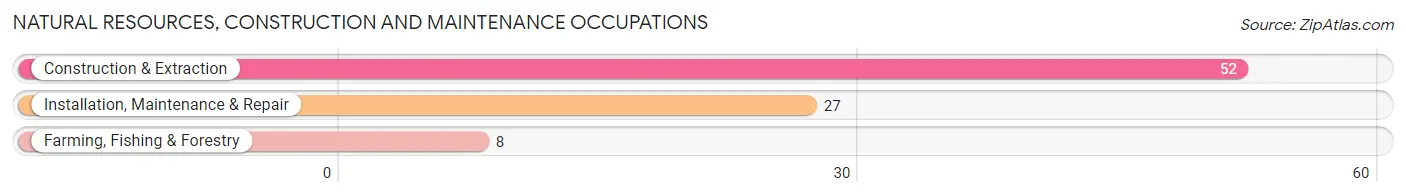
Natural Resources, Construction and Maintenance Occupations by Sex
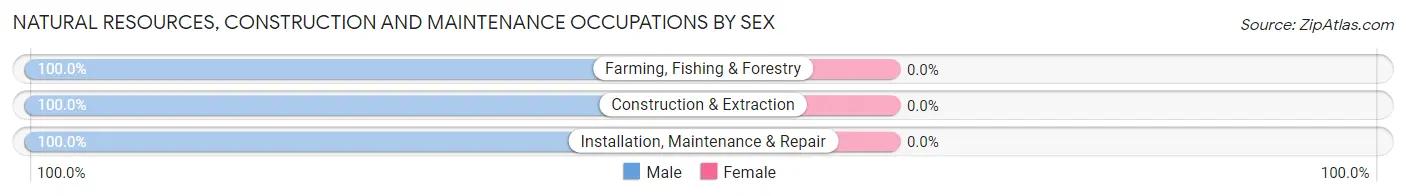
| Occupation | Male | Female |
| Farming, Fishing & Forestry | 8 (100.0%) | 0 (0.0%) |
| Construction & Extraction | 52 (100.0%) | 0 (0.0%) |
| Installation, Maintenance & Repair | 27 (100.0%) | 0 (0.0%) |
| Total (Category) | 87 (100.0%) | 0 (0.0%) |
| Total (Overall) | 153 (28.1%) | 391 (71.9%) |
Production, Transportation and Moving Occupations
The most common Production, Transportation and Moving occupations in Warren AFB are , and Material Moving (8 | 1.5%).
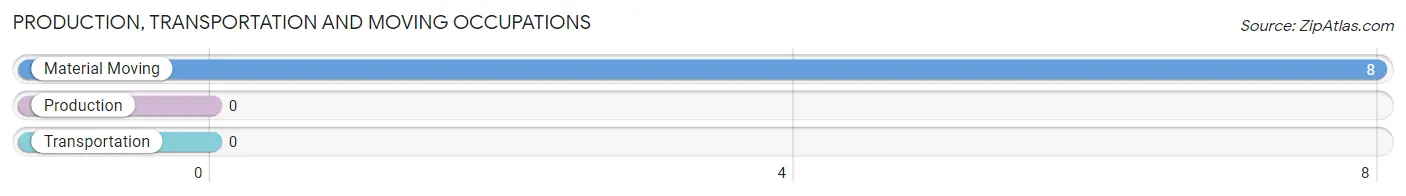
Production, Transportation and Moving Occupations by Sex
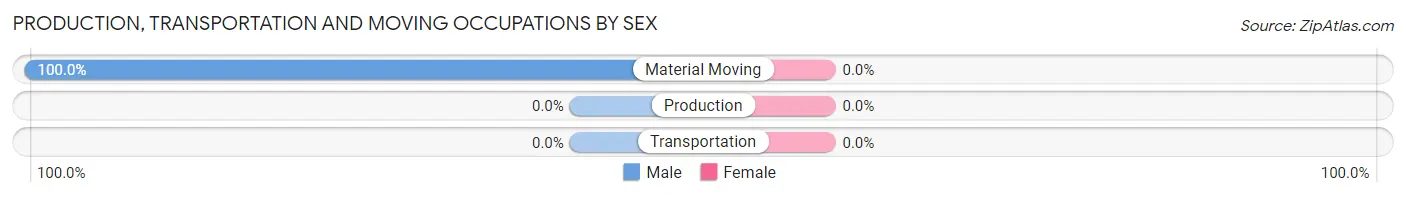
| Occupation | Male | Female |
| Production | 0 (0.0%) | 0 (0.0%) |
| Transportation | 0 (0.0%) | 0 (0.0%) |
| Material Moving | 8 (100.0%) | 0 (0.0%) |
| Total (Category) | 8 (100.0%) | 0 (0.0%) |
| Total (Overall) | 153 (28.1%) | 391 (71.9%) |
Employment Industries by Sex in Warren AFB
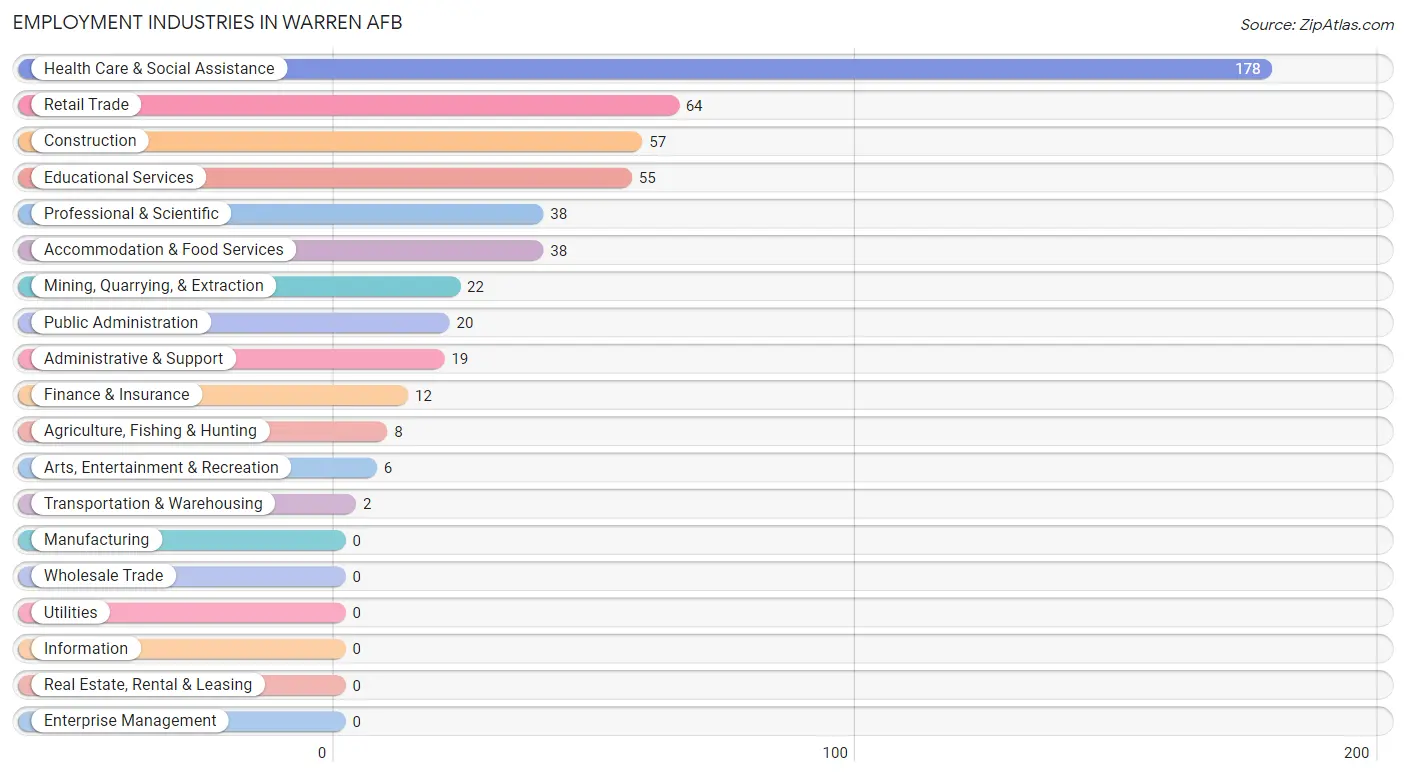
Employment Industries in Warren AFB
The major employment industries in Warren AFB include Health Care & Social Assistance (178 | 32.7%), Retail Trade (64 | 11.8%), Construction (57 | 10.5%), Educational Services (55 | 10.1%), and Professional & Scientific (38 | 7.0%).
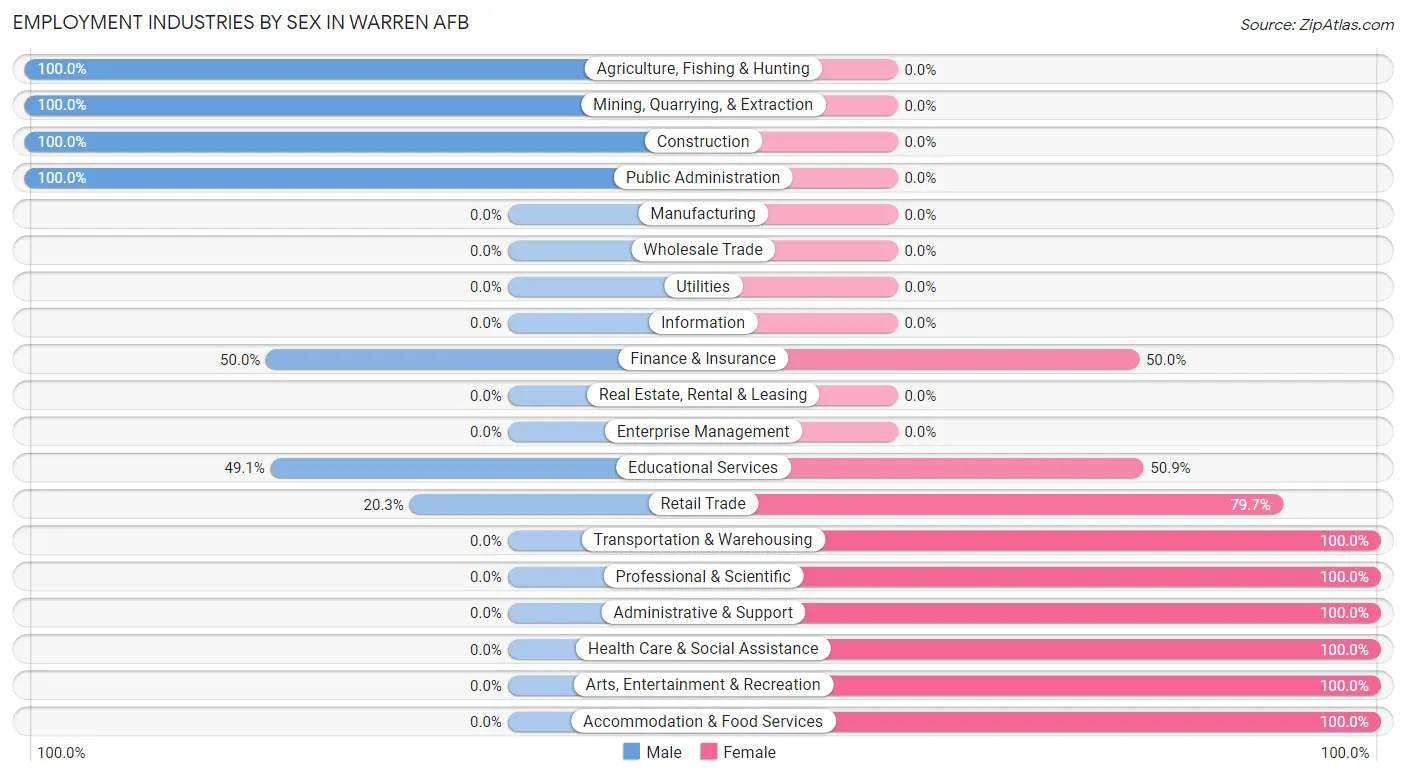
Employment Industries by Sex in Warren AFB
The Warren AFB industries that see more men than women are Agriculture, Fishing & Hunting (100.0%), Mining, Quarrying, & Extraction (100.0%), and Construction (100.0%), whereas the industries that tend to have a higher number of women are Transportation & Warehousing (100.0%), Professional & Scientific (100.0%), and Administrative & Support (100.0%).
| Industry | Male | Female |
| Agriculture, Fishing & Hunting | 8 (100.0%) | 0 (0.0%) |
| Mining, Quarrying, & Extraction | 22 (100.0%) | 0 (0.0%) |
| Construction | 57 (100.0%) | 0 (0.0%) |
| Manufacturing | 0 (0.0%) | 0 (0.0%) |
| Wholesale Trade | 0 (0.0%) | 0 (0.0%) |
| Retail Trade | 13 (20.3%) | 51 (79.7%) |
| Transportation & Warehousing | 0 (0.0%) | 2 (100.0%) |
| Utilities | 0 (0.0%) | 0 (0.0%) |
| Information | 0 (0.0%) | 0 (0.0%) |
| Finance & Insurance | 6 (50.0%) | 6 (50.0%) |
| Real Estate, Rental & Leasing | 0 (0.0%) | 0 (0.0%) |
| Professional & Scientific | 0 (0.0%) | 38 (100.0%) |
| Enterprise Management | 0 (0.0%) | 0 (0.0%) |
| Administrative & Support | 0 (0.0%) | 19 (100.0%) |
| Educational Services | 27 (49.1%) | 28 (50.9%) |
| Health Care & Social Assistance | 0 (0.0%) | 178 (100.0%) |
| Arts, Entertainment & Recreation | 0 (0.0%) | 6 (100.0%) |
| Accommodation & Food Services | 0 (0.0%) | 38 (100.0%) |
| Public Administration | 20 (100.0%) | 0 (0.0%) |
| Total | 153 (28.1%) | 391 (71.9%) |
Education in Warren AFB
School Enrollment in Warren AFB
The most common levels of schooling among the 1,046 students in Warren AFB are college / undergraduate (261 | 24.9%), middle school (211 | 20.2%), and elementary school (193 | 18.4%).
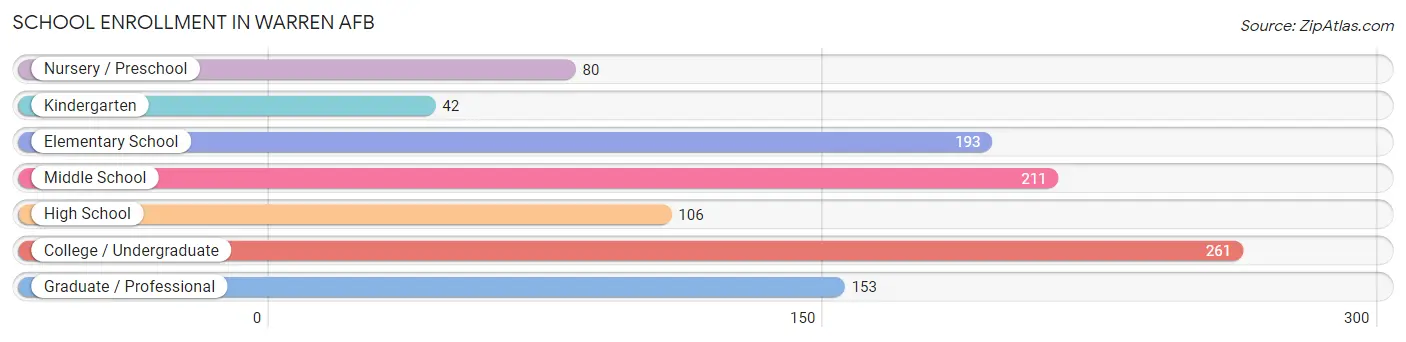
| School Level | # Students | % Students |
| Nursery / Preschool | 80 | 7.6% |
| Kindergarten | 42 | 4.0% |
| Elementary School | 193 | 18.4% |
| Middle School | 211 | 20.2% |
| High School | 106 | 10.1% |
| College / Undergraduate | 261 | 24.9% |
| Graduate / Professional | 153 | 14.6% |
| Total | 1,046 | 100.0% |
School Enrollment by Age by Funding Source in Warren AFB
Out of a total of 1,046 students who are enrolled in schools in Warren AFB, 240 (22.9%) attend a private institution, while the remaining 806 (77.1%) are enrolled in public schools. The age group of 3 to 4 year olds has the highest likelihood of being enrolled in private schools, with 50 (100.0% in the age bracket) enrolled. Conversely, the age group of 15 to 17 year olds has the lowest likelihood of being enrolled in a private school, with 89 (100.0% in the age bracket) attending a public institution.
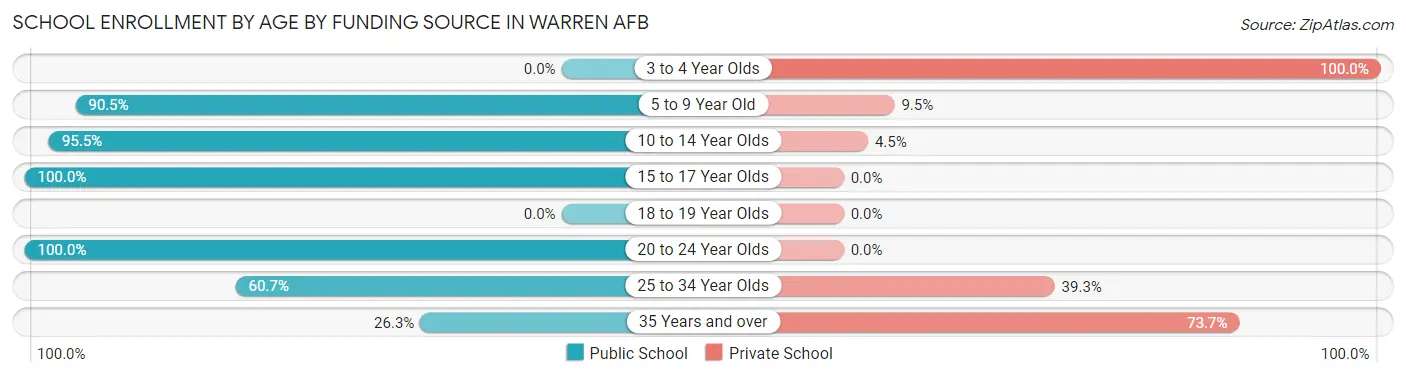
| Age Bracket | Public School | Private School |
| 3 to 4 Year Olds | 0 (0.0%) | 50 (100.0%) |
| 5 to 9 Year Old | 201 (90.5%) | 21 (9.5%) |
| 10 to 14 Year Olds | 253 (95.5%) | 12 (4.5%) |
| 15 to 17 Year Olds | 89 (100.0%) | 0 (0.0%) |
| 18 to 19 Year Olds | 0 (0.0%) | 0 (0.0%) |
| 20 to 24 Year Olds | 87 (100.0%) | 0 (0.0%) |
| 25 to 34 Year Olds | 156 (60.7%) | 101 (39.3%) |
| 35 Years and over | 20 (26.3%) | 56 (73.7%) |
| Total | 806 (77.1%) | 240 (22.9%) |
Educational Attainment by Field of Study in Warren AFB
Social sciences (158 | 32.1%), business (76 | 15.4%), engineering (46 | 9.3%), arts & humanities (45 | 9.1%), and bio, nature & agricultural (25 | 5.1%) are the most common fields of study among 493 individuals in Warren AFB who have obtained a bachelor's degree or higher.
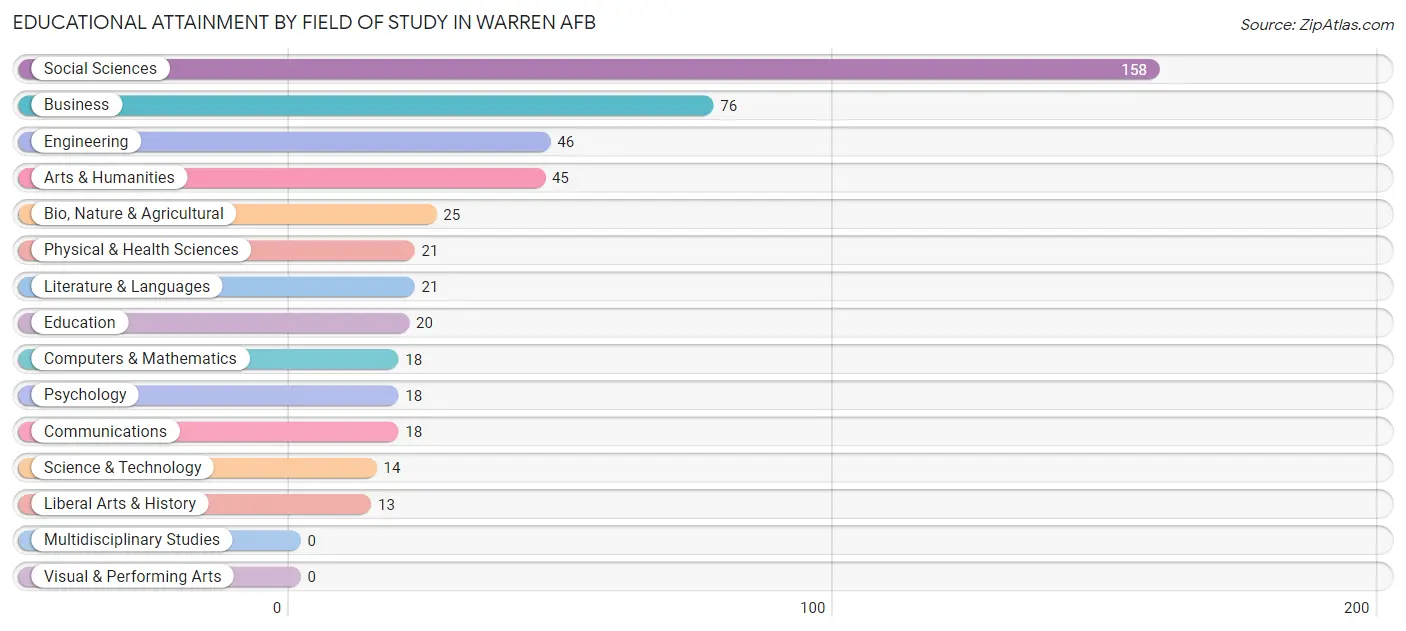
| Field of Study | # Graduates | % Graduates |
| Computers & Mathematics | 18 | 3.6% |
| Bio, Nature & Agricultural | 25 | 5.1% |
| Physical & Health Sciences | 21 | 4.3% |
| Psychology | 18 | 3.6% |
| Social Sciences | 158 | 32.1% |
| Engineering | 46 | 9.3% |
| Multidisciplinary Studies | 0 | 0.0% |
| Science & Technology | 14 | 2.8% |
| Business | 76 | 15.4% |
| Education | 20 | 4.1% |
| Literature & Languages | 21 | 4.3% |
| Liberal Arts & History | 13 | 2.6% |
| Visual & Performing Arts | 0 | 0.0% |
| Communications | 18 | 3.6% |
| Arts & Humanities | 45 | 9.1% |
| Total | 493 | 100.0% |
Transportation & Commute in Warren AFB
Vehicle Availability by Sex in Warren AFB
The most prevalent vehicle ownership categories in Warren AFB are males with 2 vehicles (353, accounting for 53.9%) and females with 2 vehicles (224, making up 76.9%).
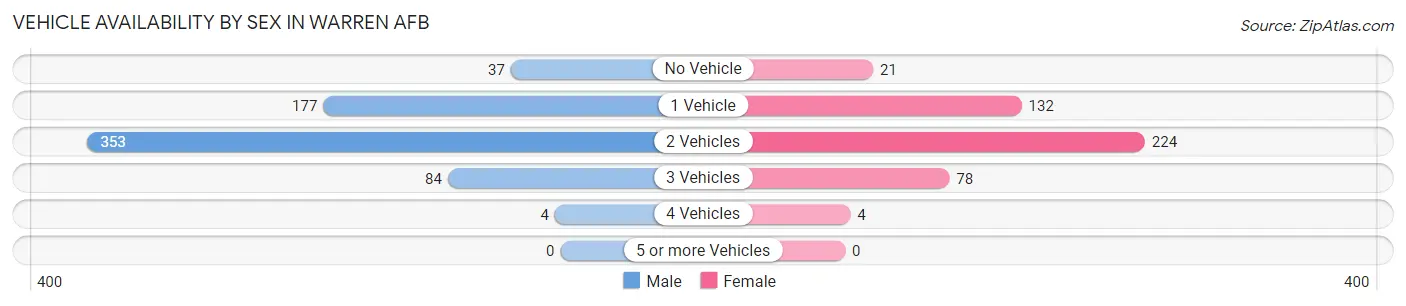
| Vehicles Available | Male | Female |
| No Vehicle | 37 (5.7%) | 21 (4.6%) |
| 1 Vehicle | 177 (27.0%) | 132 (28.8%) |
| 2 Vehicles | 353 (53.9%) | 224 (48.8%) |
| 3 Vehicles | 84 (12.8%) | 78 (17.0%) |
| 4 Vehicles | 4 (0.6%) | 4 (0.9%) |
| 5 or more Vehicles | 0 (0.0%) | 0 (0.0%) |
| Total | 655 (100.0%) | 459 (100.0%) |
Commute Time in Warren AFB
The most frequently occuring commute durations in Warren AFB are 5 to 9 minutes (677 commuters, 41.4%), 10 to 14 minutes (365 commuters, 22.3%), and less than 5 minutes (270 commuters, 16.5%).
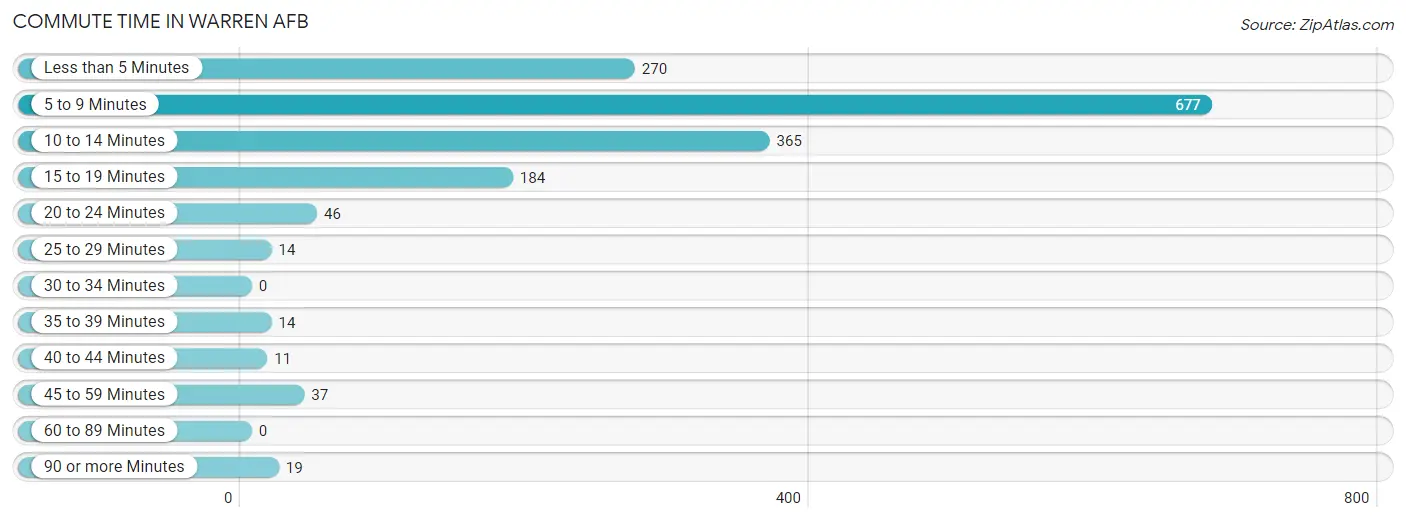
| Commute Time | # Commuters | % Commuters |
| Less than 5 Minutes | 270 | 16.5% |
| 5 to 9 Minutes | 677 | 41.4% |
| 10 to 14 Minutes | 365 | 22.3% |
| 15 to 19 Minutes | 184 | 11.2% |
| 20 to 24 Minutes | 46 | 2.8% |
| 25 to 29 Minutes | 14 | 0.9% |
| 30 to 34 Minutes | 0 | 0.0% |
| 35 to 39 Minutes | 14 | 0.9% |
| 40 to 44 Minutes | 11 | 0.7% |
| 45 to 59 Minutes | 37 | 2.3% |
| 60 to 89 Minutes | 0 | 0.0% |
| 90 or more Minutes | 19 | 1.2% |
Commute Time by Sex in Warren AFB
The most common commute times in Warren AFB are 5 to 9 minutes (590 commuters, 52.6%) for males and 10 to 14 minutes (175 commuters, 33.9%) for females.
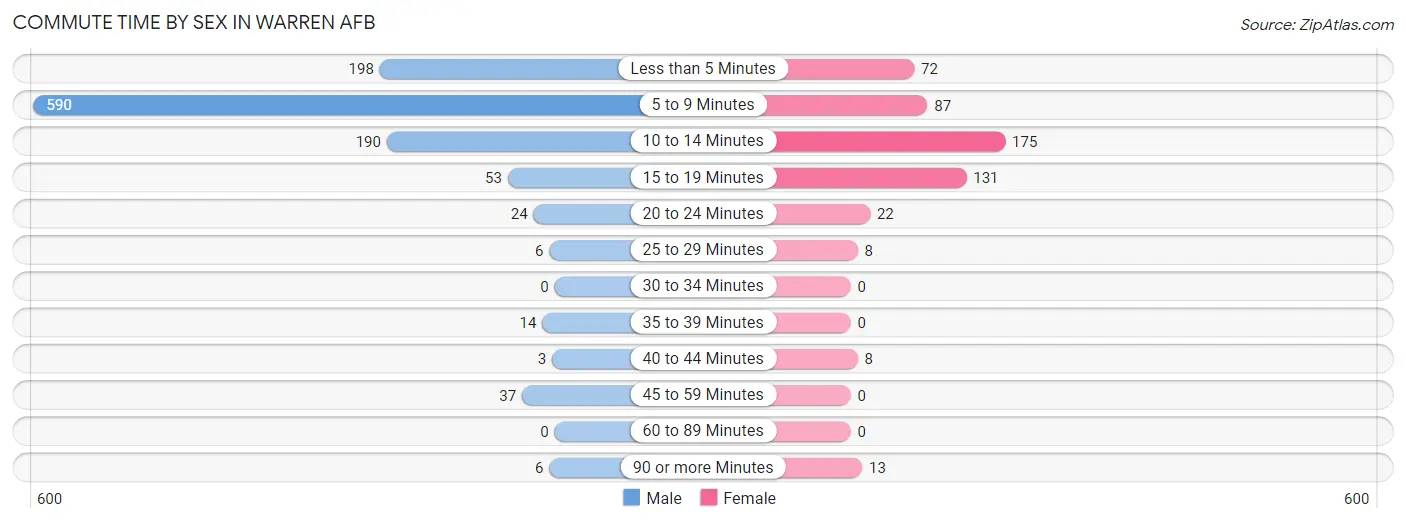
| Commute Time | Male | Female |
| Less than 5 Minutes | 198 (17.7%) | 72 (14.0%) |
| 5 to 9 Minutes | 590 (52.6%) | 87 (16.9%) |
| 10 to 14 Minutes | 190 (17.0%) | 175 (33.9%) |
| 15 to 19 Minutes | 53 (4.7%) | 131 (25.4%) |
| 20 to 24 Minutes | 24 (2.1%) | 22 (4.3%) |
| 25 to 29 Minutes | 6 (0.5%) | 8 (1.5%) |
| 30 to 34 Minutes | 0 (0.0%) | 0 (0.0%) |
| 35 to 39 Minutes | 14 (1.3%) | 0 (0.0%) |
| 40 to 44 Minutes | 3 (0.3%) | 8 (1.5%) |
| 45 to 59 Minutes | 37 (3.3%) | 0 (0.0%) |
| 60 to 89 Minutes | 0 (0.0%) | 0 (0.0%) |
| 90 or more Minutes | 6 (0.5%) | 13 (2.5%) |
Time of Departure to Work by Sex in Warren AFB
The most frequent times of departure to work in Warren AFB are 7:00 AM to 7:29 AM (319, 28.5%) for males and 6:00 AM to 6:29 AM (127, 24.6%) for females.
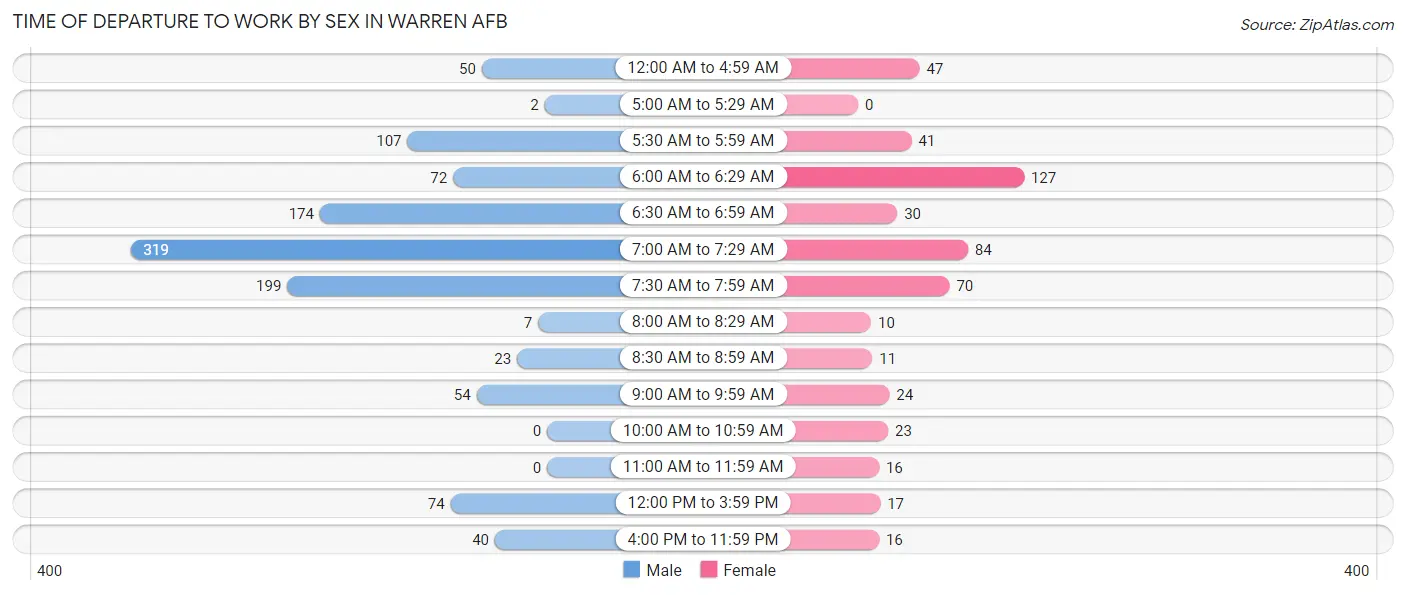
| Time of Departure | Male | Female |
| 12:00 AM to 4:59 AM | 50 (4.5%) | 47 (9.1%) |
| 5:00 AM to 5:29 AM | 2 (0.2%) | 0 (0.0%) |
| 5:30 AM to 5:59 AM | 107 (9.6%) | 41 (8.0%) |
| 6:00 AM to 6:29 AM | 72 (6.4%) | 127 (24.6%) |
| 6:30 AM to 6:59 AM | 174 (15.5%) | 30 (5.8%) |
| 7:00 AM to 7:29 AM | 319 (28.5%) | 84 (16.3%) |
| 7:30 AM to 7:59 AM | 199 (17.7%) | 70 (13.6%) |
| 8:00 AM to 8:29 AM | 7 (0.6%) | 10 (1.9%) |
| 8:30 AM to 8:59 AM | 23 (2.1%) | 11 (2.1%) |
| 9:00 AM to 9:59 AM | 54 (4.8%) | 24 (4.6%) |
| 10:00 AM to 10:59 AM | 0 (0.0%) | 23 (4.5%) |
| 11:00 AM to 11:59 AM | 0 (0.0%) | 16 (3.1%) |
| 12:00 PM to 3:59 PM | 74 (6.6%) | 17 (3.3%) |
| 4:00 PM to 11:59 PM | 40 (3.6%) | 16 (3.1%) |
| Total | 1,121 (100.0%) | 516 (100.0%) |
Housing Occupancy in Warren AFB
Occupancy by Ownership in Warren AFB
Of the total 773 dwellings in Warren AFB, owner-occupied units account for 6 (0.8%), while renter-occupied units make up 767 (99.2%).
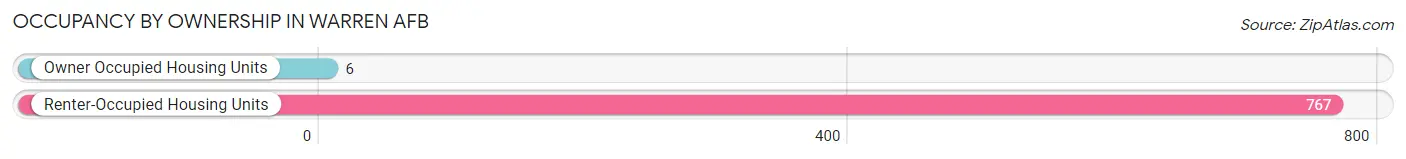
| Occupancy | # Housing Units | % Housing Units |
| Owner Occupied Housing Units | 6 | 0.8% |
| Renter-Occupied Housing Units | 767 | 99.2% |
| Total Occupied Housing Units | 773 | 100.0% |
Occupancy by Household Size in Warren AFB
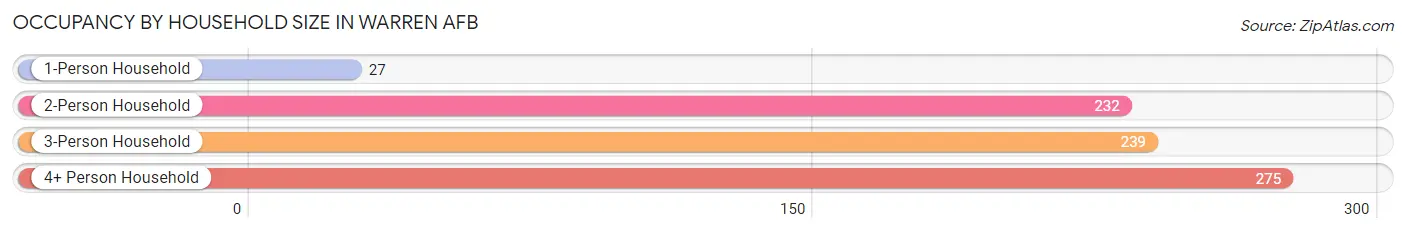
| Household Size | # Housing Units | % Housing Units |
| 1-Person Household | 27 | 3.5% |
| 2-Person Household | 232 | 30.0% |
| 3-Person Household | 239 | 30.9% |
| 4+ Person Household | 275 | 35.6% |
| Total Housing Units | 773 | 100.0% |
Occupancy by Ownership by Household Size in Warren AFB
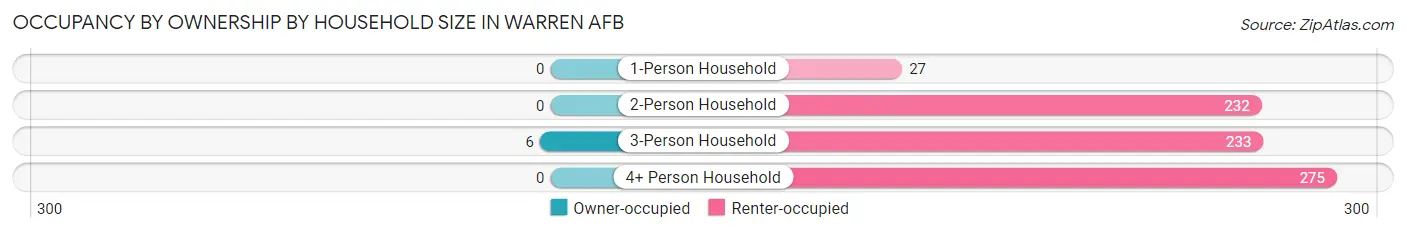
| Household Size | Owner-occupied | Renter-occupied |
| 1-Person Household | 0 (0.0%) | 27 (100.0%) |
| 2-Person Household | 0 (0.0%) | 232 (100.0%) |
| 3-Person Household | 6 (2.5%) | 233 (97.5%) |
| 4+ Person Household | 0 (0.0%) | 275 (100.0%) |
| Total Housing Units | 6 (0.8%) | 767 (99.2%) |
Occupancy by Educational Attainment in Warren AFB
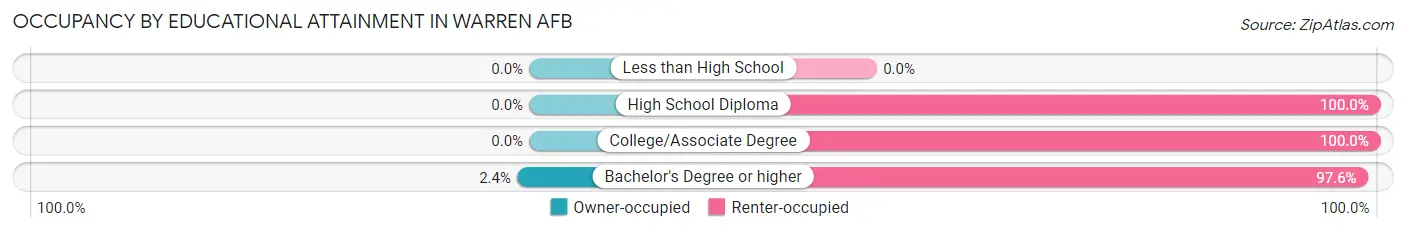
| Household Size | Owner-occupied | Renter-occupied |
| Less than High School | 0 (0.0%) | 0 (0.0%) |
| High School Diploma | 0 (0.0%) | 91 (100.0%) |
| College/Associate Degree | 0 (0.0%) | 433 (100.0%) |
| Bachelor's Degree or higher | 6 (2.4%) | 243 (97.6%) |
Occupancy by Age of Householder in Warren AFB
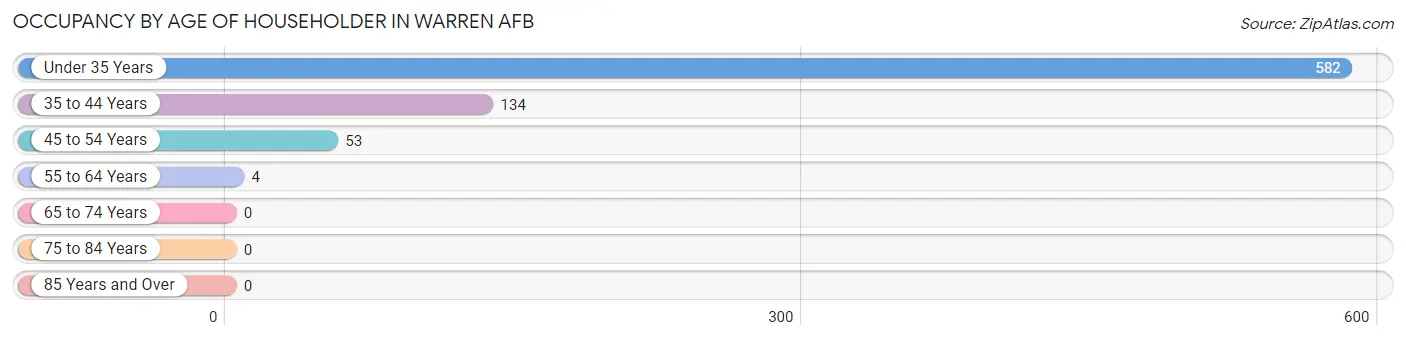
| Age Bracket | # Households | % Households |
| Under 35 Years | 582 | 75.3% |
| 35 to 44 Years | 134 | 17.3% |
| 45 to 54 Years | 53 | 6.9% |
| 55 to 64 Years | 4 | 0.5% |
| 65 to 74 Years | 0 | 0.0% |
| 75 to 84 Years | 0 | 0.0% |
| 85 Years and Over | 0 | 0.0% |
| Total | 773 | 100.0% |
Housing Finances in Warren AFB
Median Income by Occupancy in Warren AFB
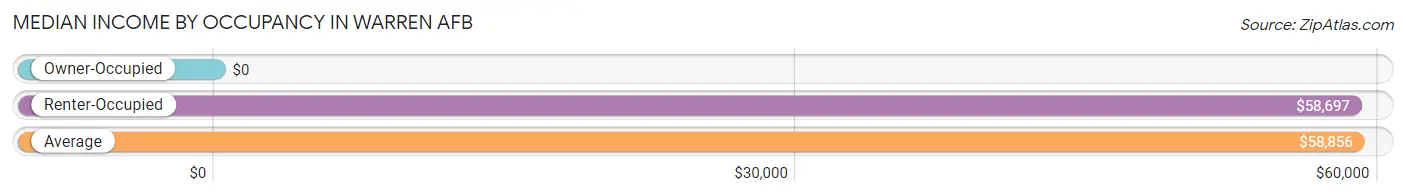
| Occupancy Type | # Households | Median Income |
| Owner-Occupied | 6 (0.8%) | $0 |
| Renter-Occupied | 767 (99.2%) | $58,697 |
| Average | 773 (100.0%) | $58,856 |
Occupancy by Householder Income Bracket in Warren AFB
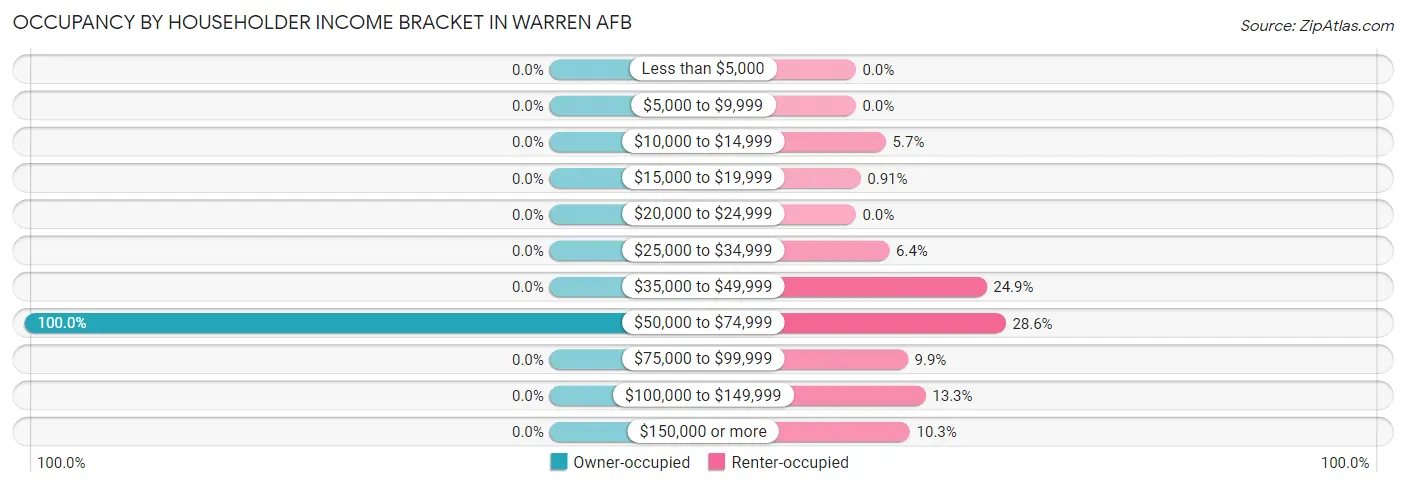
| Income Bracket | Owner-occupied | Renter-occupied |
| Less than $5,000 | 0 (0.0%) | 0 (0.0%) |
| $5,000 to $9,999 | 0 (0.0%) | 0 (0.0%) |
| $10,000 to $14,999 | 0 (0.0%) | 44 (5.7%) |
| $15,000 to $19,999 | 0 (0.0%) | 7 (0.9%) |
| $20,000 to $24,999 | 0 (0.0%) | 0 (0.0%) |
| $25,000 to $34,999 | 0 (0.0%) | 49 (6.4%) |
| $35,000 to $49,999 | 0 (0.0%) | 191 (24.9%) |
| $50,000 to $74,999 | 6 (100.0%) | 219 (28.5%) |
| $75,000 to $99,999 | 0 (0.0%) | 76 (9.9%) |
| $100,000 to $149,999 | 0 (0.0%) | 102 (13.3%) |
| $150,000 or more | 0 (0.0%) | 79 (10.3%) |
| Total | 6 (100.0%) | 767 (100.0%) |
Monthly Housing Cost Tiers in Warren AFB
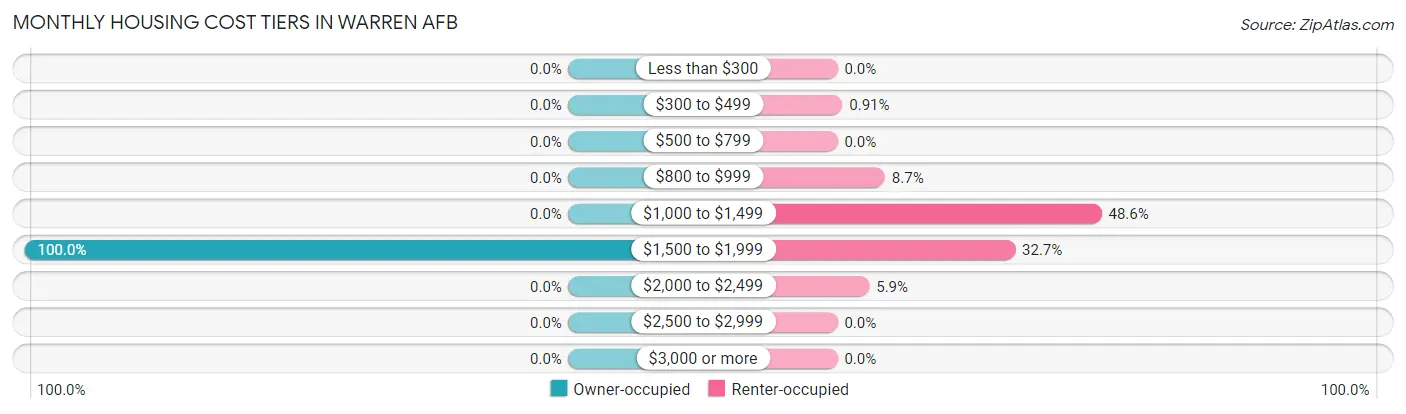
| Monthly Cost | Owner-occupied | Renter-occupied |
| Less than $300 | 0 (0.0%) | 0 (0.0%) |
| $300 to $499 | 0 (0.0%) | 7 (0.9%) |
| $500 to $799 | 0 (0.0%) | 0 (0.0%) |
| $800 to $999 | 0 (0.0%) | 67 (8.7%) |
| $1,000 to $1,499 | 0 (0.0%) | 373 (48.6%) |
| $1,500 to $1,999 | 6 (100.0%) | 251 (32.7%) |
| $2,000 to $2,499 | 0 (0.0%) | 45 (5.9%) |
| $2,500 to $2,999 | 0 (0.0%) | 0 (0.0%) |
| $3,000 or more | 0 (0.0%) | 0 (0.0%) |
| Total | 6 (100.0%) | 767 (100.0%) |
Physical Housing Characteristics in Warren AFB
Housing Structures in Warren AFB
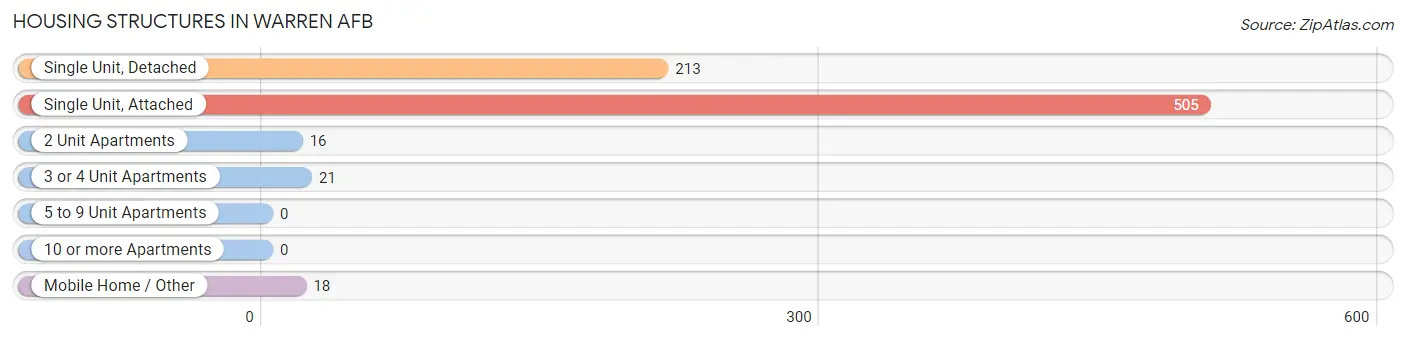
| Structure Type | # Housing Units | % Housing Units |
| Single Unit, Detached | 213 | 27.6% |
| Single Unit, Attached | 505 | 65.3% |
| 2 Unit Apartments | 16 | 2.1% |
| 3 or 4 Unit Apartments | 21 | 2.7% |
| 5 to 9 Unit Apartments | 0 | 0.0% |
| 10 or more Apartments | 0 | 0.0% |
| Mobile Home / Other | 18 | 2.3% |
| Total | 773 | 100.0% |
Housing Structures by Occupancy in Warren AFB
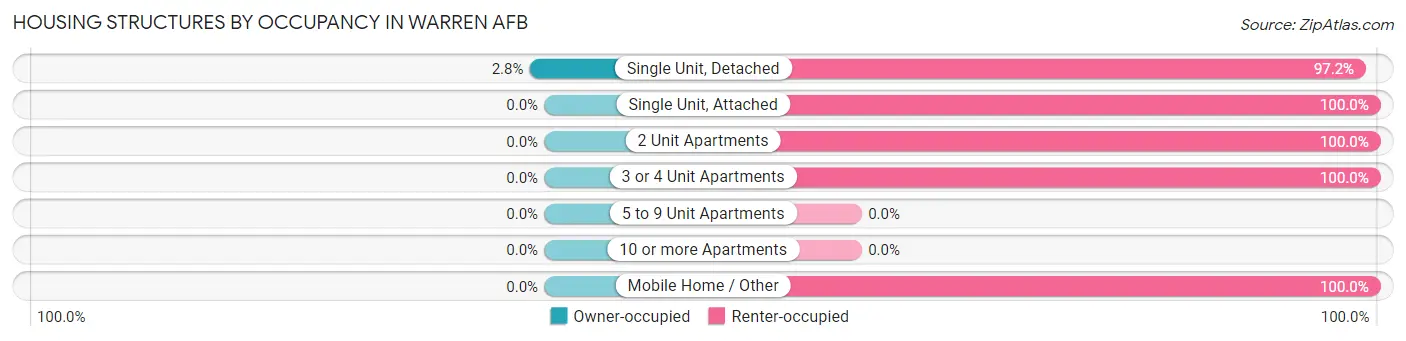
| Structure Type | Owner-occupied | Renter-occupied |
| Single Unit, Detached | 6 (2.8%) | 207 (97.2%) |
| Single Unit, Attached | 0 (0.0%) | 505 (100.0%) |
| 2 Unit Apartments | 0 (0.0%) | 16 (100.0%) |
| 3 or 4 Unit Apartments | 0 (0.0%) | 21 (100.0%) |
| 5 to 9 Unit Apartments | 0 (0.0%) | 0 (0.0%) |
| 10 or more Apartments | 0 (0.0%) | 0 (0.0%) |
| Mobile Home / Other | 0 (0.0%) | 18 (100.0%) |
| Total | 6 (0.8%) | 767 (99.2%) |
Housing Structures by Number of Rooms in Warren AFB
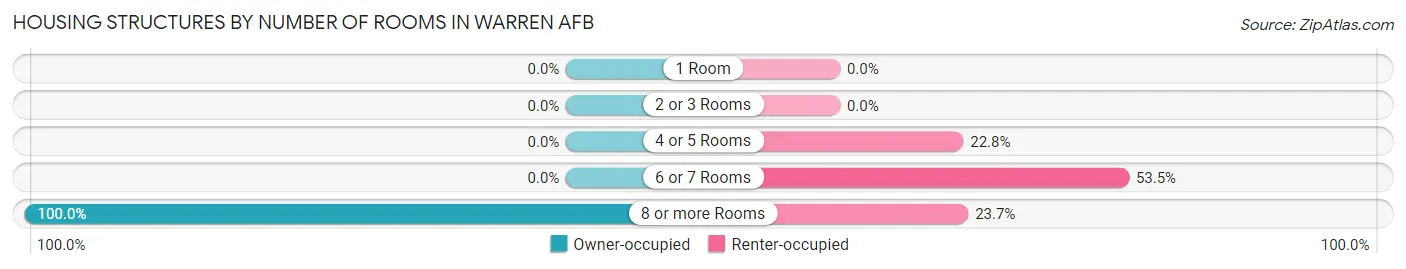
| Number of Rooms | Owner-occupied | Renter-occupied |
| 1 Room | 0 (0.0%) | 0 (0.0%) |
| 2 or 3 Rooms | 0 (0.0%) | 0 (0.0%) |
| 4 or 5 Rooms | 0 (0.0%) | 175 (22.8%) |
| 6 or 7 Rooms | 0 (0.0%) | 410 (53.5%) |
| 8 or more Rooms | 6 (100.0%) | 182 (23.7%) |
| Total | 6 (100.0%) | 767 (100.0%) |
Housing Structure by Heating Type in Warren AFB
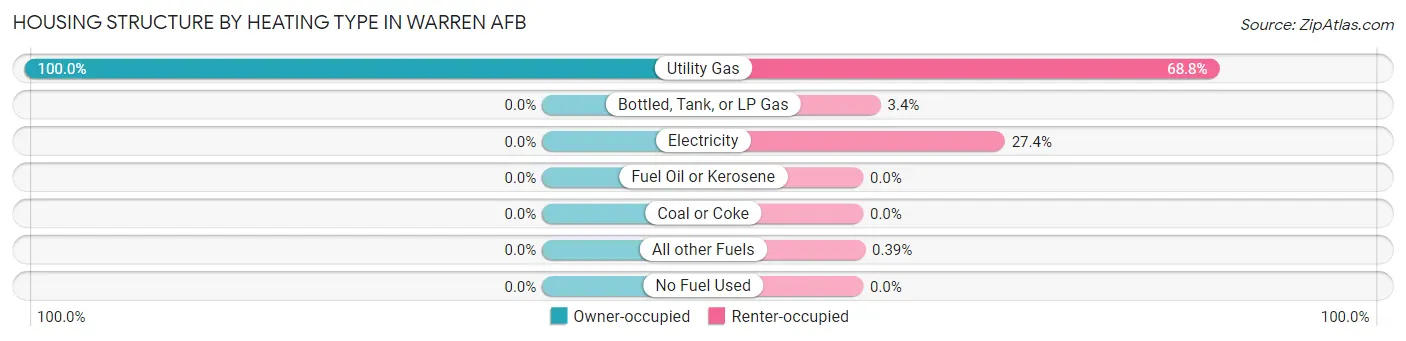
| Heating Type | Owner-occupied | Renter-occupied |
| Utility Gas | 6 (100.0%) | 528 (68.8%) |
| Bottled, Tank, or LP Gas | 0 (0.0%) | 26 (3.4%) |
| Electricity | 0 (0.0%) | 210 (27.4%) |
| Fuel Oil or Kerosene | 0 (0.0%) | 0 (0.0%) |
| Coal or Coke | 0 (0.0%) | 0 (0.0%) |
| All other Fuels | 0 (0.0%) | 3 (0.4%) |
| No Fuel Used | 0 (0.0%) | 0 (0.0%) |
| Total | 6 (100.0%) | 767 (100.0%) |
Household Vehicle Usage in Warren AFB
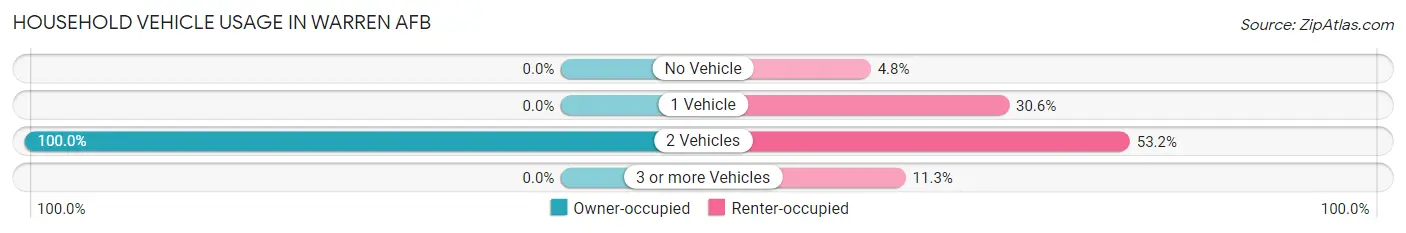
| Vehicles per Household | Owner-occupied | Renter-occupied |
| No Vehicle | 0 (0.0%) | 37 (4.8%) |
| 1 Vehicle | 0 (0.0%) | 235 (30.6%) |
| 2 Vehicles | 6 (100.0%) | 408 (53.2%) |
| 3 or more Vehicles | 0 (0.0%) | 87 (11.3%) |
| Total | 6 (100.0%) | 767 (100.0%) |
Real Estate & Mortgages in Warren AFB
Real Estate and Mortgage Overview in Warren AFB
| Characteristic | Without Mortgage | With Mortgage |
| Housing Units | 0 | 6 |
| Median Property Value | - | - |
| Median Household Income | - | - |
| Monthly Housing Costs | - | - |
| Real Estate Taxes | - | - |
Property Value by Mortgage Status in Warren AFB
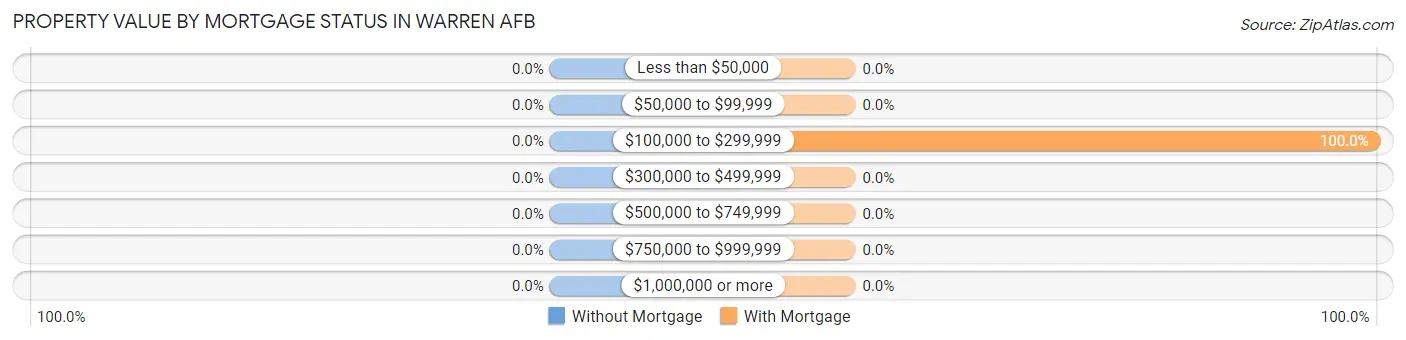
| Property Value | Without Mortgage | With Mortgage |
| Less than $50,000 | 0 (0.0%) | 0 (0.0%) |
| $50,000 to $99,999 | 0 (0.0%) | 0 (0.0%) |
| $100,000 to $299,999 | 0 (0.0%) | 6 (100.0%) |
| $300,000 to $499,999 | 0 (0.0%) | 0 (0.0%) |
| $500,000 to $749,999 | 0 (0.0%) | 0 (0.0%) |
| $750,000 to $999,999 | 0 (0.0%) | 0 (0.0%) |
| $1,000,000 or more | 0 (0.0%) | 0 (0.0%) |
| Total | 0 (0.0%) | 6 (100.0%) |
Household Income by Mortgage Status in Warren AFB
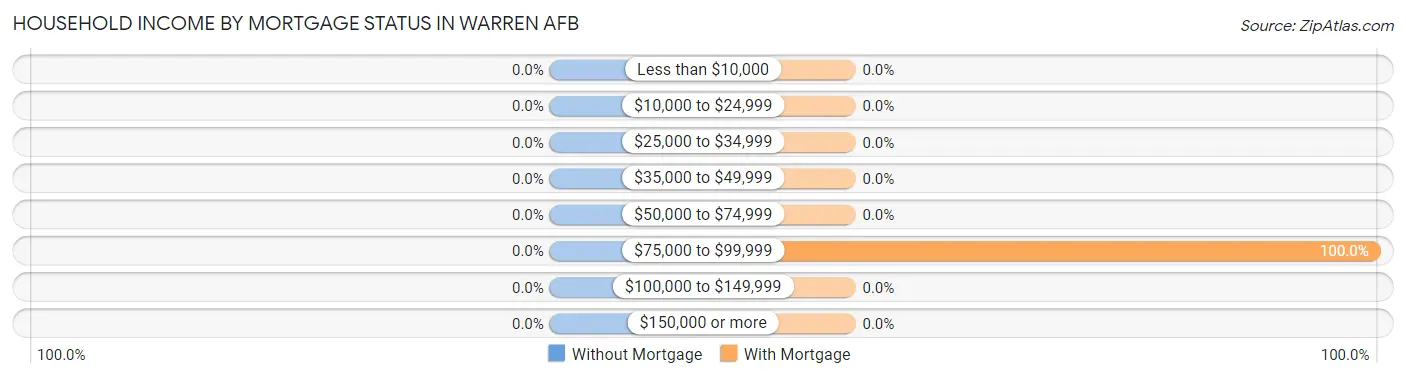
| Household Income | Without Mortgage | With Mortgage |
| Less than $10,000 | 0 (0.0%) | 0 (0.0%) |
| $10,000 to $24,999 | 0 (0.0%) | 0 (0.0%) |
| $25,000 to $34,999 | 0 (0.0%) | 0 (0.0%) |
| $35,000 to $49,999 | 0 (0.0%) | 0 (0.0%) |
| $50,000 to $74,999 | 0 (0.0%) | 0 (0.0%) |
| $75,000 to $99,999 | 0 (0.0%) | 6 (100.0%) |
| $100,000 to $149,999 | 0 (0.0%) | 0 (0.0%) |
| $150,000 or more | 0 (0.0%) | 0 (0.0%) |
| Total | 0 (0.0%) | 6 (100.0%) |
Property Value to Household Income Ratio in Warren AFB
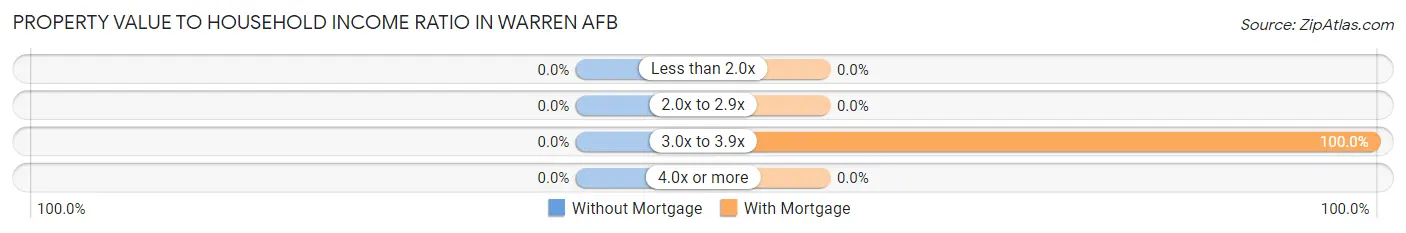
| Value-to-Income Ratio | Without Mortgage | With Mortgage |
| Less than 2.0x | 0 (0.0%) | 0 (0.0%) |
| 2.0x to 2.9x | 0 (0.0%) | 0 (0.0%) |
| 3.0x to 3.9x | 0 (0.0%) | 6 (100.0%) |
| 4.0x or more | 0 (0.0%) | 0 (0.0%) |
| Total | 0 (0.0%) | 6 (100.0%) |
Real Estate Taxes by Mortgage Status in Warren AFB
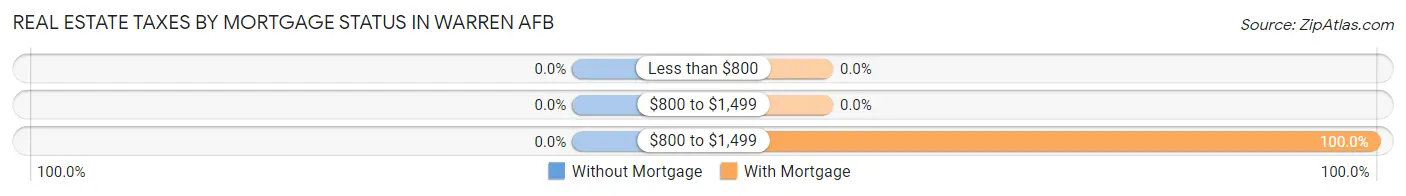
| Property Taxes | Without Mortgage | With Mortgage |
| Less than $800 | 0 (0.0%) | 0 (0.0%) |
| $800 to $1,499 | 0 (0.0%) | 0 (0.0%) |
| $800 to $1,499 | 0 (0.0%) | 6 (100.0%) |
| Total | 0 (0.0%) | 6 (100.0%) |
Health & Disability in Warren AFB
Health Insurance Coverage by Age in Warren AFB
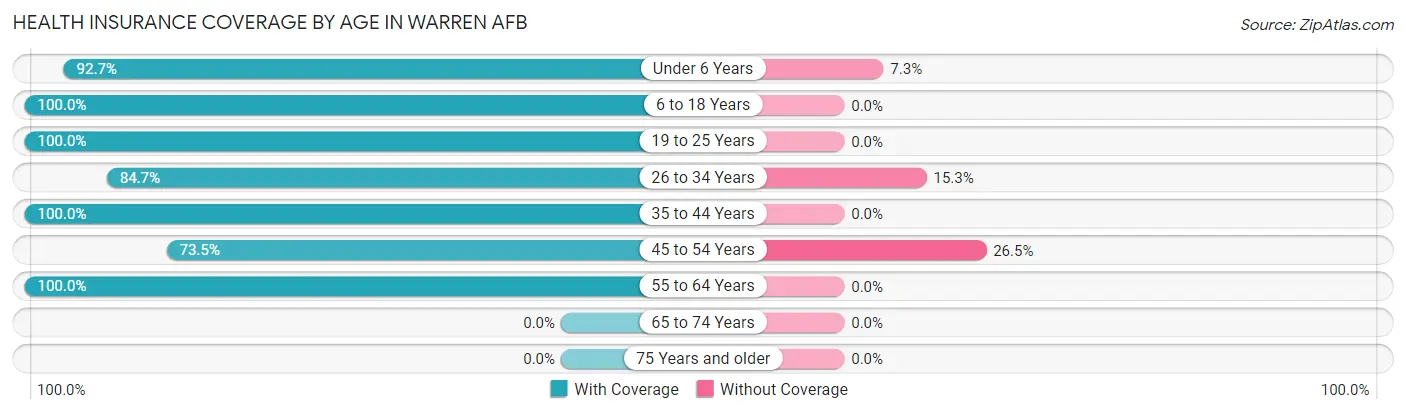
| Age Bracket | With Coverage | Without Coverage |
| Under 6 Years | 318 (92.7%) | 25 (7.3%) |
| 6 to 18 Years | 530 (100.0%) | 0 (0.0%) |
| 19 to 25 Years | 206 (100.0%) | 0 (0.0%) |
| 26 to 34 Years | 298 (84.7%) | 54 (15.3%) |
| 35 to 44 Years | 169 (100.0%) | 0 (0.0%) |
| 45 to 54 Years | 50 (73.5%) | 18 (26.5%) |
| 55 to 64 Years | 4 (100.0%) | 0 (0.0%) |
| 65 to 74 Years | 0 (0.0%) | 0 (0.0%) |
| 75 Years and older | 0 (0.0%) | 0 (0.0%) |
| Total | 1,575 (94.2%) | 97 (5.8%) |
Health Insurance Coverage by Citizenship Status in Warren AFB
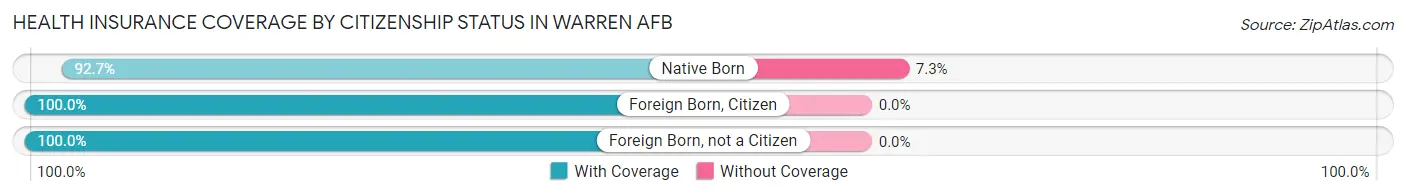
| Citizenship Status | With Coverage | Without Coverage |
| Native Born | 318 (92.7%) | 25 (7.3%) |
| Foreign Born, Citizen | 530 (100.0%) | 0 (0.0%) |
| Foreign Born, not a Citizen | 206 (100.0%) | 0 (0.0%) |
Health Insurance Coverage by Household Income in Warren AFB
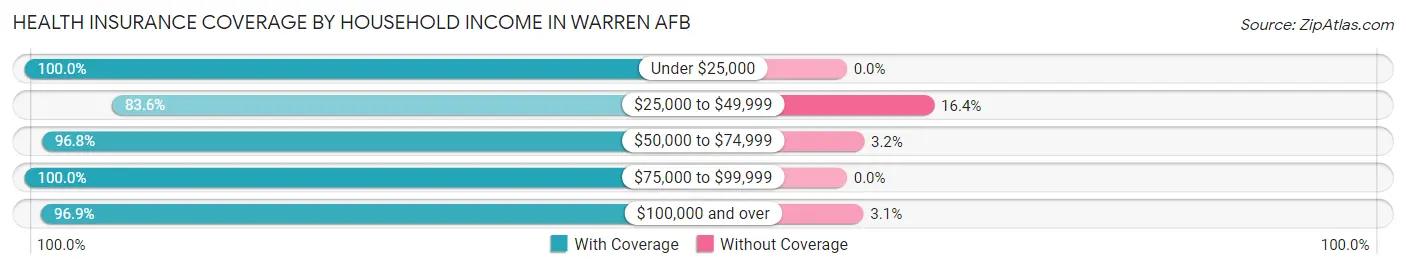
| Household Income | With Coverage | Without Coverage |
| Under $25,000 | 97 (100.0%) | 0 (0.0%) |
| $25,000 to $49,999 | 332 (83.6%) | 65 (16.4%) |
| $50,000 to $74,999 | 479 (96.8%) | 16 (3.2%) |
| $75,000 to $99,999 | 169 (100.0%) | 0 (0.0%) |
| $100,000 and over | 498 (96.9%) | 16 (3.1%) |
Public vs Private Health Insurance Coverage by Age in Warren AFB
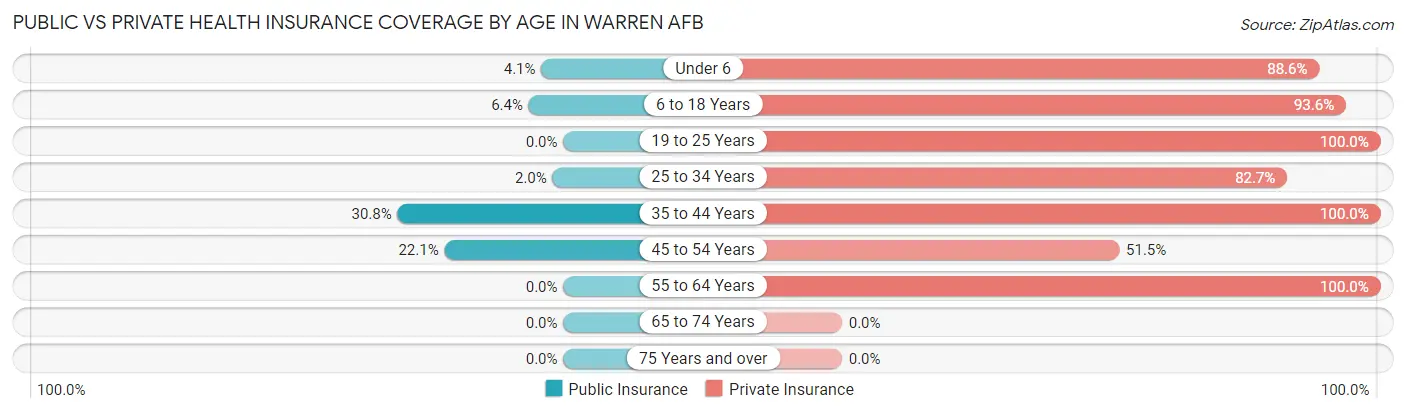
| Age Bracket | Public Insurance | Private Insurance |
| Under 6 | 14 (4.1%) | 304 (88.6%) |
| 6 to 18 Years | 34 (6.4%) | 496 (93.6%) |
| 19 to 25 Years | 0 (0.0%) | 206 (100.0%) |
| 25 to 34 Years | 7 (2.0%) | 291 (82.7%) |
| 35 to 44 Years | 52 (30.8%) | 169 (100.0%) |
| 45 to 54 Years | 15 (22.1%) | 35 (51.5%) |
| 55 to 64 Years | 0 (0.0%) | 4 (100.0%) |
| 65 to 74 Years | 0 (0.0%) | 0 (0.0%) |
| 75 Years and over | 0 (0.0%) | 0 (0.0%) |
| Total | 122 (7.3%) | 1,505 (90.0%) |
Disability Status by Sex by Age in Warren AFB
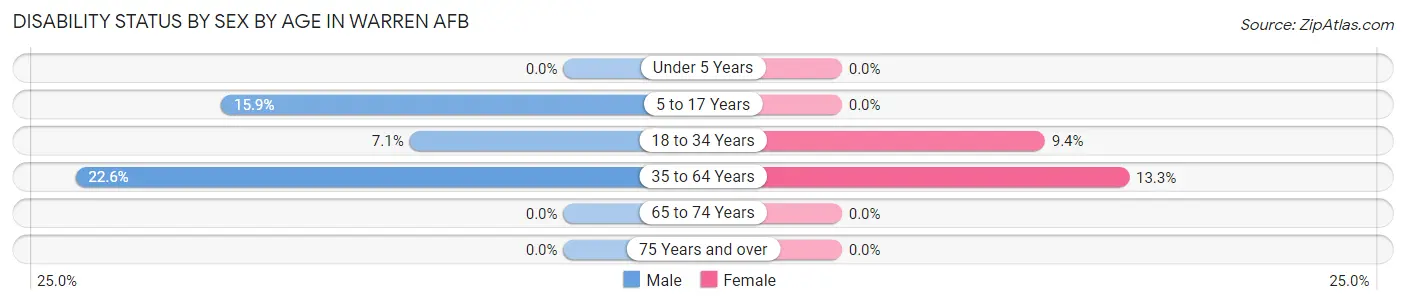
| Age Bracket | Male | Female |
| Under 5 Years | 0 (0.0%) | 0 (0.0%) |
| 5 to 17 Years | 37 (15.9%) | 0 (0.0%) |
| 18 to 34 Years | 8 (7.1%) | 42 (9.4%) |
| 35 to 64 Years | 24 (22.6%) | 18 (13.3%) |
| 65 to 74 Years | 0 (0.0%) | 0 (0.0%) |
| 75 Years and over | 0 (0.0%) | 0 (0.0%) |
Disability Class by Sex by Age in Warren AFB
Disability Class: Hearing Difficulty
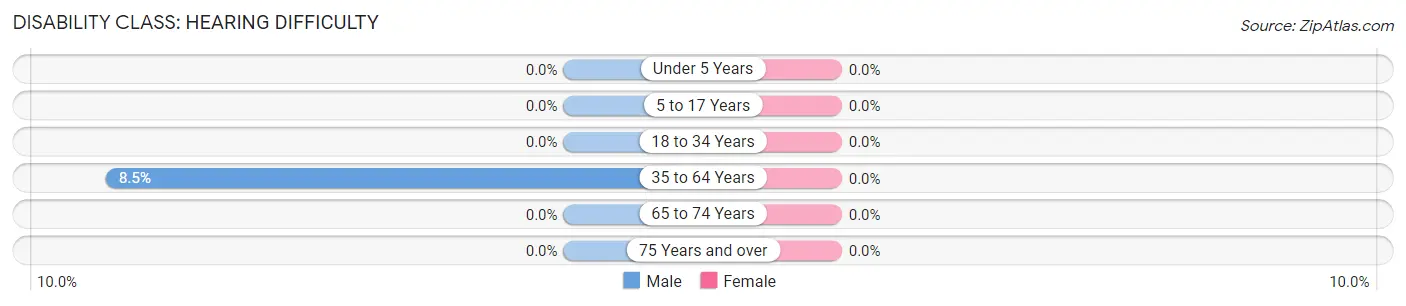
| Age Bracket | Male | Female |
| Under 5 Years | 0 (0.0%) | 0 (0.0%) |
| 5 to 17 Years | 0 (0.0%) | 0 (0.0%) |
| 18 to 34 Years | 0 (0.0%) | 0 (0.0%) |
| 35 to 64 Years | 9 (8.5%) | 0 (0.0%) |
| 65 to 74 Years | 0 (0.0%) | 0 (0.0%) |
| 75 Years and over | 0 (0.0%) | 0 (0.0%) |
Disability Class: Vision Difficulty
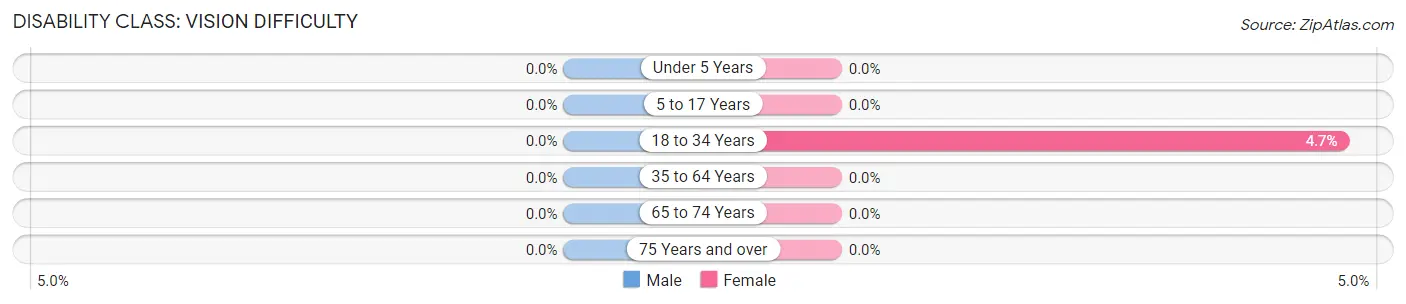
| Age Bracket | Male | Female |
| Under 5 Years | 0 (0.0%) | 0 (0.0%) |
| 5 to 17 Years | 0 (0.0%) | 0 (0.0%) |
| 18 to 34 Years | 0 (0.0%) | 21 (4.7%) |
| 35 to 64 Years | 0 (0.0%) | 0 (0.0%) |
| 65 to 74 Years | 0 (0.0%) | 0 (0.0%) |
| 75 Years and over | 0 (0.0%) | 0 (0.0%) |
Disability Class: Cognitive Difficulty
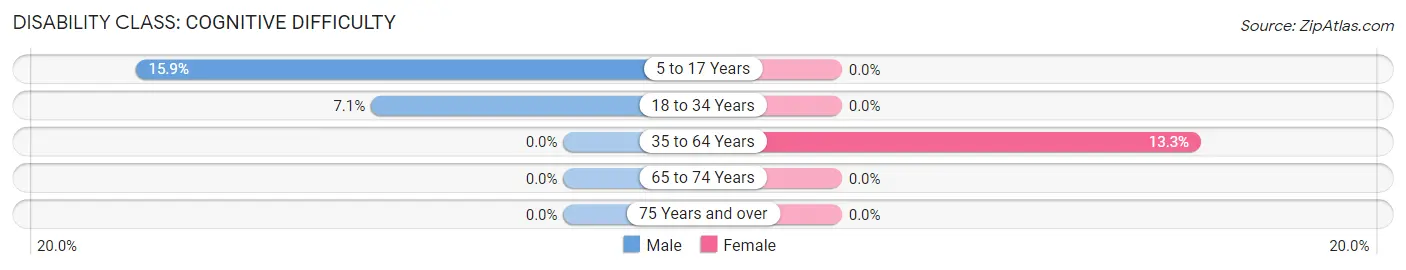
| Age Bracket | Male | Female |
| 5 to 17 Years | 37 (15.9%) | 0 (0.0%) |
| 18 to 34 Years | 8 (7.1%) | 0 (0.0%) |
| 35 to 64 Years | 0 (0.0%) | 18 (13.3%) |
| 65 to 74 Years | 0 (0.0%) | 0 (0.0%) |
| 75 Years and over | 0 (0.0%) | 0 (0.0%) |
Disability Class: Ambulatory Difficulty
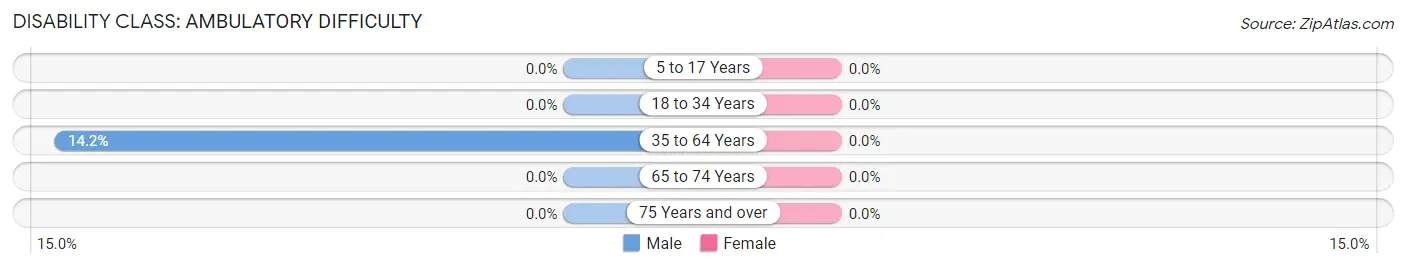
| Age Bracket | Male | Female |
| 5 to 17 Years | 0 (0.0%) | 0 (0.0%) |
| 18 to 34 Years | 0 (0.0%) | 0 (0.0%) |
| 35 to 64 Years | 15 (14.1%) | 0 (0.0%) |
| 65 to 74 Years | 0 (0.0%) | 0 (0.0%) |
| 75 Years and over | 0 (0.0%) | 0 (0.0%) |
Disability Class: Self-Care Difficulty
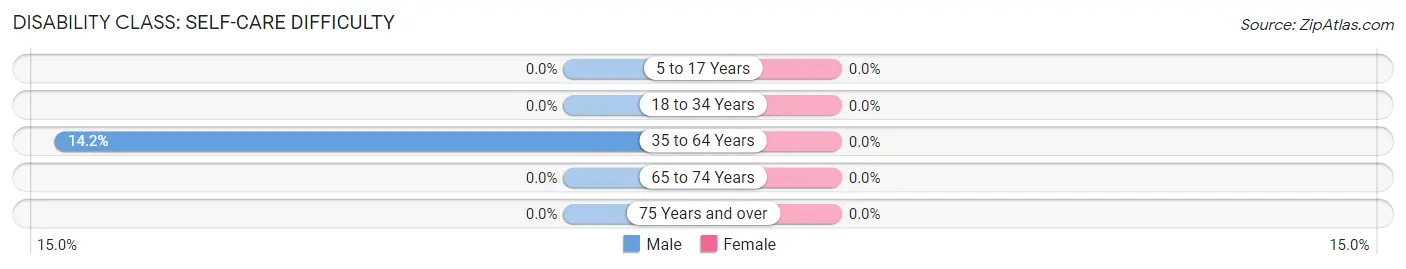
| Age Bracket | Male | Female |
| 5 to 17 Years | 0 (0.0%) | 0 (0.0%) |
| 18 to 34 Years | 0 (0.0%) | 0 (0.0%) |
| 35 to 64 Years | 15 (14.1%) | 0 (0.0%) |
| 65 to 74 Years | 0 (0.0%) | 0 (0.0%) |
| 75 Years and over | 0 (0.0%) | 0 (0.0%) |
Technology Access in Warren AFB
Computing Device Access in Warren AFB
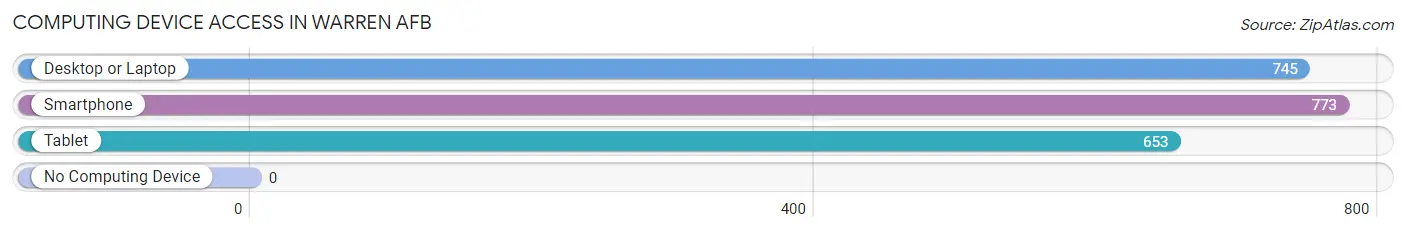
| Device Type | # Households | % Households |
| Desktop or Laptop | 745 | 96.4% |
| Smartphone | 773 | 100.0% |
| Tablet | 653 | 84.5% |
| No Computing Device | 0 | 0.0% |
| Total | 773 | 100.0% |
Internet Access in Warren AFB
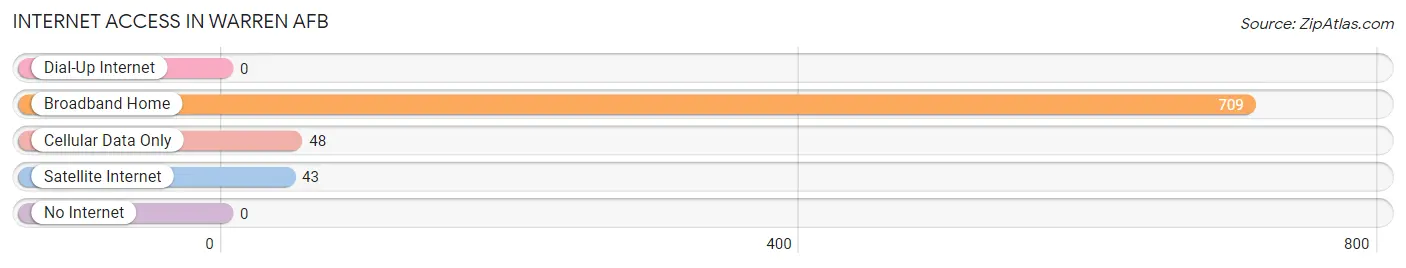
| Internet Type | # Households | % Households |
| Dial-Up Internet | 0 | 0.0% |
| Broadband Home | 709 | 91.7% |
| Cellular Data Only | 48 | 6.2% |
| Satellite Internet | 43 | 5.6% |
| No Internet | 0 | 0.0% |
| Total | 773 | 100.0% |
Warren AFB Summary
Introduction
Warren Air Force Base (AFB) is located in Cheyenne, Wyoming, and is the home of the 90th Missile Wing of the Air Force Global Strike Command. It is the only base in the United States that is home to intercontinental ballistic missiles (ICBMs). The base was established in 1949 and has been an integral part of the United States’ nuclear deterrence strategy since then.
History
Warren AFB was established in 1949 as a Strategic Air Command (SAC) base. It was originally named Cheyenne Air Force Base, but was renamed in honor of General Warren in 1950. The base was initially used as a training facility for B-29 and B-50 bombers. In 1954, the base was transferred to the Air Research and Development Command (ARDC) and was used to test and develop new aircraft and weapons systems.
In 1958, the base was transferred to the Strategic Air Command (SAC) and was used as a base for the deployment of nuclear-capable bombers. In 1961, the base was transferred to the Air Force Systems Command (AFSC) and was used to develop and test intercontinental ballistic missiles (ICBMs). In 1965, the base was transferred to the Air Force Space Command (AFSPC) and was used to develop and test space-based weapons systems.
In 1991, the base was transferred to the Air Force Global Strike Command (AFGSC) and was used to develop and test ICBMs. In 1995, the base was transferred to the Air Force Materiel Command (AFMC) and was used to develop and test advanced weapons systems.
Geography
Warren AFB is located in Cheyenne, Wyoming, and is situated on the eastern edge of the Laramie Plains. The base is located at an elevation of 5,890 feet above sea level and covers an area of approximately 4,000 acres. The base is located approximately 30 miles east of Cheyenne and is bordered by Interstate 25 to the north and Interstate 80 to the south.
The base is located in a semi-arid climate, with hot summers and cold winters. The average annual temperature is approximately 50 degrees Fahrenheit, with an average high of 85 degrees Fahrenheit in the summer and an average low of -10 degrees Fahrenheit in the winter. The average annual precipitation is approximately 16 inches, with most of the precipitation occurring in the spring and summer months.
Economy
Warren AFB is a major economic driver for the state of Wyoming. The base has an estimated economic impact of over $1 billion annually, and is the largest employer in the state. The base employs over 4,000 military personnel and civilian employees, and provides jobs for over 10,000 people in the surrounding communities.
The base is home to a variety of businesses, including a commissary, a post exchange, a bowling alley, a golf course, a fitness center, and a variety of restaurants and shops. The base also hosts a variety of events, including air shows, concerts, and sporting events.
Demographics
As of the 2010 census, the population of Warren AFB was 4,845. The racial makeup of the base was 79.3% White, 11.2% African American, 0.7% Native American, 2.2% Asian, 0.1% Pacific Islander, 4.2% from other races, and 2.3% from two or more races. The median household income was $50,945, and the median family income was $60,945.
Conclusion
Warren AFB is an important part of the United States’ nuclear deterrence strategy and is a major economic driver for the state of Wyoming. The base has a rich history and is home to a variety of businesses and events. The base is also home to a diverse population, with a median household income of $50,945. Warren AFB is an important part of the United States’ military and economic infrastructure, and will continue to be an important part of the United States’ nuclear deterrence strategy for years to come.
Common Questions
What is Per Capita Income in Warren AFB?
Per Capita income in Warren AFB is $25,439.
What is the Median Family Income in Warren AFB?
Median Family Income in Warren AFB is $58,723.
What is the Median Household income in Warren AFB?
Median Household Income in Warren AFB is $58,856.
What is Income or Wage Gap in Warren AFB?
Income or Wage Gap in Warren AFB is 35.3%.
Women in Warren AFB earn 64.7 cents for every dollar earned by a man.
What is Family Income Deficit in Warren AFB?
Family Income Deficit in Warren AFB is $6,497.
Families that are below poverty line in Warren AFB earn $6,497 less on average than the poverty threshold level.
What is Inequality or Gini Index in Warren AFB?
Inequality or Gini Index in Warren AFB is 0.33.
What is the Total Population of Warren AFB?
Total Population of Warren AFB is 2,836.
What is the Total Male Population of Warren AFB?
Total Male Population of Warren AFB is 1,637.
What is the Total Female Population of Warren AFB?
Total Female Population of Warren AFB is 1,199.
What is the Ratio of Males per 100 Females in Warren AFB?
There are 136.53 Males per 100 Females in Warren AFB.
What is the Ratio of Females per 100 Males in Warren AFB?
There are 73.24 Females per 100 Males in Warren AFB.
What is the Median Population Age in Warren AFB?
Median Population Age in Warren AFB is 22.2 Years.
What is the Average Family Size in Warren AFB
Average Family Size in Warren AFB is 3.0 People.
What is the Average Household Size in Warren AFB
Average Household Size in Warren AFB is 2.9 People.
How Large is the Labor Force in Warren AFB?
There are 1,777 People in the Labor Forcein in Warren AFB.
What is the Percentage of People in the Labor Force in Warren AFB?
89.1% of People are in the Labor Force in Warren AFB.
What is the Unemployment Rate in Warren AFB?
Unemployment Rate in Warren AFB is 11.8%.