Webb County, TX Map & Demographics
Webb County Overview
$23,446
PER CAPITA INCOME
$65,891
AVG FAMILY INCOME
$59,984
AVG HOUSEHOLD INCOME
39.2%
WAGE / INCOME GAP [ % ]
60.8¢/ $1
WAGE / INCOME GAP [ $ ]
$11,446
FAMILY INCOME DEFICIT
0.46
INEQUALITY / GINI INDEX
267,282
TOTAL POPULATION
132,495
MALE POPULATION
134,787
FEMALE POPULATION
98.30
MALES / 100 FEMALES
101.73
FEMALES / 100 MALES
29.4
MEDIAN AGE
3.9
AVG FAMILY SIZE
3.4
AVG HOUSEHOLD SIZE
118,730
LABOR FORCE [ PEOPLE ]
62.0%
PERCENT IN LABOR FORCE
5.9%
UNEMPLOYMENT RATE
Income in Webb County
Income Overview in Webb County
Per Capita Income in Webb County is $23,446, while median incomes of families and households are $65,891 and $59,984 respectively.
| Characteristic | Number | Measure |
| Per Capita Income | 267,282 | $23,446 |
| Median Family Income | 62,267 | $65,891 |
| Mean Family Income | 62,267 | $83,877 |
| Median Household Income | 77,797 | $59,984 |
| Mean Household Income | 77,797 | $78,814 |
| Income Deficit | 62,267 | $11,446 |
| Wage / Income Gap (%) | 267,282 | 39.23% |
| Wage / Income Gap ($) | 267,282 | 60.77¢ per $1 |
| Gini / Inequality Index | 267,282 | 0.46 |
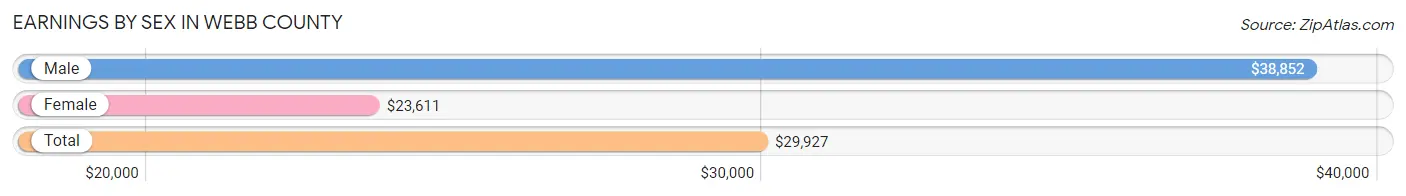
Earnings by Sex in Webb County
Average Earnings in Webb County are $29,927, $38,852 for men and $23,611 for women, a difference of 39.2%.
| Sex | Number | Average Earnings |
| Male | 68,206 (55.7%) | $38,852 |
| Female | 54,196 (44.3%) | $23,611 |
| Total | 122,402 (100.0%) | $29,927 |
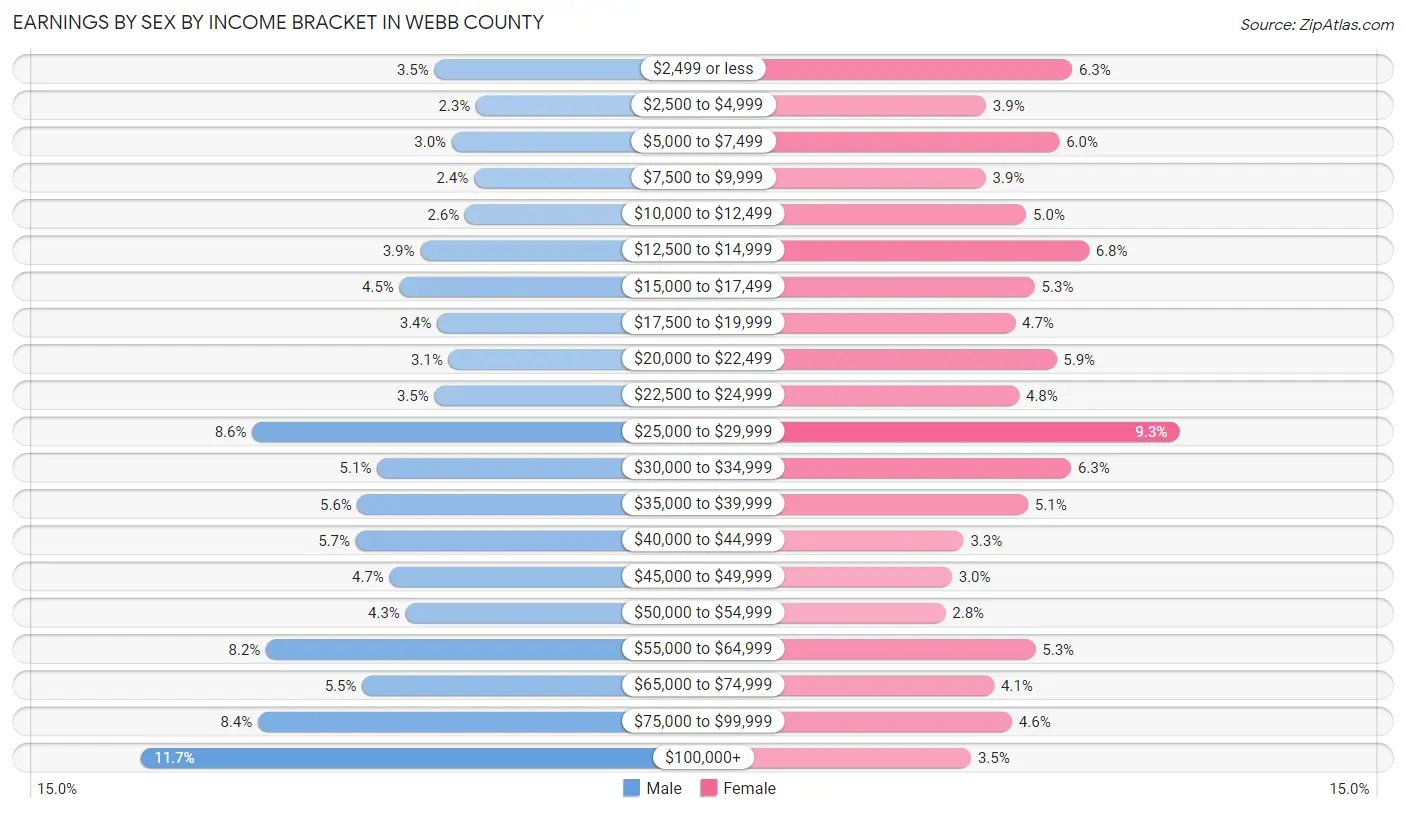
Earnings by Sex by Income Bracket in Webb County
The most common earnings brackets in Webb County are $100,000+ for men (7,995 | 11.7%) and $25,000 to $29,999 for women (5,063 | 9.3%).
| Income | Male | Female |
| $2,499 or less | 2,375 (3.5%) | 3,432 (6.3%) |
| $2,500 to $4,999 | 1,574 (2.3%) | 2,117 (3.9%) |
| $5,000 to $7,499 | 2,036 (3.0%) | 3,237 (6.0%) |
| $7,500 to $9,999 | 1,618 (2.4%) | 2,113 (3.9%) |
| $10,000 to $12,499 | 1,788 (2.6%) | 2,733 (5.0%) |
| $12,500 to $14,999 | 2,649 (3.9%) | 3,686 (6.8%) |
| $15,000 to $17,499 | 3,039 (4.5%) | 2,861 (5.3%) |
| $17,500 to $19,999 | 2,322 (3.4%) | 2,562 (4.7%) |
| $20,000 to $22,499 | 2,100 (3.1%) | 3,192 (5.9%) |
| $22,500 to $24,999 | 2,372 (3.5%) | 2,621 (4.8%) |
| $25,000 to $29,999 | 5,863 (8.6%) | 5,063 (9.3%) |
| $30,000 to $34,999 | 3,473 (5.1%) | 3,414 (6.3%) |
| $35,000 to $39,999 | 3,845 (5.6%) | 2,760 (5.1%) |
| $40,000 to $44,999 | 3,881 (5.7%) | 1,778 (3.3%) |
| $45,000 to $49,999 | 3,235 (4.7%) | 1,601 (2.9%) |
| $50,000 to $54,999 | 2,926 (4.3%) | 1,503 (2.8%) |
| $55,000 to $64,999 | 5,599 (8.2%) | 2,872 (5.3%) |
| $65,000 to $74,999 | 3,757 (5.5%) | 2,246 (4.1%) |
| $75,000 to $99,999 | 5,759 (8.4%) | 2,516 (4.6%) |
| $100,000+ | 7,995 (11.7%) | 1,889 (3.5%) |
| Total | 68,206 (100.0%) | 54,196 (100.0%) |
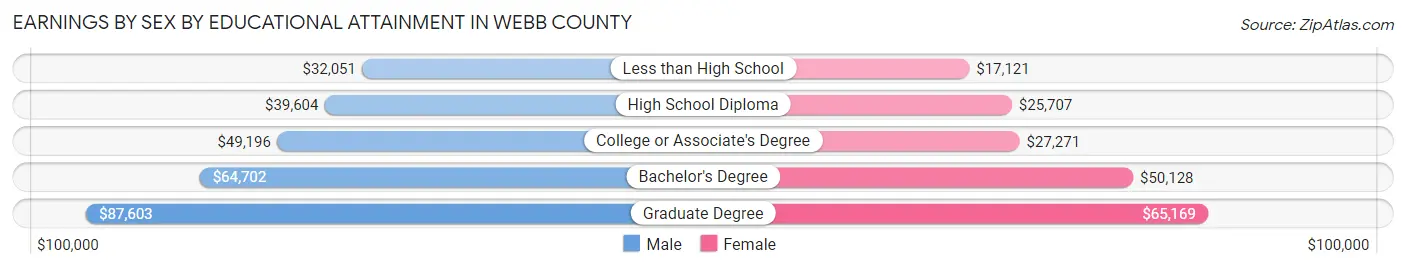
Earnings by Sex by Educational Attainment in Webb County
Average earnings in Webb County are $45,186 for men and $27,161 for women, a difference of 39.9%. Men with an educational attainment of graduate degree enjoy the highest average annual earnings of $87,603, while those with less than high school education earn the least with $32,051. Women with an educational attainment of graduate degree earn the most with the average annual earnings of $65,169, while those with less than high school education have the smallest earnings of $17,121.
| Educational Attainment | Male Income | Female Income |
| Less than High School | $32,051 | $17,121 |
| High School Diploma | $39,604 | $25,707 |
| College or Associate's Degree | $49,196 | $27,271 |
| Bachelor's Degree | $64,702 | $50,128 |
| Graduate Degree | $87,603 | $65,169 |
| Total | $45,186 | $27,161 |
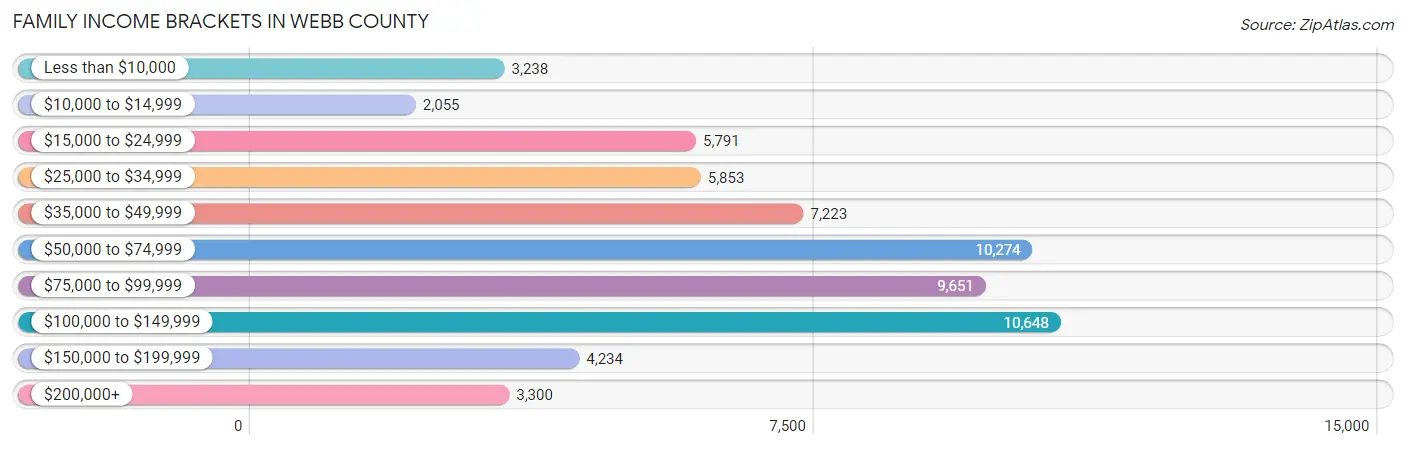
Family Income in Webb County
Family Income Brackets in Webb County
According to the Webb County family income data, there are 10,648 families falling into the $100,000 to $149,999 income range, which is the most common income bracket and makes up 17.1% of all families. Conversely, the $10,000 to $14,999 income bracket is the least frequent group with only 2,055 families (3.3%) belonging to this category.
| Income Bracket | # Families | % Families |
| Less than $10,000 | 3,238 | 5.2% |
| $10,000 to $14,999 | 2,055 | 3.3% |
| $15,000 to $24,999 | 5,791 | 9.3% |
| $25,000 to $34,999 | 5,853 | 9.4% |
| $35,000 to $49,999 | 7,223 | 11.6% |
| $50,000 to $74,999 | 10,274 | 16.5% |
| $75,000 to $99,999 | 9,651 | 15.5% |
| $100,000 to $149,999 | 10,648 | 17.1% |
| $150,000 to $199,999 | 4,234 | 6.8% |
| $200,000+ | 3,300 | 5.3% |
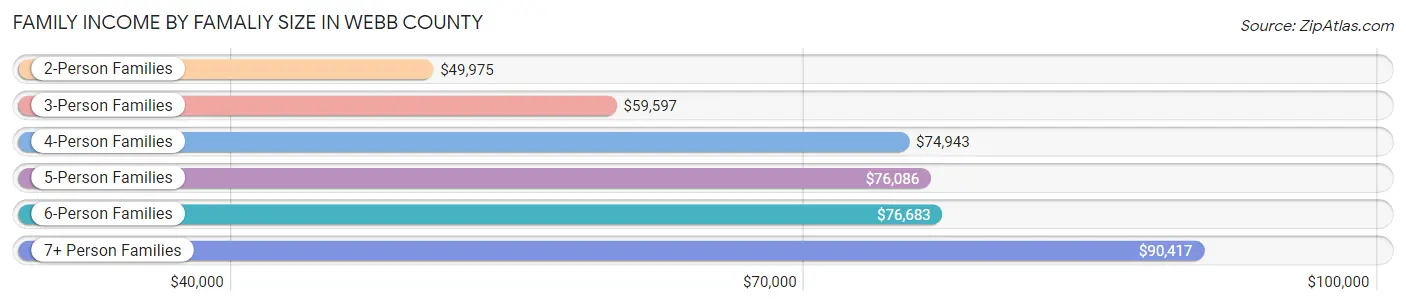
Family Income by Famaliy Size in Webb County
7+ person families (2,854 | 4.6%) account for the highest median family income in Webb County with $90,417 per family, while 2-person families (16,080 | 25.8%) have the highest median income of $24,988 per family member.
| Income Bracket | # Families | Median Income |
| 2-Person Families | 16,080 (25.8%) | $49,975 |
| 3-Person Families | 14,225 (22.9%) | $59,597 |
| 4-Person Families | 14,697 (23.6%) | $74,943 |
| 5-Person Families | 9,853 (15.8%) | $76,086 |
| 6-Person Families | 4,558 (7.3%) | $76,683 |
| 7+ Person Families | 2,854 (4.6%) | $90,417 |
| Total | 62,267 (100.0%) | $65,891 |
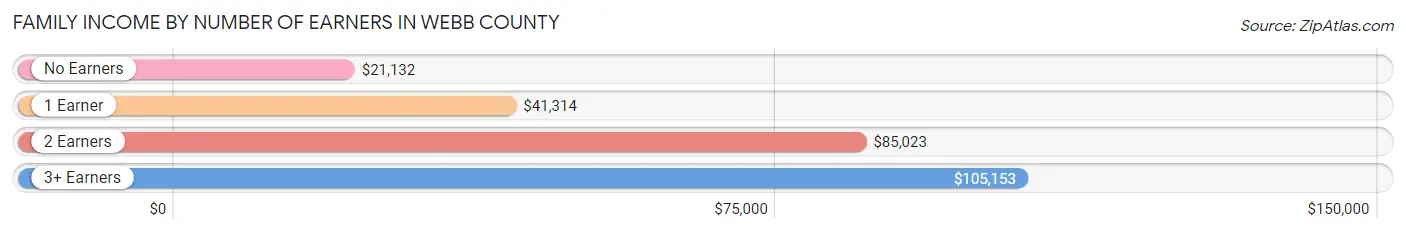
Family Income by Number of Earners in Webb County
The median family income in Webb County is $65,891, with families comprising 3+ earners (10,025) having the highest median family income of $105,153, while families with no earners (6,621) have the lowest median family income of $21,132, accounting for 16.1% and 10.6% of families, respectively.
| Number of Earners | # Families | Median Income |
| No Earners | 6,621 (10.6%) | $21,132 |
| 1 Earner | 21,845 (35.1%) | $41,314 |
| 2 Earners | 23,776 (38.2%) | $85,023 |
| 3+ Earners | 10,025 (16.1%) | $105,153 |
| Total | 62,267 (100.0%) | $65,891 |
Household Income in Webb County
Household Income Brackets in Webb County
With 13,070 households falling in the category, the $50,000 to $74,999 income range is the most frequent in Webb County, accounting for 16.8% of all households. In contrast, only 3,812 households (4.9%) fall into the $200,000+ income bracket, making it the least populous group.

| Income Bracket | # Households | % Households |
| Less than $10,000 | 5,057 | 6.5% |
| $10,000 to $14,999 | 4,123 | 5.3% |
| $15,000 to $24,999 | 7,624 | 9.8% |
| $25,000 to $34,999 | 7,391 | 9.5% |
| $35,000 to $49,999 | 8,947 | 11.5% |
| $50,000 to $74,999 | 13,070 | 16.8% |
| $75,000 to $99,999 | 10,580 | 13.6% |
| $100,000 to $149,999 | 12,603 | 16.2% |
| $150,000 to $199,999 | 4,590 | 5.9% |
| $200,000+ | 3,812 | 4.9% |
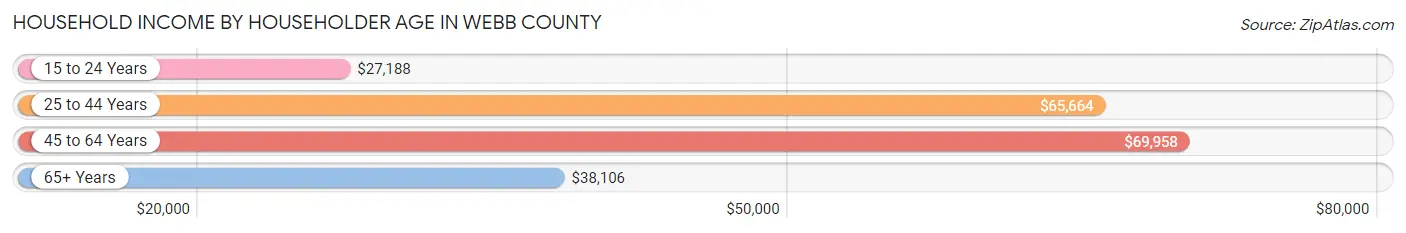
Household Income by Householder Age in Webb County
The median household income in Webb County is $59,984, with the highest median household income of $69,958 found in the 45 to 64 years age bracket for the primary householder. A total of 30,724 households (39.5%) fall into this category. Meanwhile, the 15 to 24 years age bracket for the primary householder has the lowest median household income of $27,188, with 2,758 households (3.5%) in this group.
| Income Bracket | # Households | Median Income |
| 15 to 24 Years | 2,758 (3.5%) | $27,188 |
| 25 to 44 Years | 28,735 (36.9%) | $65,664 |
| 45 to 64 Years | 30,724 (39.5%) | $69,958 |
| 65+ Years | 15,580 (20.0%) | $38,106 |
| Total | 77,797 (100.0%) | $59,984 |
Poverty in Webb County
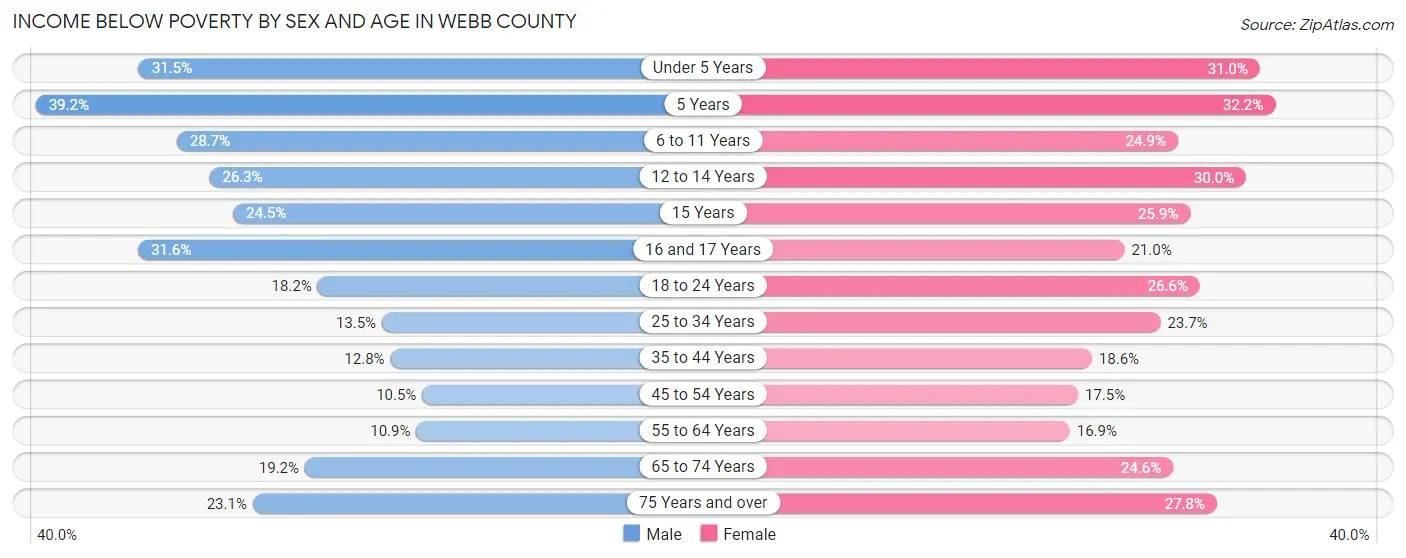
Income Below Poverty by Sex and Age in Webb County
With 19.3% poverty level for males and 23.5% for females among the residents of Webb County, 5 year old males and 5 year old females are the most vulnerable to poverty, with 714 males (39.2%) and 783 females (32.2%) in their respective age groups living below the poverty level.
| Age Bracket | Male | Female |
| Under 5 Years | 3,554 (31.5%) | 3,376 (31.0%) |
| 5 Years | 714 (39.2%) | 783 (32.2%) |
| 6 to 11 Years | 4,426 (28.7%) | 3,399 (24.9%) |
| 12 to 14 Years | 1,829 (26.3%) | 2,284 (30.0%) |
| 15 Years | 631 (24.5%) | 634 (25.9%) |
| 16 and 17 Years | 1,490 (31.6%) | 961 (21.0%) |
| 18 to 24 Years | 2,838 (18.2%) | 4,000 (26.6%) |
| 25 to 34 Years | 2,466 (13.5%) | 4,128 (23.7%) |
| 35 to 44 Years | 2,153 (12.8%) | 3,057 (18.6%) |
| 45 to 54 Years | 1,571 (10.5%) | 2,828 (17.5%) |
| 55 to 64 Years | 1,215 (10.9%) | 2,078 (16.9%) |
| 65 to 74 Years | 1,328 (19.2%) | 2,034 (24.6%) |
| 75 Years and over | 932 (23.1%) | 1,762 (27.8%) |
| Total | 25,147 (19.3%) | 31,324 (23.5%) |
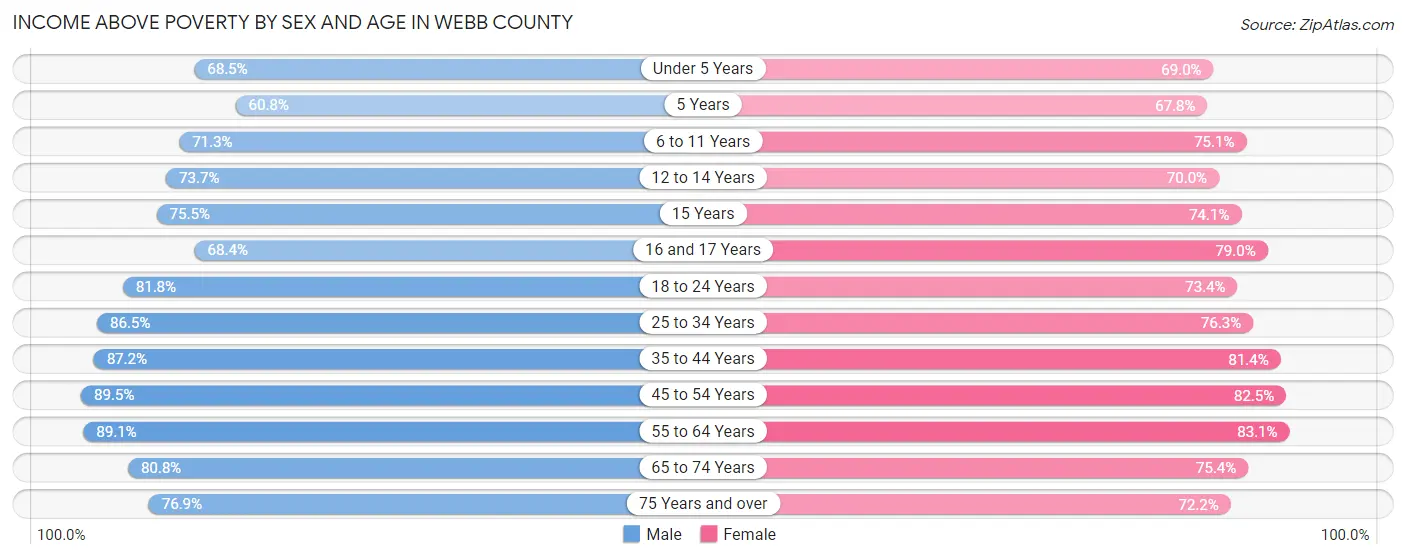
Income Above Poverty by Sex and Age in Webb County
According to the poverty statistics in Webb County, males aged 45 to 54 years and females aged 55 to 64 years are the age groups that are most secure financially, with 89.5% of males and 83.1% of females in these age groups living above the poverty line.
| Age Bracket | Male | Female |
| Under 5 Years | 7,723 (68.5%) | 7,504 (69.0%) |
| 5 Years | 1,109 (60.8%) | 1,651 (67.8%) |
| 6 to 11 Years | 10,993 (71.3%) | 10,232 (75.1%) |
| 12 to 14 Years | 5,130 (73.7%) | 5,327 (70.0%) |
| 15 Years | 1,942 (75.5%) | 1,818 (74.1%) |
| 16 and 17 Years | 3,229 (68.4%) | 3,617 (79.0%) |
| 18 to 24 Years | 12,719 (81.8%) | 11,048 (73.4%) |
| 25 to 34 Years | 15,843 (86.5%) | 13,319 (76.3%) |
| 35 to 44 Years | 14,619 (87.2%) | 13,408 (81.4%) |
| 45 to 54 Years | 13,422 (89.5%) | 13,297 (82.5%) |
| 55 to 64 Years | 9,915 (89.1%) | 10,197 (83.1%) |
| 65 to 74 Years | 5,592 (80.8%) | 6,239 (75.4%) |
| 75 Years and over | 3,110 (76.9%) | 4,566 (72.2%) |
| Total | 105,346 (80.7%) | 102,223 (76.5%) |
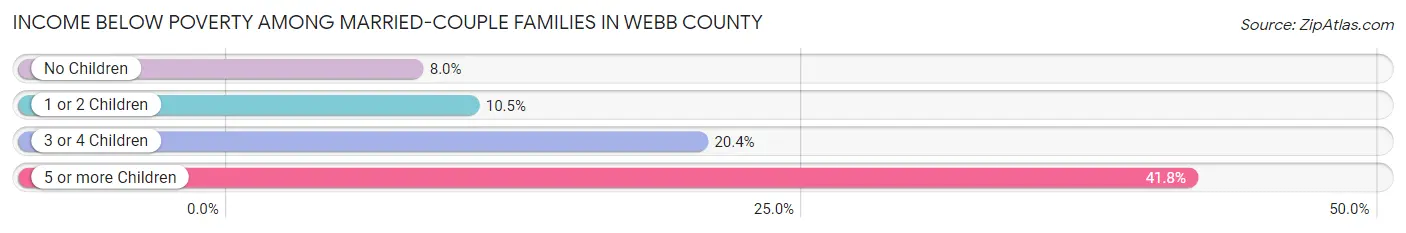
Income Below Poverty Among Married-Couple Families in Webb County
The poverty statistics for married-couple families in Webb County show that 11.6% or 4,673 of the total 40,223 families live below the poverty line. Families with 5 or more children have the highest poverty rate of 41.8%, comprising of 236 families. On the other hand, families with no children have the lowest poverty rate of 8.0%, which includes 1,281 families.
| Children | Above Poverty | Below Poverty |
| No Children | 14,656 (92.0%) | 1,281 (8.0%) |
| 1 or 2 Children | 15,207 (89.5%) | 1,780 (10.5%) |
| 3 or 4 Children | 5,358 (79.6%) | 1,376 (20.4%) |
| 5 or more Children | 329 (58.2%) | 236 (41.8%) |
| Total | 35,550 (88.4%) | 4,673 (11.6%) |
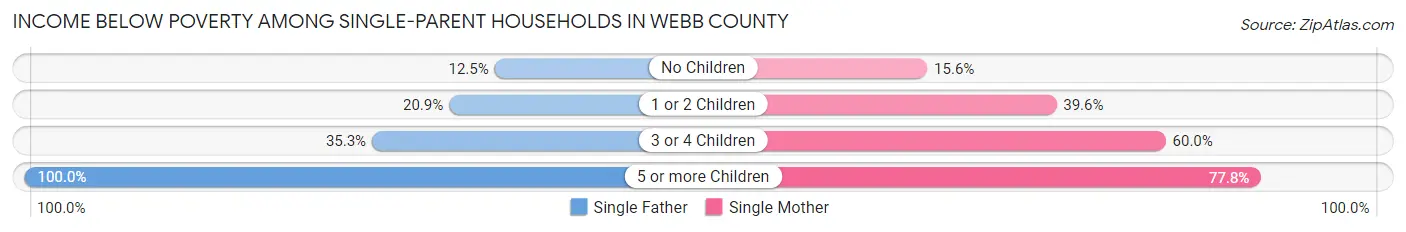
Income Below Poverty Among Single-Parent Households in Webb County
According to the poverty data in Webb County, 19.6% or 1,027 single-father households and 36.8% or 6,194 single-mother households are living below the poverty line. Among single-father households, those with 5 or more children have the highest poverty rate, with 16 households (100.0%) experiencing poverty. Likewise, among single-mother households, those with 5 or more children have the highest poverty rate, with 388 households (77.8%) falling below the poverty line.
| Children | Single Father | Single Mother |
| No Children | 291 (12.5%) | 795 (15.5%) |
| 1 or 2 Children | 433 (20.9%) | 3,318 (39.6%) |
| 3 or 4 Children | 287 (35.3%) | 1,693 (60.0%) |
| 5 or more Children | 16 (100.0%) | 388 (77.8%) |
| Total | 1,027 (19.6%) | 6,194 (36.8%) |
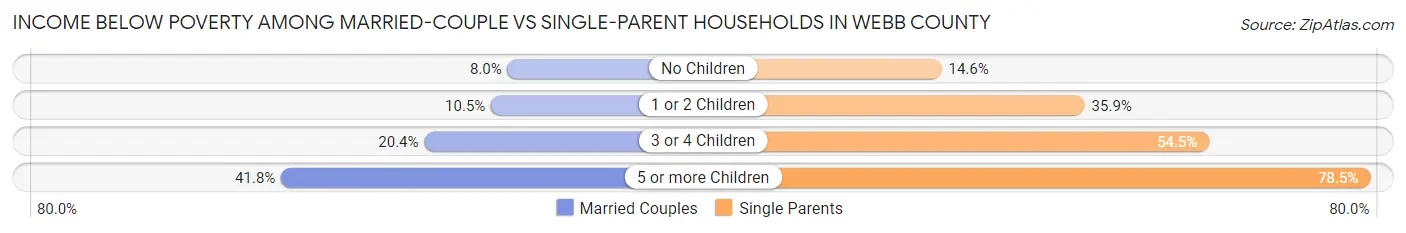
Income Below Poverty Among Married-Couple vs Single-Parent Households in Webb County
The poverty data for Webb County shows that 4,673 of the married-couple family households (11.6%) and 7,221 of the single-parent households (32.8%) are living below the poverty level. Within the married-couple family households, those with 5 or more children have the highest poverty rate, with 236 households (41.8%) falling below the poverty line. Among the single-parent households, those with 5 or more children have the highest poverty rate, with 404 household (78.4%) living below poverty.
| Children | Married-Couple Families | Single-Parent Households |
| No Children | 1,281 (8.0%) | 1,086 (14.6%) |
| 1 or 2 Children | 1,780 (10.5%) | 3,751 (35.9%) |
| 3 or 4 Children | 1,376 (20.4%) | 1,980 (54.5%) |
| 5 or more Children | 236 (41.8%) | 404 (78.4%) |
| Total | 4,673 (11.6%) | 7,221 (32.8%) |
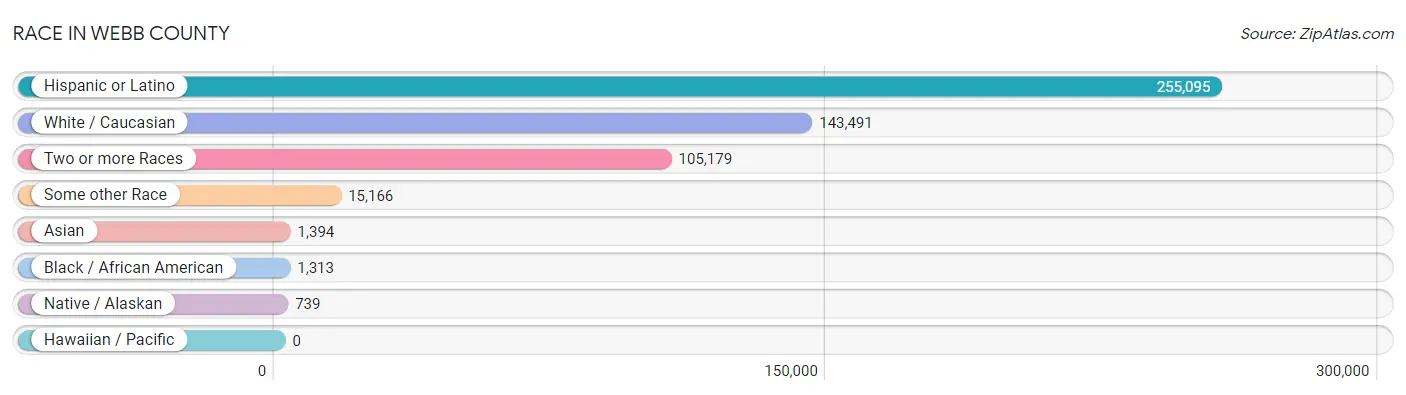
Race in Webb County
The most populous races in Webb County are Hispanic or Latino (255,095 | 95.4%), White / Caucasian (143,491 | 53.7%), and Two or more Races (105,179 | 39.4%).
| Race | # Population | % Population |
| Asian | 1,394 | 0.5% |
| Black / African American | 1,313 | 0.5% |
| Hawaiian / Pacific | 0 | 0.0% |
| Hispanic or Latino | 255,095 | 95.4% |
| Native / Alaskan | 739 | 0.3% |
| White / Caucasian | 143,491 | 53.7% |
| Two or more Races | 105,179 | 39.4% |
| Some other Race | 15,166 | 5.7% |
| Total | 267,282 | 100.0% |
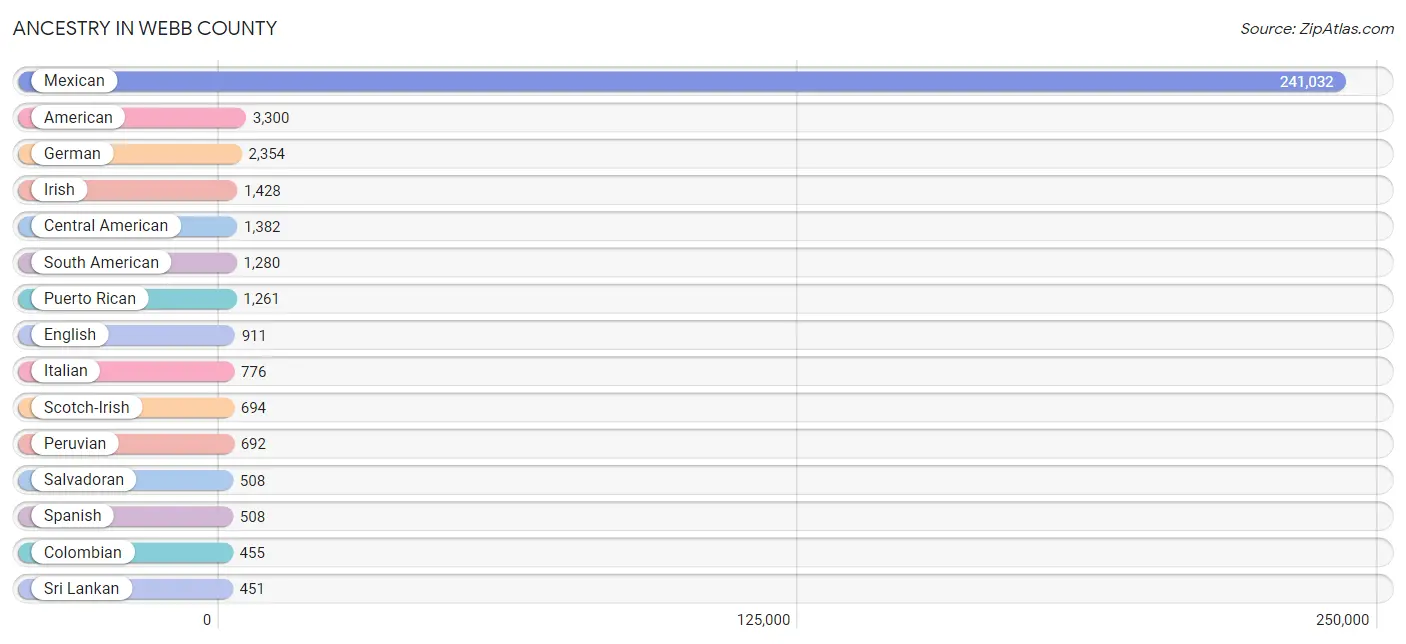
Ancestry in Webb County
The most populous ancestries reported in Webb County are Mexican (241,032 | 90.2%), American (3,300 | 1.2%), German (2,354 | 0.9%), Irish (1,428 | 0.5%), and Central American (1,382 | 0.5%), together accounting for 93.3% of all Webb County residents.
| Ancestry | # Population | % Population |
| African | 181 | 0.1% |
| Albanian | 6 | 0.0% |
| American | 3,300 | 1.2% |
| Apache | 17 | 0.0% |
| Arab | 78 | 0.0% |
| Argentinean | 37 | 0.0% |
| Austrian | 40 | 0.0% |
| Bhutanese | 131 | 0.1% |
| Brazilian | 15 | 0.0% |
| British | 36 | 0.0% |
| Bulgarian | 149 | 0.1% |
| Burmese | 190 | 0.1% |
| Cajun | 65 | 0.0% |
| Canadian | 11 | 0.0% |
| Central American | 1,382 | 0.5% |
| Central American Indian | 51 | 0.0% |
| Cherokee | 290 | 0.1% |
| Chickasaw | 29 | 0.0% |
| Colombian | 455 | 0.2% |
| Comanche | 17 | 0.0% |
| Creek | 31 | 0.0% |
| Cuban | 385 | 0.1% |
| Czech | 28 | 0.0% |
| Danish | 99 | 0.0% |
| Dominican | 90 | 0.0% |
| Dutch | 217 | 0.1% |
| Eastern European | 4 | 0.0% |
| Ecuadorian | 61 | 0.0% |
| Egyptian | 17 | 0.0% |
| English | 911 | 0.3% |
| Ethiopian | 6 | 0.0% |
| European | 194 | 0.1% |
| Filipino | 1 | 0.0% |
| French | 420 | 0.2% |
| French American Indian | 3 | 0.0% |
| French Canadian | 86 | 0.0% |
| German | 2,354 | 0.9% |
| Greek | 32 | 0.0% |
| Guamanian / Chamorro | 7 | 0.0% |
| Guatemalan | 340 | 0.1% |
| Honduran | 240 | 0.1% |
| Hungarian | 23 | 0.0% |
| Indian (Asian) | 314 | 0.1% |
| Iranian | 11 | 0.0% |
| Iraqi | 44 | 0.0% |
| Irish | 1,428 | 0.5% |
| Iroquois | 18 | 0.0% |
| Italian | 776 | 0.3% |
| Jamaican | 8 | 0.0% |
| Kenyan | 3 | 0.0% |
| Korean | 324 | 0.1% |
| Laotian | 8 | 0.0% |
| Lithuanian | 29 | 0.0% |
| Lumbee | 4 | 0.0% |
| Mexican | 241,032 | 90.2% |
| Mexican American Indian | 434 | 0.2% |
| Navajo | 8 | 0.0% |
| Nicaraguan | 135 | 0.1% |
| Nigerian | 37 | 0.0% |
| Norwegian | 45 | 0.0% |
| Pakistani | 29 | 0.0% |
| Panamanian | 98 | 0.0% |
| Peruvian | 692 | 0.3% |
| Polish | 317 | 0.1% |
| Portuguese | 15 | 0.0% |
| Pueblo | 6 | 0.0% |
| Puerto Rican | 1,261 | 0.5% |
| Romanian | 7 | 0.0% |
| Russian | 156 | 0.1% |
| Salvadoran | 508 | 0.2% |
| Samoan | 35 | 0.0% |
| Scandinavian | 16 | 0.0% |
| Scotch-Irish | 694 | 0.3% |
| Scottish | 109 | 0.0% |
| Sioux | 5 | 0.0% |
| Slovak | 23 | 0.0% |
| Slovene | 40 | 0.0% |
| South American | 1,280 | 0.5% |
| Spaniard | 405 | 0.2% |
| Spanish | 508 | 0.2% |
| Spanish American | 23 | 0.0% |
| Spanish American Indian | 33 | 0.0% |
| Sri Lankan | 451 | 0.2% |
| Subsaharan African | 301 | 0.1% |
| Swedish | 35 | 0.0% |
| Swiss | 61 | 0.0% |
| Syrian | 17 | 0.0% |
| Thai | 101 | 0.0% |
| Ukrainian | 26 | 0.0% |
| Venezuelan | 35 | 0.0% |
| Welsh | 30 | 0.0% |
| West Indian | 19 | 0.0% |
| Yugoslavian | 57 | 0.0% | View All 93 Rows |
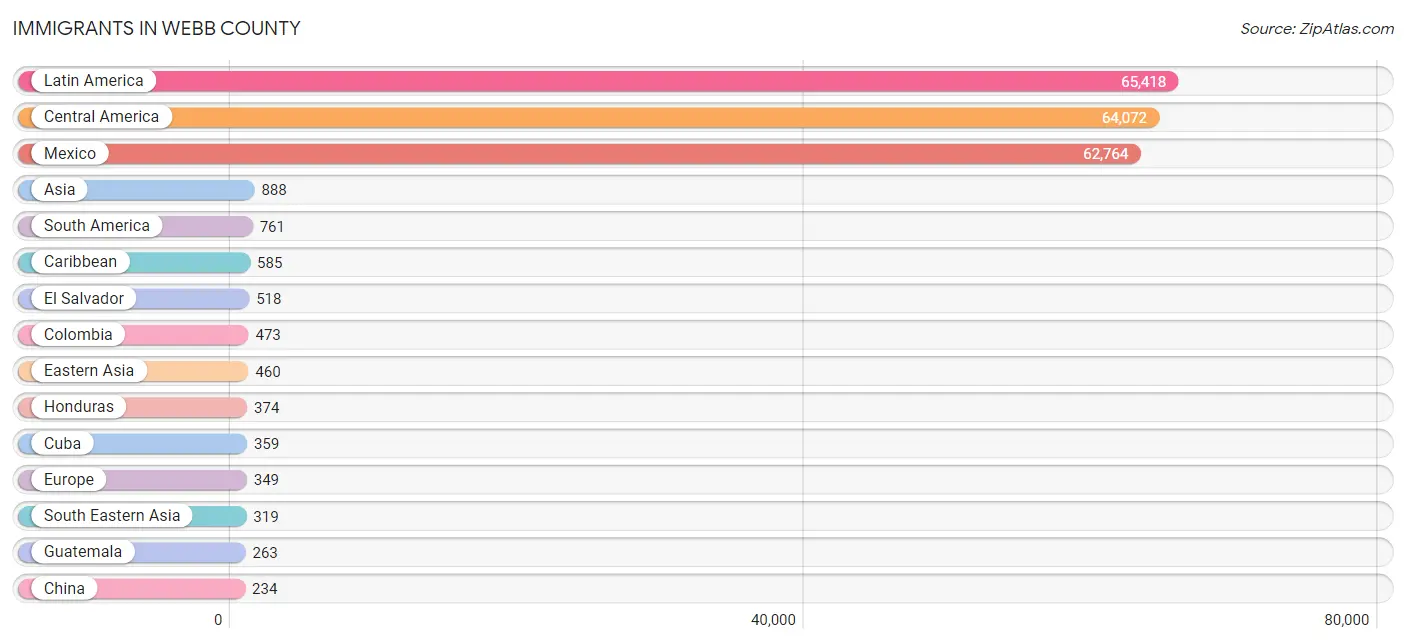
Immigrants in Webb County
The most numerous immigrant groups reported in Webb County came from Latin America (65,418 | 24.5%), Central America (64,072 | 24.0%), Mexico (62,764 | 23.5%), Asia (888 | 0.3%), and South America (761 | 0.3%), together accounting for 72.5% of all Webb County residents.
| Immigration Origin | # Population | % Population |
| Africa | 224 | 0.1% |
| Albania | 6 | 0.0% |
| Argentina | 32 | 0.0% |
| Asia | 888 | 0.3% |
| Bangladesh | 11 | 0.0% |
| Brazil | 16 | 0.0% |
| Bulgaria | 86 | 0.0% |
| Cameroon | 74 | 0.0% |
| Canada | 85 | 0.0% |
| Caribbean | 585 | 0.2% |
| Central America | 64,072 | 24.0% |
| China | 234 | 0.1% |
| Colombia | 473 | 0.2% |
| Cuba | 359 | 0.1% |
| Denmark | 35 | 0.0% |
| Dominican Republic | 75 | 0.0% |
| Eastern Africa | 113 | 0.0% |
| Eastern Asia | 460 | 0.2% |
| Eastern Europe | 198 | 0.1% |
| Ecuador | 72 | 0.0% |
| El Salvador | 518 | 0.2% |
| Eritrea | 6 | 0.0% |
| Ethiopia | 104 | 0.0% |
| Europe | 349 | 0.1% |
| Germany | 16 | 0.0% |
| Guatemala | 263 | 0.1% |
| Honduras | 374 | 0.1% |
| Hong Kong | 12 | 0.0% |
| India | 27 | 0.0% |
| Iraq | 44 | 0.0% |
| Ireland | 22 | 0.0% |
| Jamaica | 8 | 0.0% |
| Japan | 112 | 0.0% |
| Kenya | 3 | 0.0% |
| Korea | 114 | 0.0% |
| Latin America | 65,418 | 24.5% |
| Mexico | 62,764 | 23.5% |
| Middle Africa | 74 | 0.0% |
| Nicaragua | 144 | 0.1% |
| Nigeria | 34 | 0.0% |
| Northern Europe | 72 | 0.0% |
| Pakistan | 10 | 0.0% |
| Panama | 9 | 0.0% |
| Peru | 133 | 0.1% |
| Philippines | 142 | 0.1% |
| Russia | 56 | 0.0% |
| Serbia | 24 | 0.0% |
| South America | 761 | 0.3% |
| South Central Asia | 48 | 0.0% |
| South Eastern Asia | 319 | 0.1% |
| Southern Europe | 63 | 0.0% |
| Spain | 63 | 0.0% |
| Sweden | 6 | 0.0% |
| Syria | 17 | 0.0% |
| Taiwan | 1 | 0.0% |
| Thailand | 29 | 0.0% |
| Trinidad and Tobago | 11 | 0.0% |
| Ukraine | 26 | 0.0% |
| Venezuela | 35 | 0.0% |
| Vietnam | 148 | 0.1% |
| Western Africa | 37 | 0.0% |
| Western Asia | 61 | 0.0% |
| Western Europe | 16 | 0.0% | View All 63 Rows |
Sex and Age in Webb County
Sex and Age in Webb County
The most populous age groups in Webb County are 15 to 19 Years (12,374 | 9.3%) for men and 10 to 14 Years (12,926 | 9.6%) for women.

| Age Bracket | Male | Female |
| Under 5 Years | 11,493 (8.7%) | 11,097 (8.2%) |
| 5 to 9 Years | 12,290 (9.3%) | 10,897 (8.1%) |
| 10 to 14 Years | 12,046 (9.1%) | 12,926 (9.6%) |
| 15 to 19 Years | 12,374 (9.3%) | 11,754 (8.7%) |
| 20 to 24 Years | 11,010 (8.3%) | 10,865 (8.1%) |
| 25 to 29 Years | 9,962 (7.5%) | 9,365 (7.0%) |
| 30 to 34 Years | 8,874 (6.7%) | 8,109 (6.0%) |
| 35 to 39 Years | 8,842 (6.7%) | 8,783 (6.5%) |
| 40 to 44 Years | 8,168 (6.2%) | 7,732 (5.7%) |
| 45 to 49 Years | 8,171 (6.2%) | 8,559 (6.4%) |
| 50 to 54 Years | 6,944 (5.2%) | 7,614 (5.7%) |
| 55 to 59 Years | 6,382 (4.8%) | 6,642 (4.9%) |
| 60 to 64 Years | 4,792 (3.6%) | 5,636 (4.2%) |
| 65 to 69 Years | 4,003 (3.0%) | 4,735 (3.5%) |
| 70 to 74 Years | 3,004 (2.3%) | 3,594 (2.7%) |
| 75 to 79 Years | 1,866 (1.4%) | 2,683 (2.0%) |
| 80 to 84 Years | 886 (0.7%) | 1,772 (1.3%) |
| 85 Years and over | 1,388 (1.1%) | 2,024 (1.5%) |
| Total | 132,495 (100.0%) | 134,787 (100.0%) |
Families and Households in Webb County
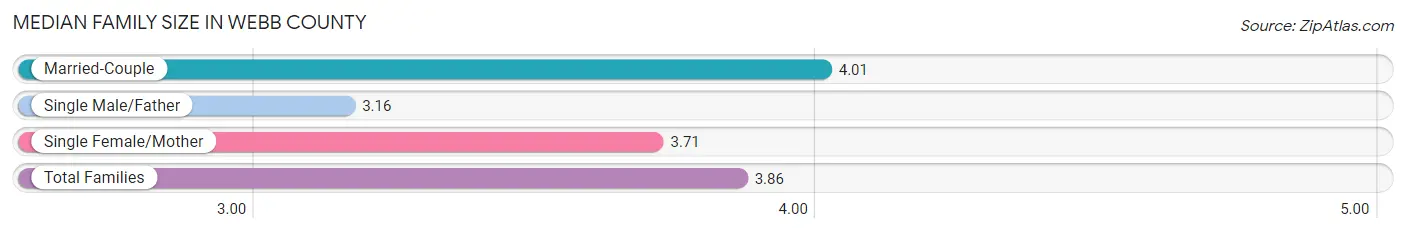
Median Family Size in Webb County
The median family size in Webb County is 3.86 persons per family, with married-couple families (40,223 | 64.6%) accounting for the largest median family size of 4.01 persons per family. On the other hand, single male/father families (5,230 | 8.4%) represent the smallest median family size with 3.16 persons per family.
| Family Type | # Families | Family Size |
| Married-Couple | 40,223 (64.6%) | 4.01 |
| Single Male/Father | 5,230 (8.4%) | 3.16 |
| Single Female/Mother | 16,814 (27.0%) | 3.71 |
| Total Families | 62,267 (100.0%) | 3.86 |
Median Household Size in Webb County
The median household size in Webb County is 3.40 persons per household, with married-couple households (40,223 | 51.7%) accounting for the largest median household size of 4.03 persons per household. non-family households (15,530 | 20.0%) represent the smallest median household size with 1.17 persons per household.
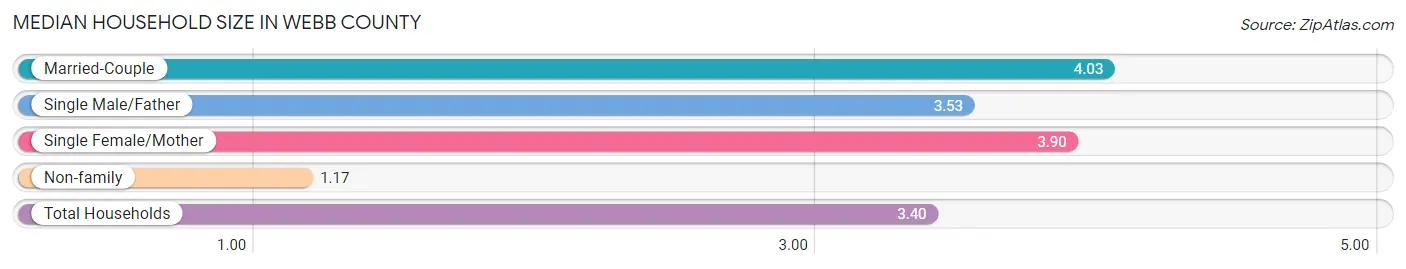
| Household Type | # Households | Household Size |
| Married-Couple | 40,223 (51.7%) | 4.03 |
| Single Male/Father | 5,230 (6.7%) | 3.53 |
| Single Female/Mother | 16,814 (21.6%) | 3.90 |
| Non-family | 15,530 (20.0%) | 1.17 |
| Total Households | 77,797 (100.0%) | 3.40 |
Household Size by Marriage Status in Webb County
Out of a total of 77,797 households in Webb County, 62,267 (80.0%) are family households, while 15,530 (20.0%) are nonfamily households. The most numerous type of family households are 4-person households, comprising 14,887, and the most common type of nonfamily households are 1-person households, comprising 13,287.
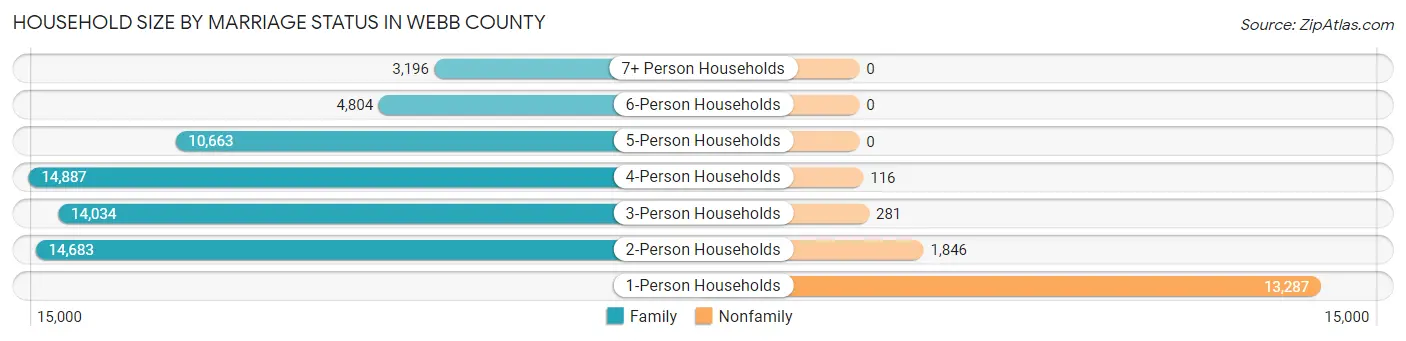
| Household Size | Family Households | Nonfamily Households |
| 1-Person Households | - | 13,287 (17.1%) |
| 2-Person Households | 14,683 (18.9%) | 1,846 (2.4%) |
| 3-Person Households | 14,034 (18.0%) | 281 (0.4%) |
| 4-Person Households | 14,887 (19.1%) | 116 (0.2%) |
| 5-Person Households | 10,663 (13.7%) | 0 (0.0%) |
| 6-Person Households | 4,804 (6.2%) | 0 (0.0%) |
| 7+ Person Households | 3,196 (4.1%) | 0 (0.0%) |
| Total | 62,267 (80.0%) | 15,530 (20.0%) |
Female Fertility in Webb County
Fertility by Age in Webb County
Average fertility rate in Webb County is 66.0 births per 1,000 women. Women in the age bracket of 20 to 34 years have the highest fertility rate with 120.0 births per 1,000 women. Women in the age bracket of 20 to 34 years acount for 77.4% of all women with births.
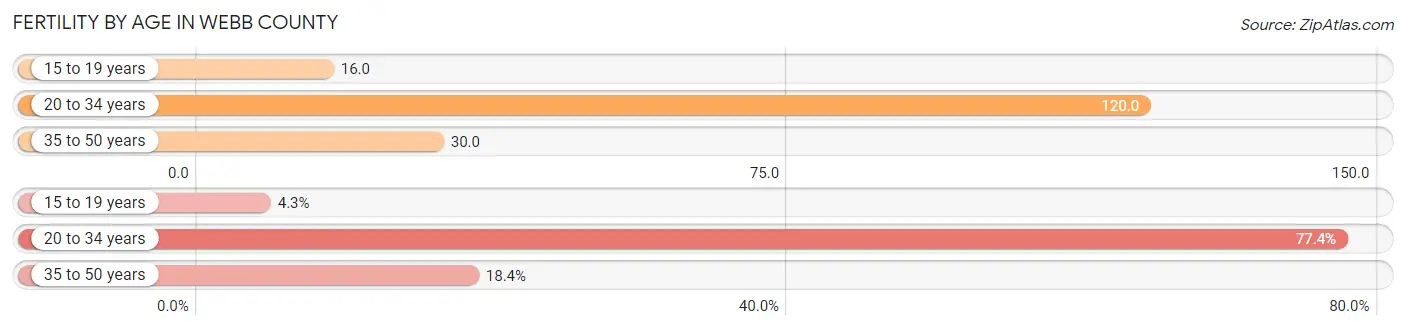
| Age Bracket | Women with Births | Births / 1,000 Women |
| 15 to 19 years | 188 (4.3%) | 16.0 |
| 20 to 34 years | 3,410 (77.4%) | 120.0 |
| 35 to 50 years | 810 (18.4%) | 30.0 |
| Total | 4,408 (100.0%) | 66.0 |
Fertility by Age by Marriage Status in Webb County
56.9% of women with births (4,408) in Webb County are married. The highest percentage of unmarried women with births falls into 15 to 19 years age bracket with 86.2% of them unmarried at the time of birth, while the lowest percentage of unmarried women with births belong to 20 to 34 years age bracket with 40.3% of them unmarried.
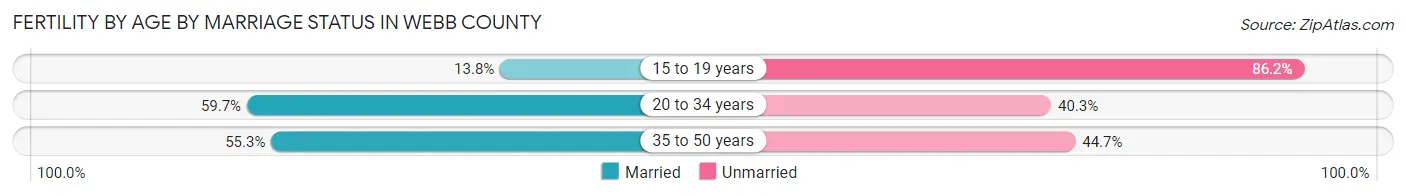
| Age Bracket | Married | Unmarried |
| 15 to 19 years | 26 (13.8%) | 162 (86.2%) |
| 20 to 34 years | 2,036 (59.7%) | 1,374 (40.3%) |
| 35 to 50 years | 448 (55.3%) | 362 (44.7%) |
| Total | 2,508 (56.9%) | 1,900 (43.1%) |
Fertility by Education in Webb County
Average fertility rate in Webb County is 66.0 births per 1,000 women. Women with the education attainment of graduate degree have the highest fertility rate of 90.0 births per 1,000 women, while women with the education attainment of less than high school have the lowest fertility at 41.0 births per 1,000 women. Women with the education attainment of college or associate's degree represent 35.7% of all women with births.
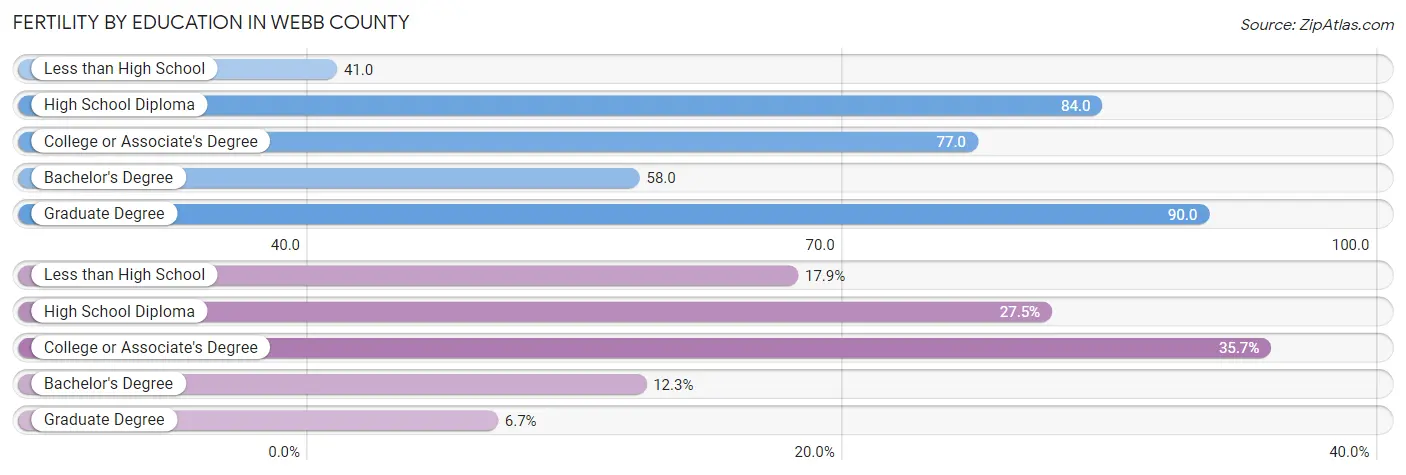
| Educational Attainment | Women with Births | Births / 1,000 Women |
| Less than High School | 791 (17.9%) | 41.0 |
| High School Diploma | 1,210 (27.5%) | 84.0 |
| College or Associate's Degree | 1,572 (35.7%) | 77.0 |
| Bachelor's Degree | 540 (12.2%) | 58.0 |
| Graduate Degree | 295 (6.7%) | 90.0 |
| Total | 4,408 (100.0%) | 66.0 |
Fertility by Education by Marriage Status in Webb County
43.1% of women with births in Webb County are unmarried. Women with the educational attainment of graduate degree are most likely to be married with 94.9% of them married at childbirth, while women with the educational attainment of less than high school are least likely to be married with 67.3% of them unmarried at childbirth.
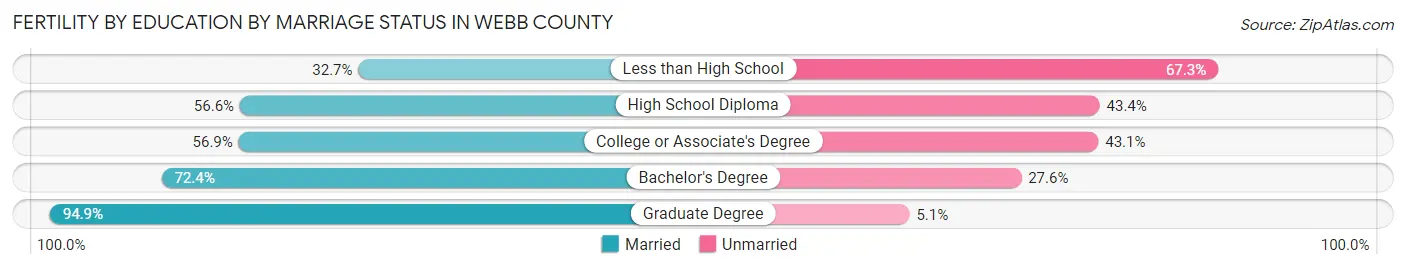
| Educational Attainment | Married | Unmarried |
| Less than High School | 259 (32.7%) | 532 (67.3%) |
| High School Diploma | 685 (56.6%) | 525 (43.4%) |
| College or Associate's Degree | 894 (56.9%) | 678 (43.1%) |
| Bachelor's Degree | 391 (72.4%) | 149 (27.6%) |
| Graduate Degree | 280 (94.9%) | 15 (5.1%) |
| Total | 2,508 (56.9%) | 1,900 (43.1%) |
Employment Characteristics in Webb County
Employment by Class of Employer in Webb County
Among the 110,657 employed individuals in Webb County, private company employees (77,084 | 69.7%), local government employees (10,398 | 9.4%), and self-employed (not incorporated) (7,946 | 7.2%) make up the most common classes of employment.
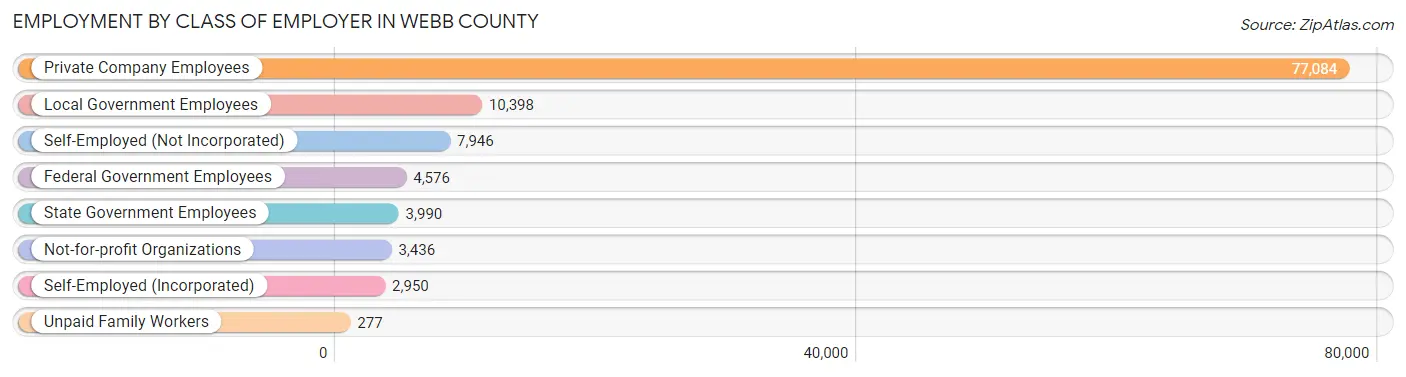
| Employer Class | # Employees | % Employees |
| Private Company Employees | 77,084 | 69.7% |
| Self-Employed (Incorporated) | 2,950 | 2.7% |
| Self-Employed (Not Incorporated) | 7,946 | 7.2% |
| Not-for-profit Organizations | 3,436 | 3.1% |
| Local Government Employees | 10,398 | 9.4% |
| State Government Employees | 3,990 | 3.6% |
| Federal Government Employees | 4,576 | 4.1% |
| Unpaid Family Workers | 277 | 0.3% |
| Total | 110,657 | 100.0% |
Employment Status by Age in Webb County
According to the labor force statistics for Webb County, out of the total population over 16 years of age (191,500), 62.0% or 118,730 individuals are in the labor force, with 5.9% or 7,005 of them unemployed. The age group with the highest labor force participation rate is 45 to 54 years, with 80.5% or 25,187 individuals in the labor force. Within the labor force, the 16 to 19 years age range has the highest percentage of unemployed individuals, with 14.9% or 720 of them being unemployed.
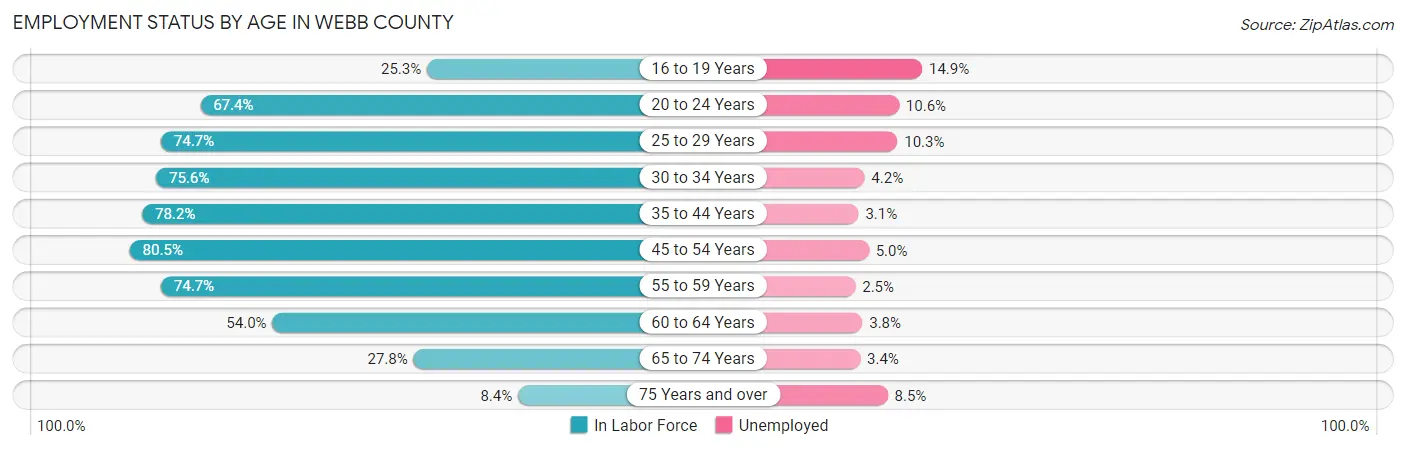
| Age Bracket | In Labor Force | Unemployed |
| 16 to 19 Years | 4,831 (25.3%) | 720 (14.9%) |
| 20 to 24 Years | 14,744 (67.4%) | 1,563 (10.6%) |
| 25 to 29 Years | 14,437 (74.7%) | 1,487 (10.3%) |
| 30 to 34 Years | 12,839 (75.6%) | 539 (4.2%) |
| 35 to 44 Years | 26,217 (78.2%) | 813 (3.1%) |
| 45 to 54 Years | 25,187 (80.5%) | 1,259 (5.0%) |
| 55 to 59 Years | 9,729 (74.7%) | 243 (2.5%) |
| 60 to 64 Years | 5,631 (54.0%) | 214 (3.8%) |
| 65 to 74 Years | 4,263 (27.8%) | 145 (3.4%) |
| 75 Years and over | 892 (8.4%) | 76 (8.5%) |
| Total | 118,730 (62.0%) | 7,005 (5.9%) |
Employment Status by Educational Attainment in Webb County
According to labor force statistics for Webb County, 75.5% of individuals (94,054) out of the total population between 25 and 64 years of age (124,575) are in the labor force, with 4.8% or 4,515 of them being unemployed. The group with the highest labor force participation rate are those with the educational attainment of bachelor's degree or higher, with 84.9% or 23,232 individuals in the labor force. Within the labor force, individuals with high school diploma education have the highest percentage of unemployment, with 6.8% or 1,346 of them being unemployed.
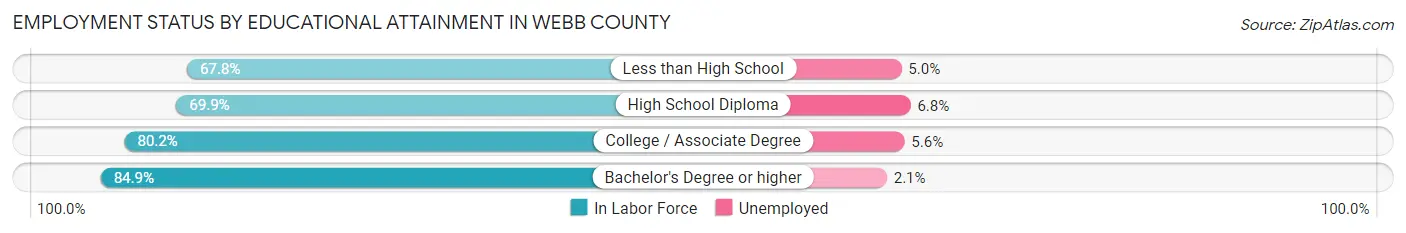
| Educational Attainment | In Labor Force | Unemployed |
| Less than High School | 23,139 (67.8%) | 1,706 (5.0%) |
| High School Diploma | 19,797 (69.9%) | 1,926 (6.8%) |
| College / Associate Degree | 27,878 (80.2%) | 1,947 (5.6%) |
| Bachelor's Degree or higher | 23,232 (84.9%) | 575 (2.1%) |
| Total | 94,054 (75.5%) | 5,980 (4.8%) |
Employment Occupations by Sex in Webb County
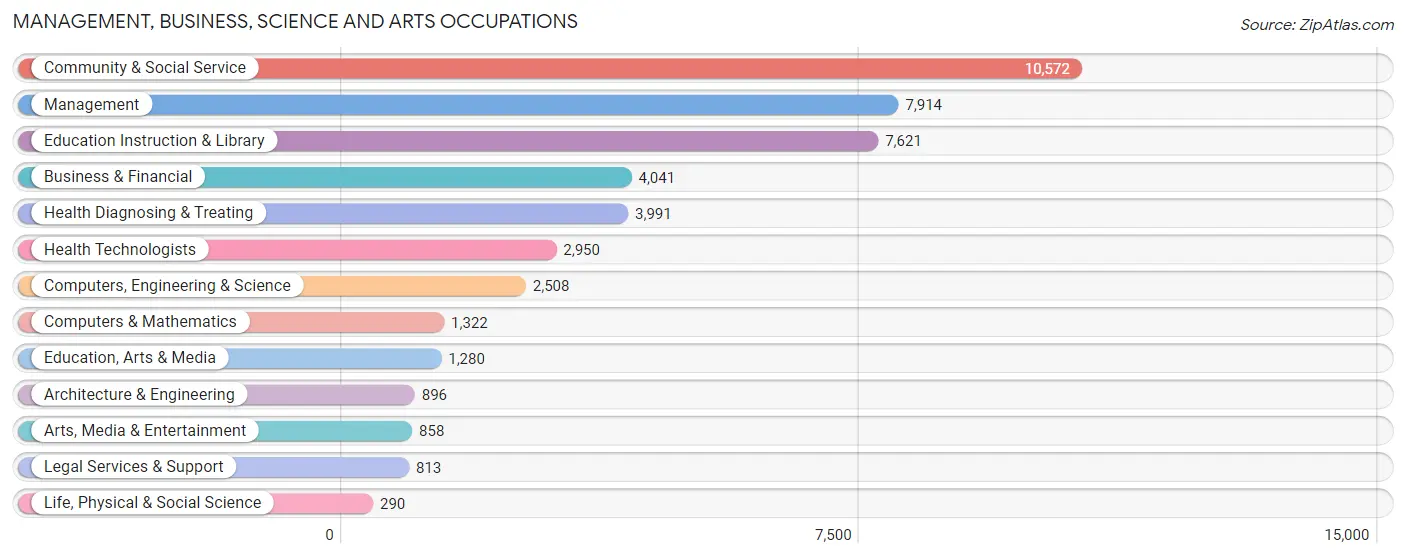
Management, Business, Science and Arts Occupations
The most common Management, Business, Science and Arts occupations in Webb County are Community & Social Service (10,572 | 9.5%), Management (7,914 | 7.1%), Education Instruction & Library (7,621 | 6.8%), Business & Financial (4,041 | 3.6%), and Health Diagnosing & Treating (3,991 | 3.6%).
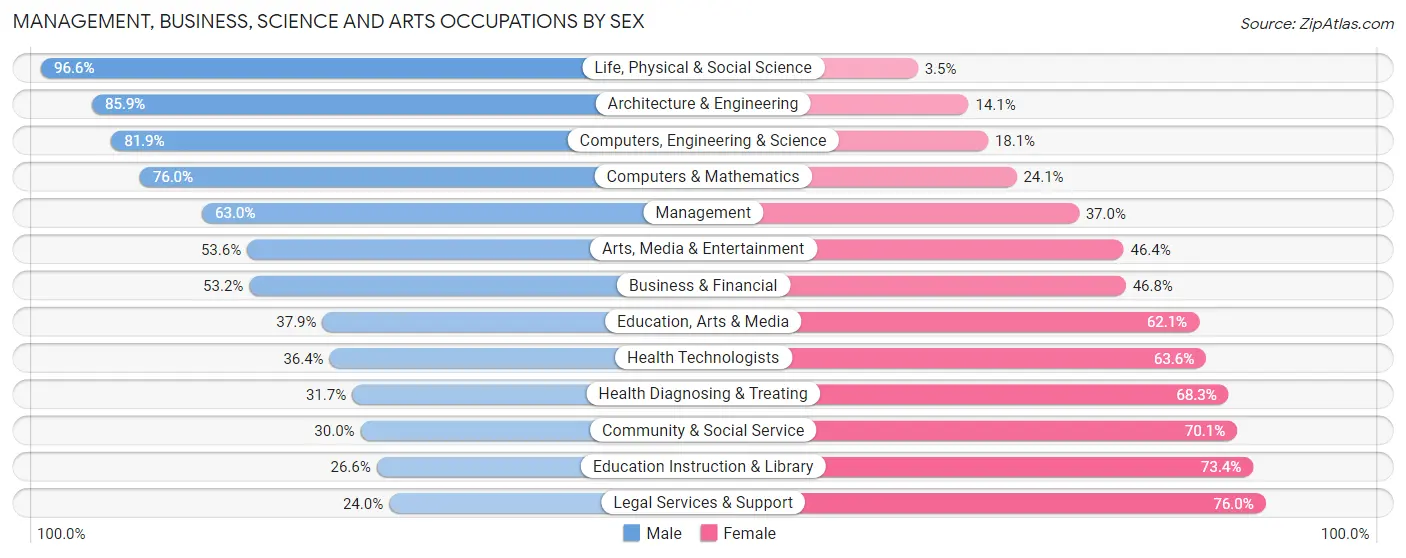
Management, Business, Science and Arts Occupations by Sex
Within the Management, Business, Science and Arts occupations in Webb County, the most male-oriented occupations are Life, Physical & Social Science (96.6%), Architecture & Engineering (85.9%), and Computers, Engineering & Science (81.9%), while the most female-oriented occupations are Legal Services & Support (76.0%), Education Instruction & Library (73.4%), and Community & Social Service (70.1%).
| Occupation | Male | Female |
| Management | 4,983 (63.0%) | 2,931 (37.0%) |
| Business & Financial | 2,148 (53.2%) | 1,893 (46.8%) |
| Computers, Engineering & Science | 2,054 (81.9%) | 454 (18.1%) |
| Computers & Mathematics | 1,004 (75.9%) | 318 (24.0%) |
| Architecture & Engineering | 770 (85.9%) | 126 (14.1%) |
| Life, Physical & Social Science | 280 (96.6%) | 10 (3.5%) |
| Community & Social Service | 3,166 (29.9%) | 7,406 (70.1%) |
| Education, Arts & Media | 485 (37.9%) | 795 (62.1%) |
| Legal Services & Support | 195 (24.0%) | 618 (76.0%) |
| Education Instruction & Library | 2,026 (26.6%) | 5,595 (73.4%) |
| Arts, Media & Entertainment | 460 (53.6%) | 398 (46.4%) |
| Health Diagnosing & Treating | 1,265 (31.7%) | 2,726 (68.3%) |
| Health Technologists | 1,074 (36.4%) | 1,876 (63.6%) |
| Total (Category) | 13,616 (46.9%) | 15,410 (53.1%) |
| Total (Overall) | 63,063 (56.5%) | 48,543 (43.5%) |
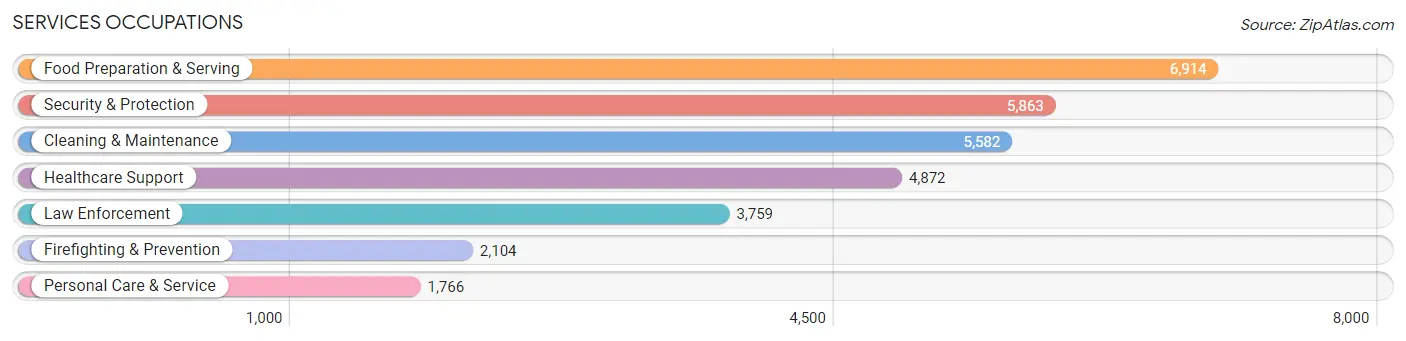
Services Occupations
The most common Services occupations in Webb County are Food Preparation & Serving (6,914 | 6.2%), Security & Protection (5,863 | 5.2%), Cleaning & Maintenance (5,582 | 5.0%), Healthcare Support (4,872 | 4.4%), and Law Enforcement (3,759 | 3.4%).
Services Occupations by Sex
Within the Services occupations in Webb County, the most male-oriented occupations are Law Enforcement (88.9%), Security & Protection (82.2%), and Firefighting & Prevention (70.1%), while the most female-oriented occupations are Healthcare Support (94.1%), Personal Care & Service (74.1%), and Food Preparation & Serving (56.9%).
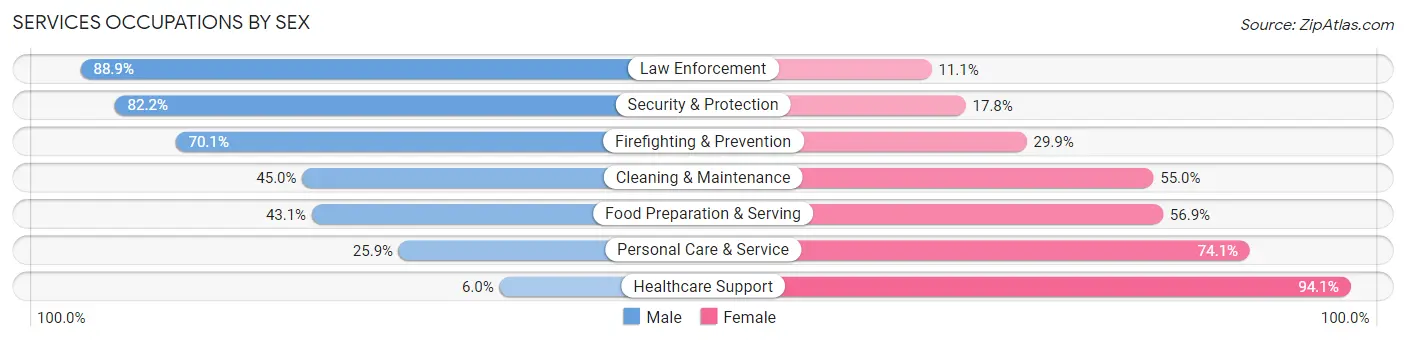
| Occupation | Male | Female |
| Healthcare Support | 290 (5.9%) | 4,582 (94.1%) |
| Security & Protection | 4,817 (82.2%) | 1,046 (17.8%) |
| Firefighting & Prevention | 1,475 (70.1%) | 629 (29.9%) |
| Law Enforcement | 3,342 (88.9%) | 417 (11.1%) |
| Food Preparation & Serving | 2,980 (43.1%) | 3,934 (56.9%) |
| Cleaning & Maintenance | 2,512 (45.0%) | 3,070 (55.0%) |
| Personal Care & Service | 457 (25.9%) | 1,309 (74.1%) |
| Total (Category) | 11,056 (44.2%) | 13,941 (55.8%) |
| Total (Overall) | 63,063 (56.5%) | 48,543 (43.5%) |
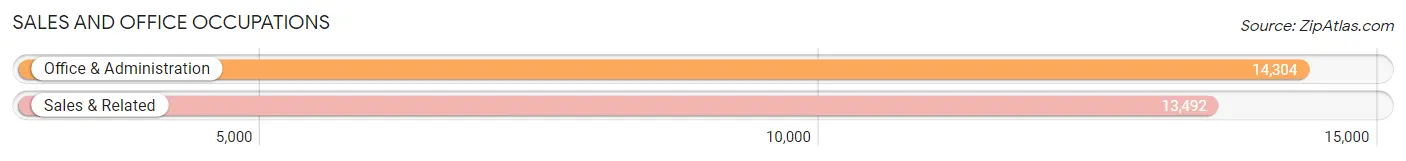
Sales and Office Occupations
The most common Sales and Office occupations in Webb County are Office & Administration (14,304 | 12.8%), and Sales & Related (13,492 | 12.1%).
Sales and Office Occupations by Sex
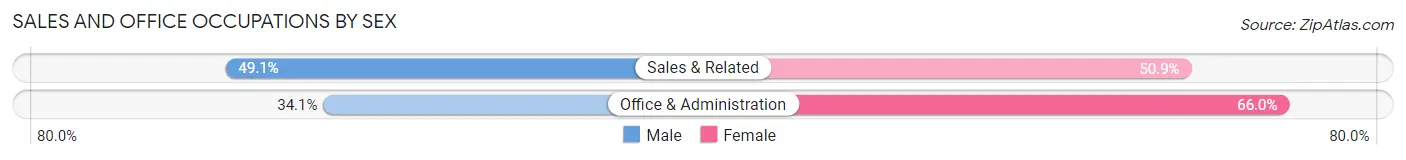
| Occupation | Male | Female |
| Sales & Related | 6,625 (49.1%) | 6,867 (50.9%) |
| Office & Administration | 4,870 (34.1%) | 9,434 (65.9%) |
| Total (Category) | 11,495 (41.3%) | 16,301 (58.7%) |
| Total (Overall) | 63,063 (56.5%) | 48,543 (43.5%) |
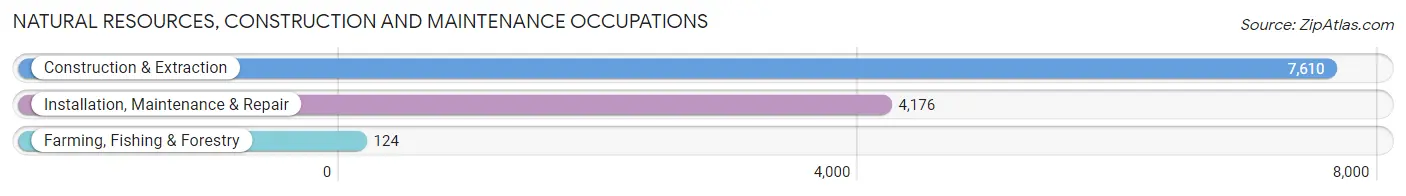
Natural Resources, Construction and Maintenance Occupations
The most common Natural Resources, Construction and Maintenance occupations in Webb County are Construction & Extraction (7,610 | 6.8%), Installation, Maintenance & Repair (4,176 | 3.7%), and Farming, Fishing & Forestry (124 | 0.1%).
Natural Resources, Construction and Maintenance Occupations by Sex
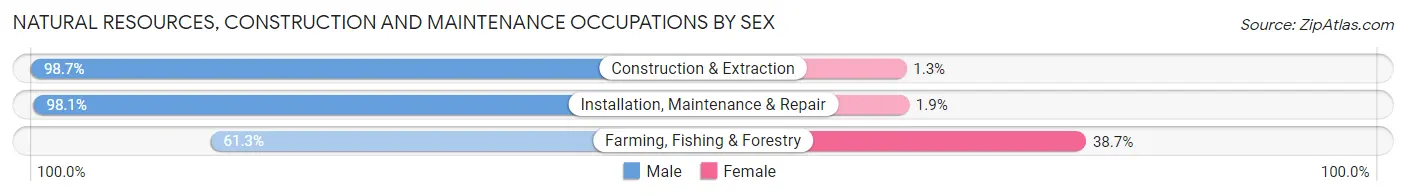
| Occupation | Male | Female |
| Farming, Fishing & Forestry | 76 (61.3%) | 48 (38.7%) |
| Construction & Extraction | 7,508 (98.7%) | 102 (1.3%) |
| Installation, Maintenance & Repair | 4,098 (98.1%) | 78 (1.9%) |
| Total (Category) | 11,682 (98.1%) | 228 (1.9%) |
| Total (Overall) | 63,063 (56.5%) | 48,543 (43.5%) |
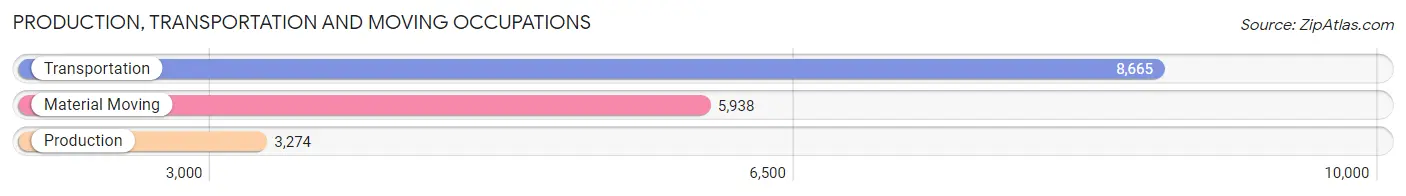
Production, Transportation and Moving Occupations
The most common Production, Transportation and Moving occupations in Webb County are Transportation (8,665 | 7.8%), Material Moving (5,938 | 5.3%), and Production (3,274 | 2.9%).
Production, Transportation and Moving Occupations by Sex
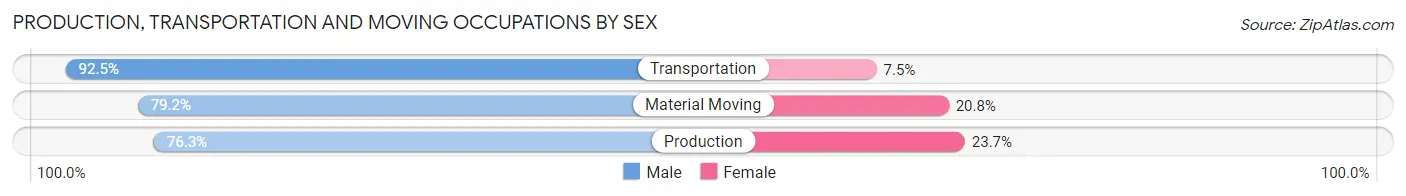
| Occupation | Male | Female |
| Production | 2,497 (76.3%) | 777 (23.7%) |
| Transportation | 8,012 (92.5%) | 653 (7.5%) |
| Material Moving | 4,705 (79.2%) | 1,233 (20.8%) |
| Total (Category) | 15,214 (85.1%) | 2,663 (14.9%) |
| Total (Overall) | 63,063 (56.5%) | 48,543 (43.5%) |
Employment Industries by Sex in Webb County
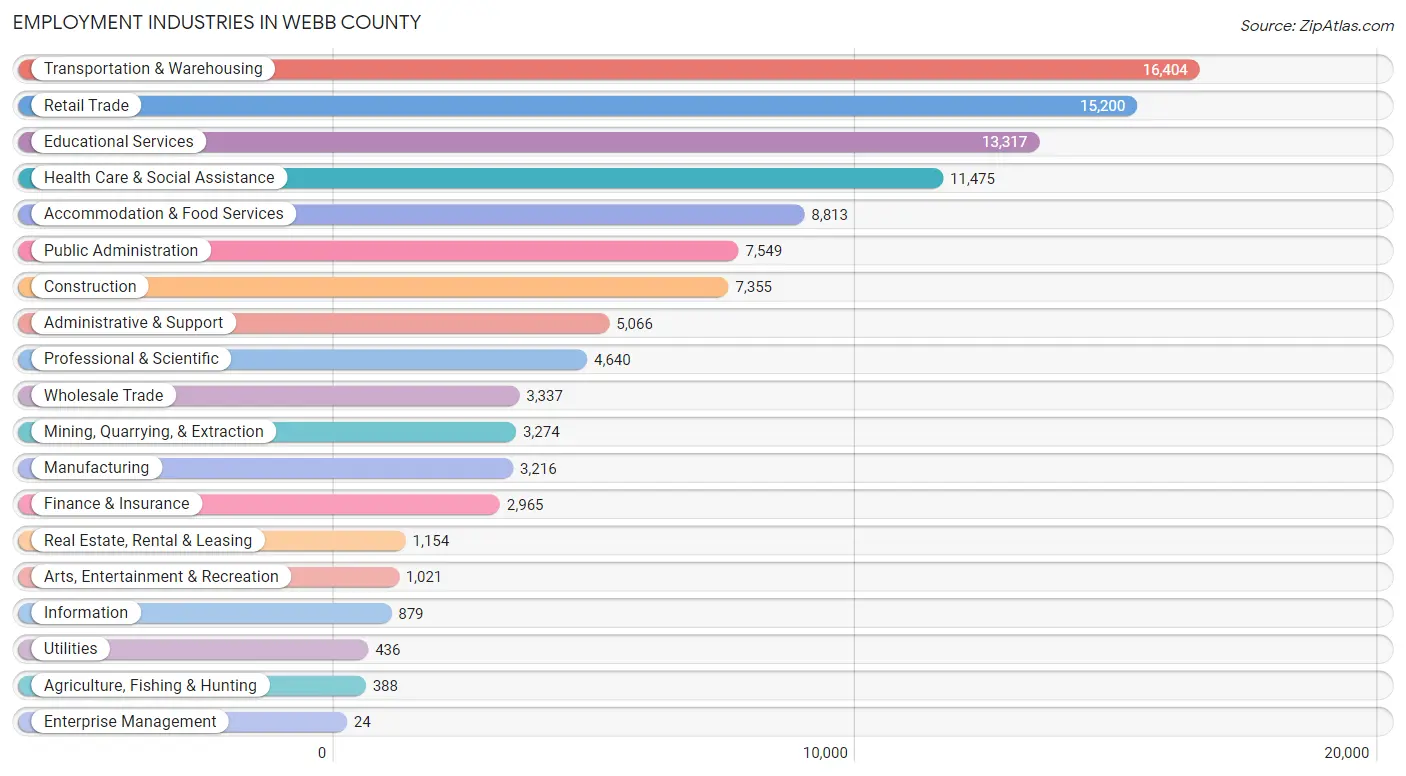
Employment Industries in Webb County
The major employment industries in Webb County include Transportation & Warehousing (16,404 | 14.7%), Retail Trade (15,200 | 13.6%), Educational Services (13,317 | 11.9%), Health Care & Social Assistance (11,475 | 10.3%), and Accommodation & Food Services (8,813 | 7.9%).
Employment Industries by Sex in Webb County
The Webb County industries that see more men than women are Mining, Quarrying, & Extraction (96.6%), Construction (91.8%), and Utilities (86.7%), whereas the industries that tend to have a higher number of women are Health Care & Social Assistance (79.8%), Enterprise Management (75.0%), and Educational Services (72.5%).
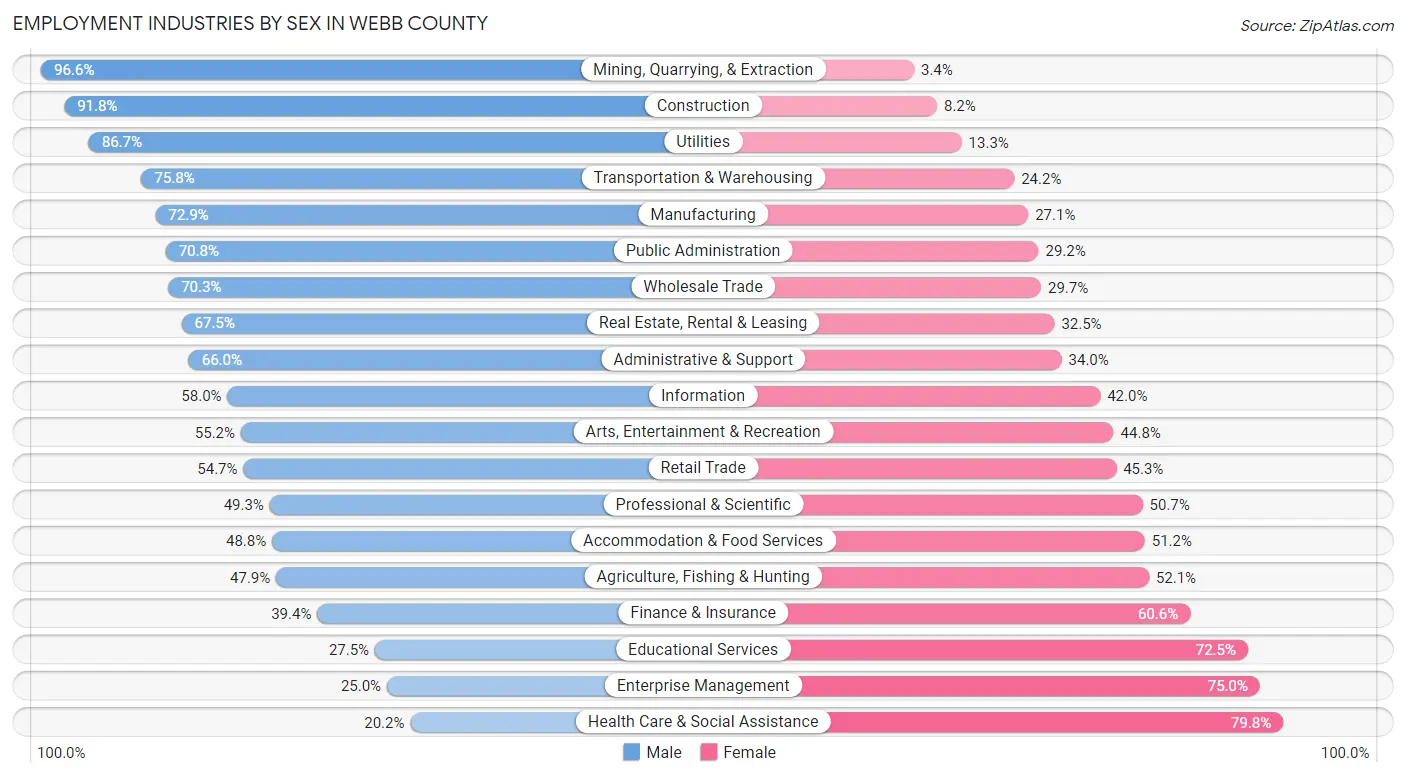
| Industry | Male | Female |
| Agriculture, Fishing & Hunting | 186 (47.9%) | 202 (52.1%) |
| Mining, Quarrying, & Extraction | 3,162 (96.6%) | 112 (3.4%) |
| Construction | 6,752 (91.8%) | 603 (8.2%) |
| Manufacturing | 2,345 (72.9%) | 871 (27.1%) |
| Wholesale Trade | 2,345 (70.3%) | 992 (29.7%) |
| Retail Trade | 8,318 (54.7%) | 6,882 (45.3%) |
| Transportation & Warehousing | 12,437 (75.8%) | 3,967 (24.2%) |
| Utilities | 378 (86.7%) | 58 (13.3%) |
| Information | 510 (58.0%) | 369 (42.0%) |
| Finance & Insurance | 1,169 (39.4%) | 1,796 (60.6%) |
| Real Estate, Rental & Leasing | 779 (67.5%) | 375 (32.5%) |
| Professional & Scientific | 2,286 (49.3%) | 2,354 (50.7%) |
| Enterprise Management | 6 (25.0%) | 18 (75.0%) |
| Administrative & Support | 3,344 (66.0%) | 1,722 (34.0%) |
| Educational Services | 3,659 (27.5%) | 9,658 (72.5%) |
| Health Care & Social Assistance | 2,314 (20.2%) | 9,161 (79.8%) |
| Arts, Entertainment & Recreation | 564 (55.2%) | 457 (44.8%) |
| Accommodation & Food Services | 4,300 (48.8%) | 4,513 (51.2%) |
| Public Administration | 5,344 (70.8%) | 2,205 (29.2%) |
| Total | 63,063 (56.5%) | 48,543 (43.5%) |
Education in Webb County
School Enrollment in Webb County
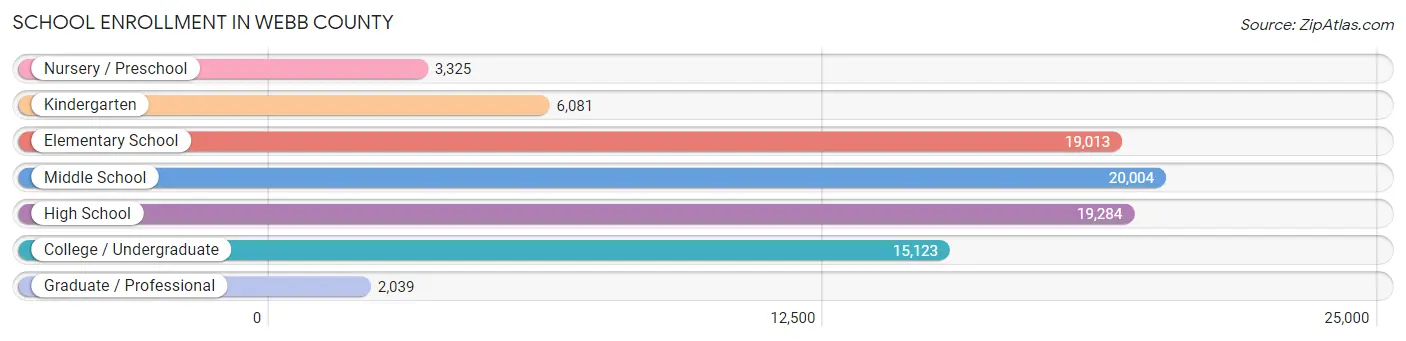
The most common levels of schooling among the 84,869 students in Webb County are middle school (20,004 | 23.6%), high school (19,284 | 22.7%), and elementary school (19,013 | 22.4%).
| School Level | # Students | % Students |
| Nursery / Preschool | 3,325 | 3.9% |
| Kindergarten | 6,081 | 7.2% |
| Elementary School | 19,013 | 22.4% |
| Middle School | 20,004 | 23.6% |
| High School | 19,284 | 22.7% |
| College / Undergraduate | 15,123 | 17.8% |
| Graduate / Professional | 2,039 | 2.4% |
| Total | 84,869 | 100.0% |
School Enrollment by Age by Funding Source in Webb County
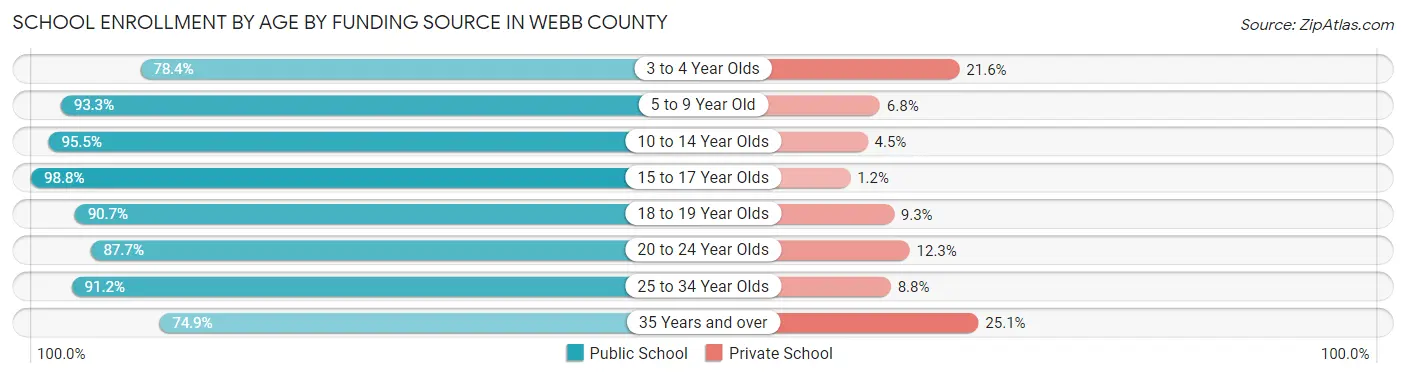
Out of a total of 84,869 students who are enrolled in schools in Webb County, 6,026 (7.1%) attend a private institution, while the remaining 78,843 (92.9%) are enrolled in public schools. The age group of 35 years and over has the highest likelihood of being enrolled in private schools, with 659 (25.1% in the age bracket) enrolled. Conversely, the age group of 15 to 17 year olds has the lowest likelihood of being enrolled in a private school, with 13,874 (98.8% in the age bracket) attending a public institution.
| Age Bracket | Public School | Private School |
| 3 to 4 Year Olds | 2,623 (78.4%) | 721 (21.6%) |
| 5 to 9 Year Old | 20,980 (93.2%) | 1,518 (6.8%) |
| 10 to 14 Year Olds | 23,619 (95.5%) | 1,103 (4.5%) |
| 15 to 17 Year Olds | 13,874 (98.8%) | 171 (1.2%) |
| 18 to 19 Year Olds | 6,126 (90.7%) | 631 (9.3%) |
| 20 to 24 Year Olds | 7,142 (87.7%) | 1,000 (12.3%) |
| 25 to 34 Year Olds | 2,496 (91.2%) | 240 (8.8%) |
| 35 Years and over | 1,966 (74.9%) | 659 (25.1%) |
| Total | 78,843 (92.9%) | 6,026 (7.1%) |
Educational Attainment by Field of Study in Webb County
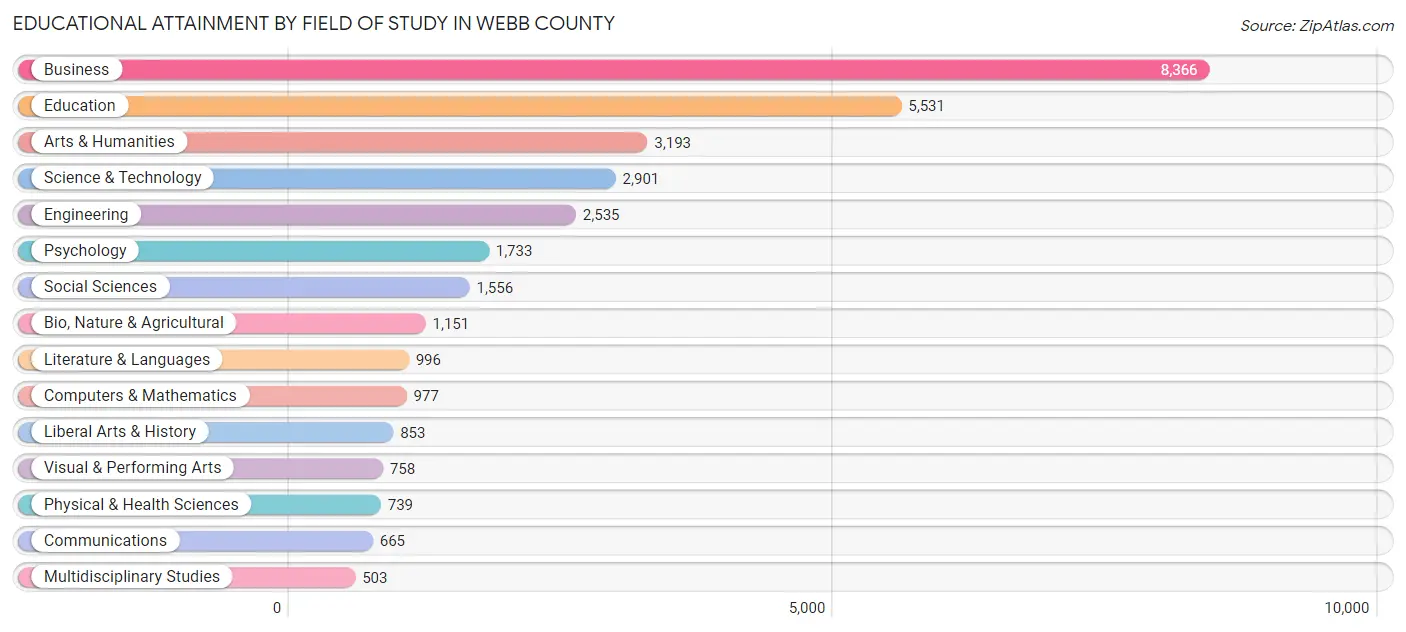
Business (8,366 | 25.8%), education (5,531 | 17.0%), arts & humanities (3,193 | 9.8%), science & technology (2,901 | 8.9%), and engineering (2,535 | 7.8%) are the most common fields of study among 32,457 individuals in Webb County who have obtained a bachelor's degree or higher.
| Field of Study | # Graduates | % Graduates |
| Computers & Mathematics | 977 | 3.0% |
| Bio, Nature & Agricultural | 1,151 | 3.5% |
| Physical & Health Sciences | 739 | 2.3% |
| Psychology | 1,733 | 5.3% |
| Social Sciences | 1,556 | 4.8% |
| Engineering | 2,535 | 7.8% |
| Multidisciplinary Studies | 503 | 1.5% |
| Science & Technology | 2,901 | 8.9% |
| Business | 8,366 | 25.8% |
| Education | 5,531 | 17.0% |
| Literature & Languages | 996 | 3.1% |
| Liberal Arts & History | 853 | 2.6% |
| Visual & Performing Arts | 758 | 2.3% |
| Communications | 665 | 2.1% |
| Arts & Humanities | 3,193 | 9.8% |
| Total | 32,457 | 100.0% |
Transportation & Commute in Webb County
Vehicle Availability by Sex in Webb County
The most prevalent vehicle ownership categories in Webb County are males with 2 vehicles (25,502, accounting for 40.8%) and females with 2 vehicles (17,769, making up 53.2%).
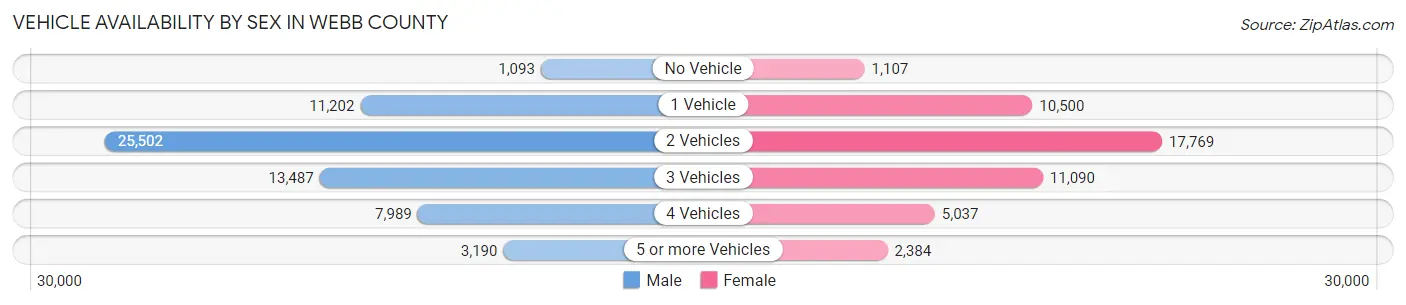
| Vehicles Available | Male | Female |
| No Vehicle | 1,093 (1.8%) | 1,107 (2.3%) |
| 1 Vehicle | 11,202 (17.9%) | 10,500 (21.9%) |
| 2 Vehicles | 25,502 (40.8%) | 17,769 (37.1%) |
| 3 Vehicles | 13,487 (21.6%) | 11,090 (23.2%) |
| 4 Vehicles | 7,989 (12.8%) | 5,037 (10.5%) |
| 5 or more Vehicles | 3,190 (5.1%) | 2,384 (5.0%) |
| Total | 62,463 (100.0%) | 47,887 (100.0%) |
Commute Time in Webb County
The most frequently occuring commute durations in Webb County are 15 to 19 minutes (23,904 commuters, 22.7%), 10 to 14 minutes (19,168 commuters, 18.2%), and 20 to 24 minutes (18,398 commuters, 17.5%).
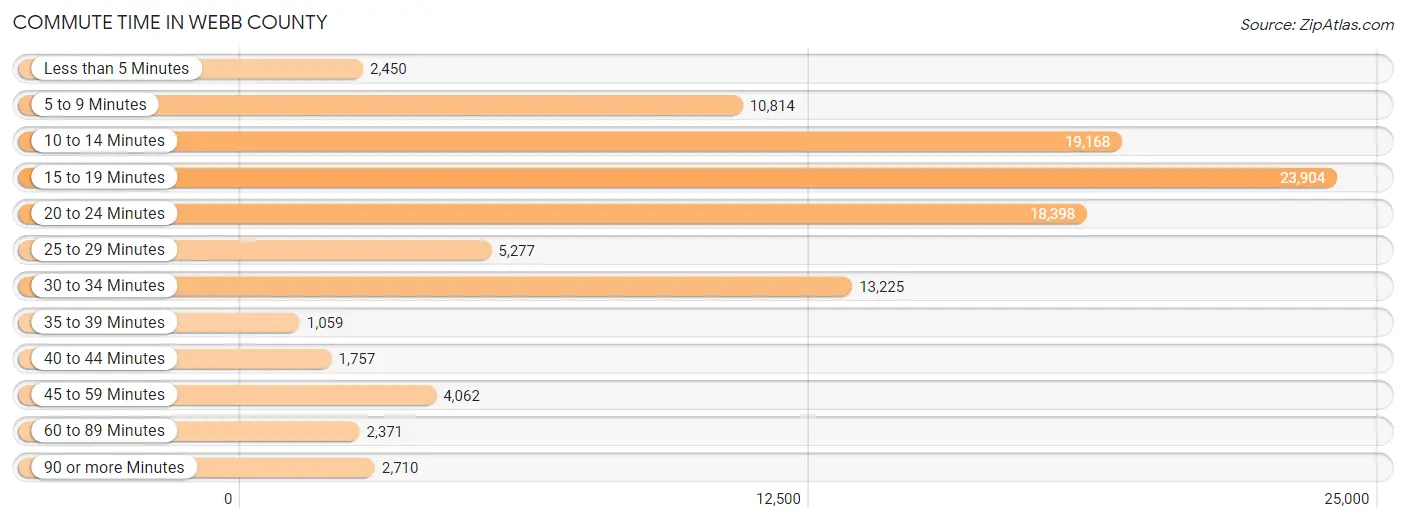
| Commute Time | # Commuters | % Commuters |
| Less than 5 Minutes | 2,450 | 2.3% |
| 5 to 9 Minutes | 10,814 | 10.3% |
| 10 to 14 Minutes | 19,168 | 18.2% |
| 15 to 19 Minutes | 23,904 | 22.7% |
| 20 to 24 Minutes | 18,398 | 17.5% |
| 25 to 29 Minutes | 5,277 | 5.0% |
| 30 to 34 Minutes | 13,225 | 12.6% |
| 35 to 39 Minutes | 1,059 | 1.0% |
| 40 to 44 Minutes | 1,757 | 1.7% |
| 45 to 59 Minutes | 4,062 | 3.9% |
| 60 to 89 Minutes | 2,371 | 2.2% |
| 90 or more Minutes | 2,710 | 2.6% |
Commute Time by Sex in Webb County
The most common commute times in Webb County are 15 to 19 minutes (12,788 commuters, 21.3%) for males and 15 to 19 minutes (11,116 commuters, 24.5%) for females.
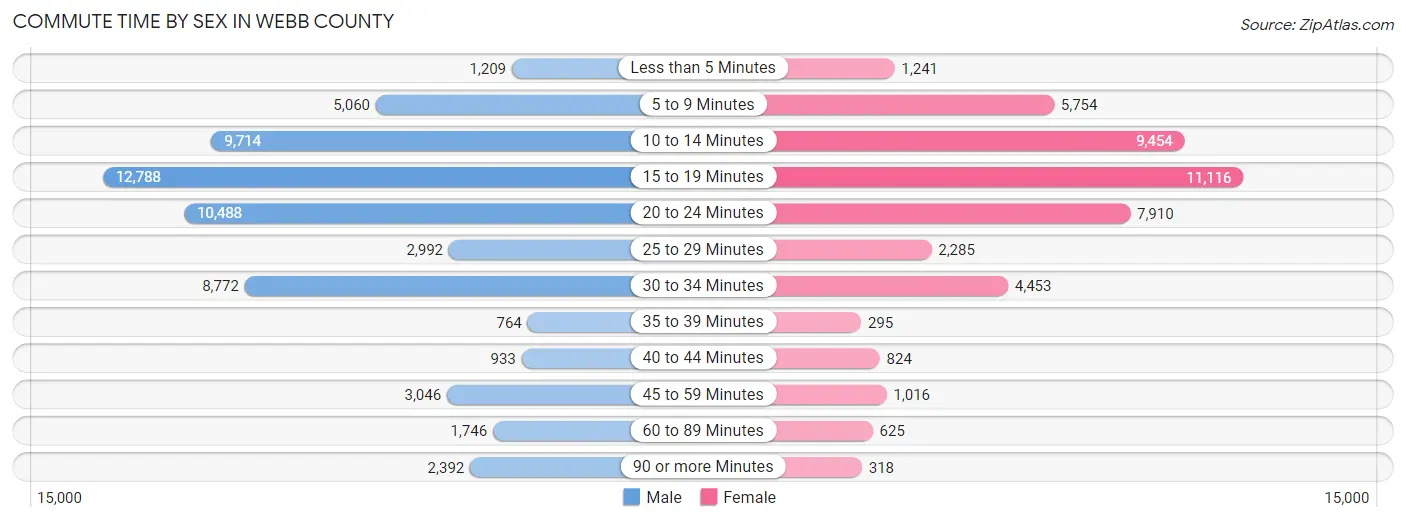
| Commute Time | Male | Female |
| Less than 5 Minutes | 1,209 (2.0%) | 1,241 (2.7%) |
| 5 to 9 Minutes | 5,060 (8.5%) | 5,754 (12.7%) |
| 10 to 14 Minutes | 9,714 (16.2%) | 9,454 (20.9%) |
| 15 to 19 Minutes | 12,788 (21.3%) | 11,116 (24.5%) |
| 20 to 24 Minutes | 10,488 (17.5%) | 7,910 (17.5%) |
| 25 to 29 Minutes | 2,992 (5.0%) | 2,285 (5.1%) |
| 30 to 34 Minutes | 8,772 (14.6%) | 4,453 (9.8%) |
| 35 to 39 Minutes | 764 (1.3%) | 295 (0.6%) |
| 40 to 44 Minutes | 933 (1.6%) | 824 (1.8%) |
| 45 to 59 Minutes | 3,046 (5.1%) | 1,016 (2.2%) |
| 60 to 89 Minutes | 1,746 (2.9%) | 625 (1.4%) |
| 90 or more Minutes | 2,392 (4.0%) | 318 (0.7%) |
Time of Departure to Work by Sex in Webb County
The most frequent times of departure to work in Webb County are 8:00 AM to 8:29 AM (9,390, 15.7%) for males and 7:00 AM to 7:29 AM (7,986, 17.6%) for females.
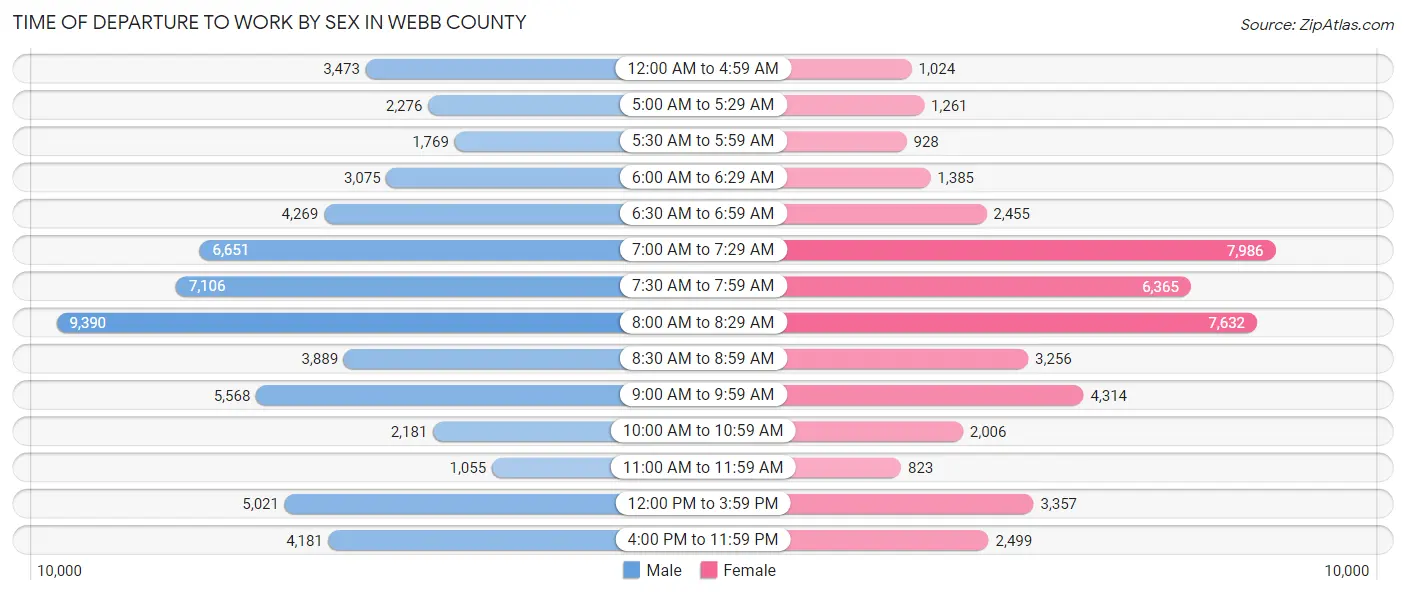
| Time of Departure | Male | Female |
| 12:00 AM to 4:59 AM | 3,473 (5.8%) | 1,024 (2.3%) |
| 5:00 AM to 5:29 AM | 2,276 (3.8%) | 1,261 (2.8%) |
| 5:30 AM to 5:59 AM | 1,769 (2.9%) | 928 (2.1%) |
| 6:00 AM to 6:29 AM | 3,075 (5.1%) | 1,385 (3.1%) |
| 6:30 AM to 6:59 AM | 4,269 (7.1%) | 2,455 (5.4%) |
| 7:00 AM to 7:29 AM | 6,651 (11.1%) | 7,986 (17.6%) |
| 7:30 AM to 7:59 AM | 7,106 (11.9%) | 6,365 (14.1%) |
| 8:00 AM to 8:29 AM | 9,390 (15.7%) | 7,632 (16.9%) |
| 8:30 AM to 8:59 AM | 3,889 (6.5%) | 3,256 (7.2%) |
| 9:00 AM to 9:59 AM | 5,568 (9.3%) | 4,314 (9.5%) |
| 10:00 AM to 10:59 AM | 2,181 (3.6%) | 2,006 (4.4%) |
| 11:00 AM to 11:59 AM | 1,055 (1.8%) | 823 (1.8%) |
| 12:00 PM to 3:59 PM | 5,021 (8.4%) | 3,357 (7.4%) |
| 4:00 PM to 11:59 PM | 4,181 (7.0%) | 2,499 (5.5%) |
| Total | 59,904 (100.0%) | 45,291 (100.0%) |
Housing Occupancy in Webb County
Occupancy by Ownership in Webb County
Of the total 77,797 dwellings in Webb County, owner-occupied units account for 49,227 (63.3%), while renter-occupied units make up 28,570 (36.7%).
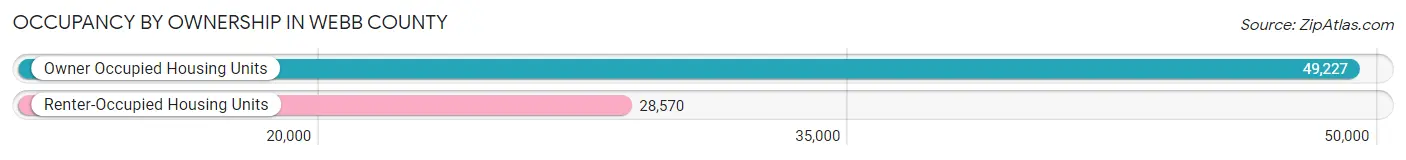
| Occupancy | # Housing Units | % Housing Units |
| Owner Occupied Housing Units | 49,227 | 63.3% |
| Renter-Occupied Housing Units | 28,570 | 36.7% |
| Total Occupied Housing Units | 77,797 | 100.0% |
Occupancy by Household Size in Webb County
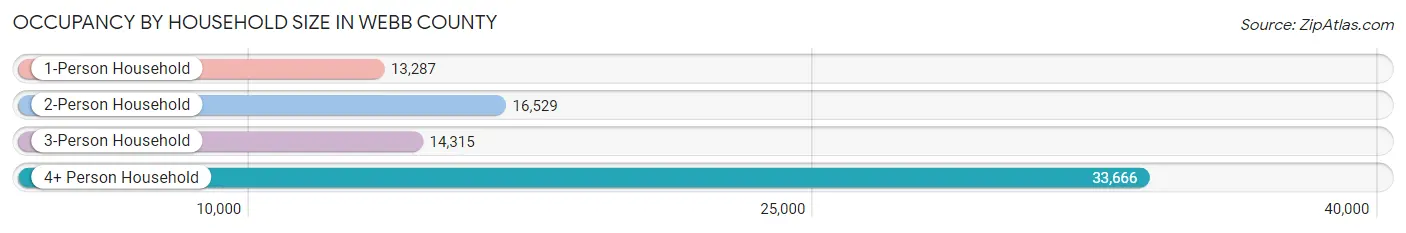
| Household Size | # Housing Units | % Housing Units |
| 1-Person Household | 13,287 | 17.1% |
| 2-Person Household | 16,529 | 21.2% |
| 3-Person Household | 14,315 | 18.4% |
| 4+ Person Household | 33,666 | 43.3% |
| Total Housing Units | 77,797 | 100.0% |
Occupancy by Ownership by Household Size in Webb County
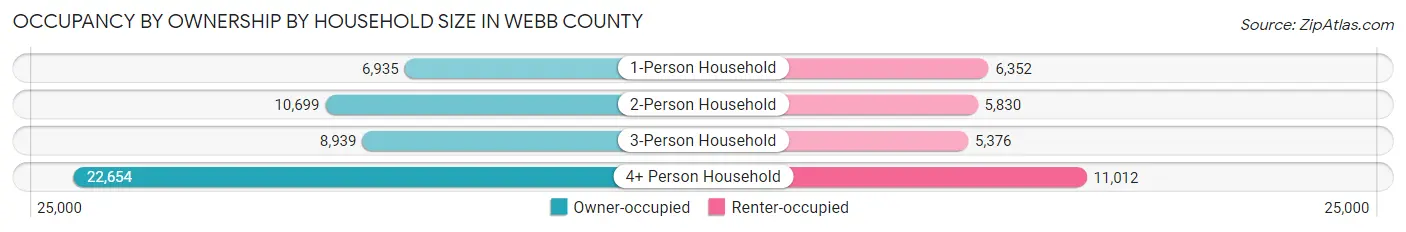
| Household Size | Owner-occupied | Renter-occupied |
| 1-Person Household | 6,935 (52.2%) | 6,352 (47.8%) |
| 2-Person Household | 10,699 (64.7%) | 5,830 (35.3%) |
| 3-Person Household | 8,939 (62.4%) | 5,376 (37.6%) |
| 4+ Person Household | 22,654 (67.3%) | 11,012 (32.7%) |
| Total Housing Units | 49,227 (63.3%) | 28,570 (36.7%) |
Occupancy by Educational Attainment in Webb County
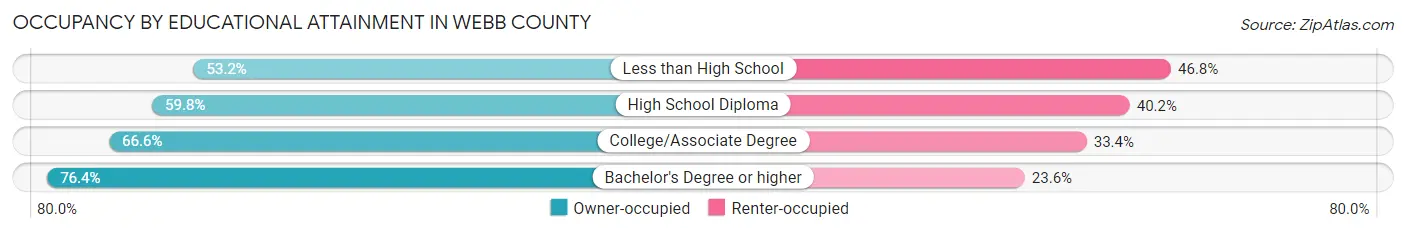
| Household Size | Owner-occupied | Renter-occupied |
| Less than High School | 12,497 (53.2%) | 10,986 (46.8%) |
| High School Diploma | 9,657 (59.8%) | 6,500 (40.2%) |
| College/Associate Degree | 14,131 (66.6%) | 7,089 (33.4%) |
| Bachelor's Degree or higher | 12,942 (76.4%) | 3,995 (23.6%) |
Occupancy by Age of Householder in Webb County
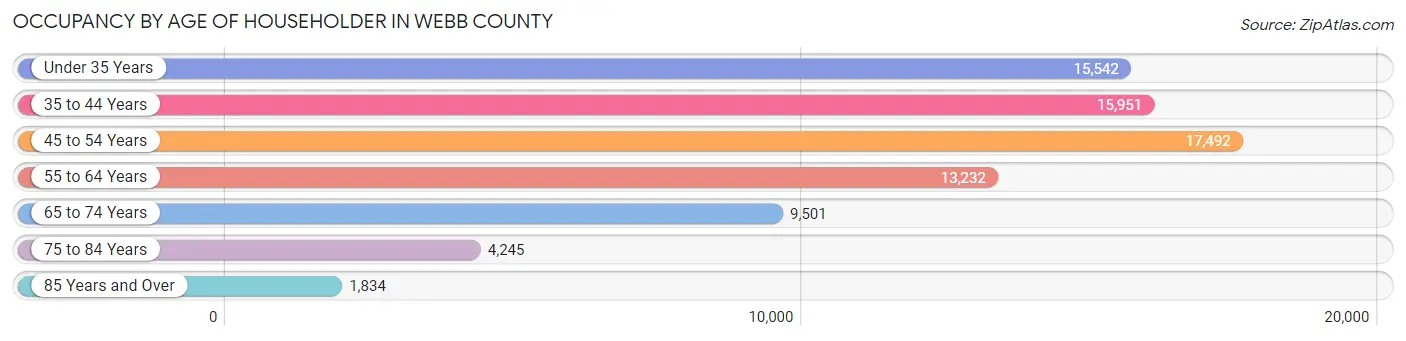
| Age Bracket | # Households | % Households |
| Under 35 Years | 15,542 | 20.0% |
| 35 to 44 Years | 15,951 | 20.5% |
| 45 to 54 Years | 17,492 | 22.5% |
| 55 to 64 Years | 13,232 | 17.0% |
| 65 to 74 Years | 9,501 | 12.2% |
| 75 to 84 Years | 4,245 | 5.5% |
| 85 Years and Over | 1,834 | 2.4% |
| Total | 77,797 | 100.0% |
Housing Finances in Webb County
Median Income by Occupancy in Webb County
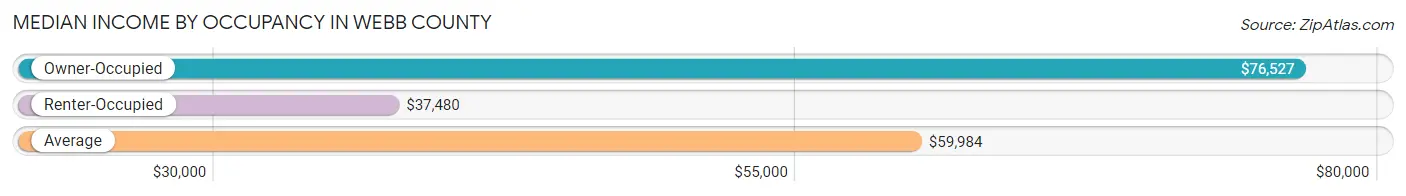
| Occupancy Type | # Households | Median Income |
| Owner-Occupied | 49,227 (63.3%) | $76,527 |
| Renter-Occupied | 28,570 (36.7%) | $37,480 |
| Average | 77,797 (100.0%) | $59,984 |
Occupancy by Householder Income Bracket in Webb County
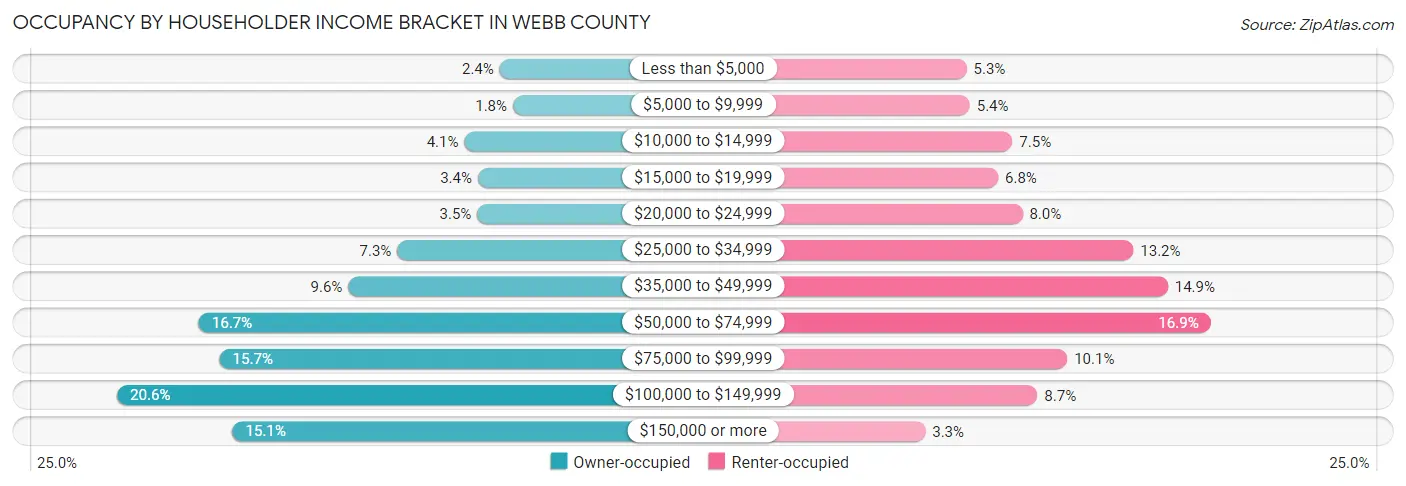
| Income Bracket | Owner-occupied | Renter-occupied |
| Less than $5,000 | 1,170 (2.4%) | 1,512 (5.3%) |
| $5,000 to $9,999 | 860 (1.8%) | 1,553 (5.4%) |
| $10,000 to $14,999 | 1,998 (4.1%) | 2,135 (7.5%) |
| $15,000 to $19,999 | 1,685 (3.4%) | 1,941 (6.8%) |
| $20,000 to $24,999 | 1,698 (3.5%) | 2,271 (8.0%) |
| $25,000 to $34,999 | 3,575 (7.3%) | 3,780 (13.2%) |
| $35,000 to $49,999 | 4,722 (9.6%) | 4,248 (14.9%) |
| $50,000 to $74,999 | 8,221 (16.7%) | 4,827 (16.9%) |
| $75,000 to $99,999 | 7,733 (15.7%) | 2,881 (10.1%) |
| $100,000 to $149,999 | 10,134 (20.6%) | 2,473 (8.7%) |
| $150,000 or more | 7,431 (15.1%) | 949 (3.3%) |
| Total | 49,227 (100.0%) | 28,570 (100.0%) |
Monthly Housing Cost Tiers in Webb County
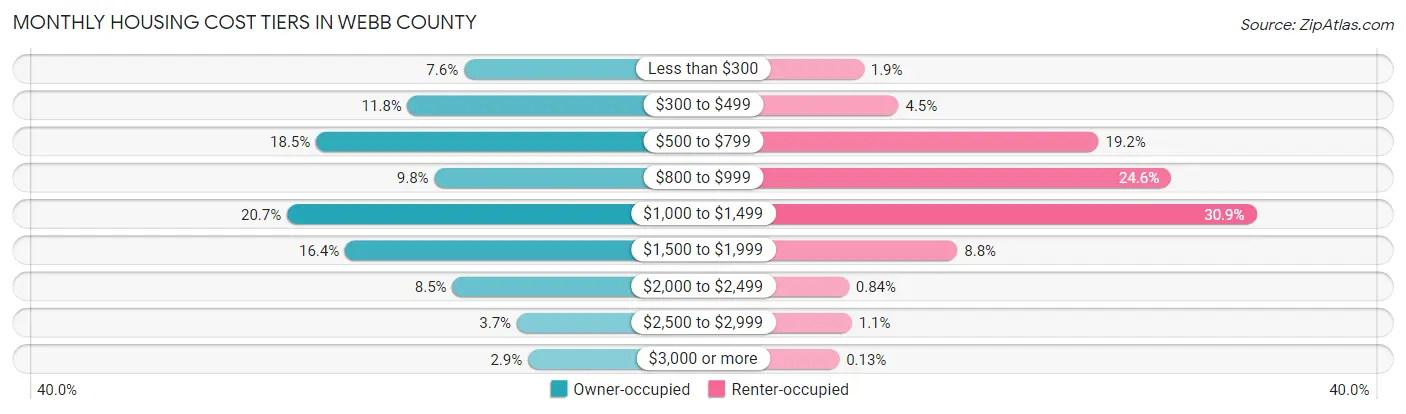
| Monthly Cost | Owner-occupied | Renter-occupied |
| Less than $300 | 3,762 (7.6%) | 555 (1.9%) |
| $300 to $499 | 5,803 (11.8%) | 1,287 (4.5%) |
| $500 to $799 | 9,124 (18.5%) | 5,494 (19.2%) |
| $800 to $999 | 4,833 (9.8%) | 7,019 (24.6%) |
| $1,000 to $1,499 | 10,176 (20.7%) | 8,815 (30.8%) |
| $1,500 to $1,999 | 8,075 (16.4%) | 2,524 (8.8%) |
| $2,000 to $2,499 | 4,177 (8.5%) | 240 (0.8%) |
| $2,500 to $2,999 | 1,840 (3.7%) | 302 (1.1%) |
| $3,000 or more | 1,437 (2.9%) | 38 (0.1%) |
| Total | 49,227 (100.0%) | 28,570 (100.0%) |
Physical Housing Characteristics in Webb County
Housing Structures in Webb County
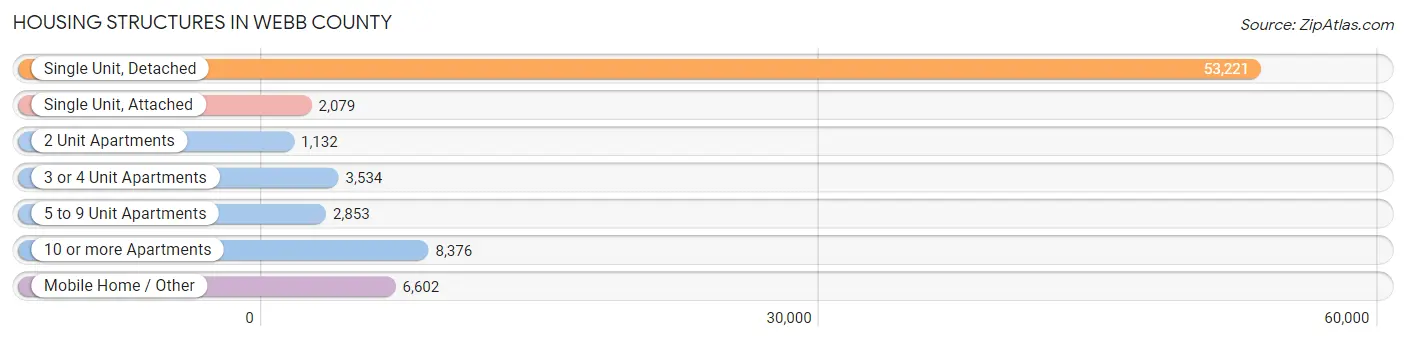
| Structure Type | # Housing Units | % Housing Units |
| Single Unit, Detached | 53,221 | 68.4% |
| Single Unit, Attached | 2,079 | 2.7% |
| 2 Unit Apartments | 1,132 | 1.5% |
| 3 or 4 Unit Apartments | 3,534 | 4.5% |
| 5 to 9 Unit Apartments | 2,853 | 3.7% |
| 10 or more Apartments | 8,376 | 10.8% |
| Mobile Home / Other | 6,602 | 8.5% |
| Total | 77,797 | 100.0% |
Housing Structures by Occupancy in Webb County
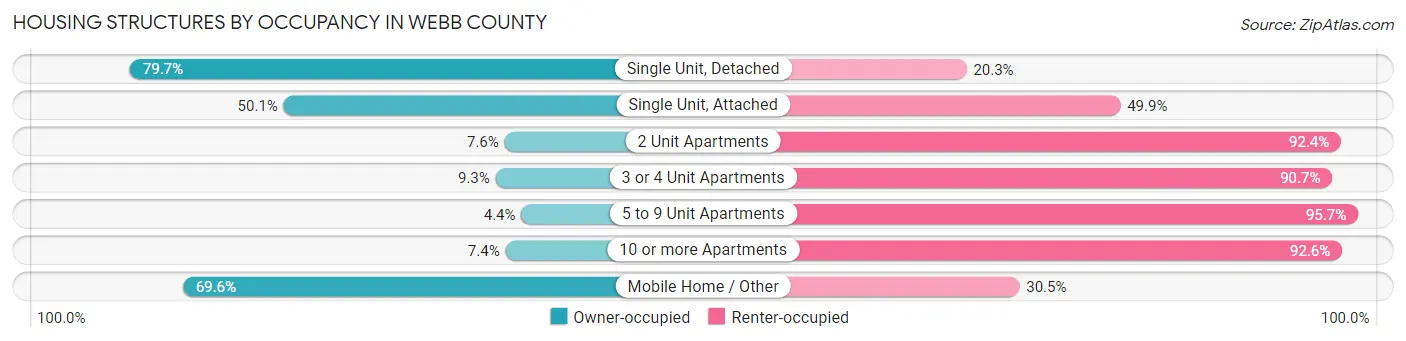
| Structure Type | Owner-occupied | Renter-occupied |
| Single Unit, Detached | 42,433 (79.7%) | 10,788 (20.3%) |
| Single Unit, Attached | 1,042 (50.1%) | 1,037 (49.9%) |
| 2 Unit Apartments | 86 (7.6%) | 1,046 (92.4%) |
| 3 or 4 Unit Apartments | 329 (9.3%) | 3,205 (90.7%) |
| 5 to 9 Unit Apartments | 124 (4.3%) | 2,729 (95.7%) |
| 10 or more Apartments | 621 (7.4%) | 7,755 (92.6%) |
| Mobile Home / Other | 4,592 (69.6%) | 2,010 (30.4%) |
| Total | 49,227 (63.3%) | 28,570 (36.7%) |
Housing Structures by Number of Rooms in Webb County
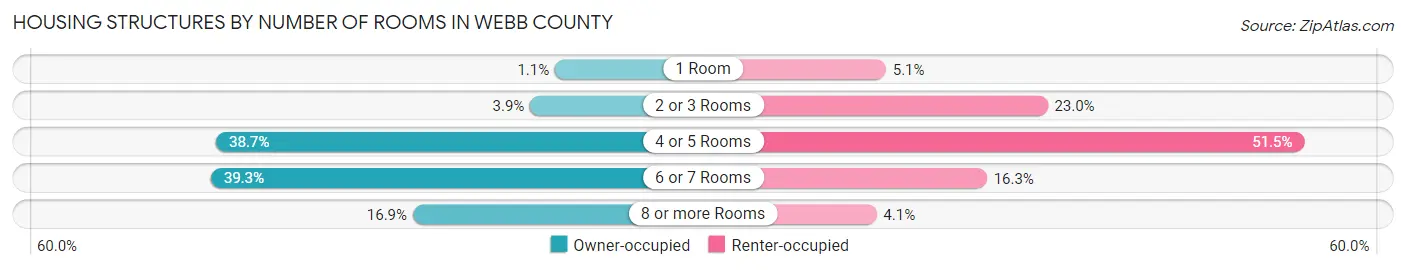
| Number of Rooms | Owner-occupied | Renter-occupied |
| 1 Room | 556 (1.1%) | 1,454 (5.1%) |
| 2 or 3 Rooms | 1,915 (3.9%) | 6,581 (23.0%) |
| 4 or 5 Rooms | 19,073 (38.7%) | 14,723 (51.5%) |
| 6 or 7 Rooms | 19,360 (39.3%) | 4,654 (16.3%) |
| 8 or more Rooms | 8,323 (16.9%) | 1,158 (4.1%) |
| Total | 49,227 (100.0%) | 28,570 (100.0%) |
Housing Structure by Heating Type in Webb County
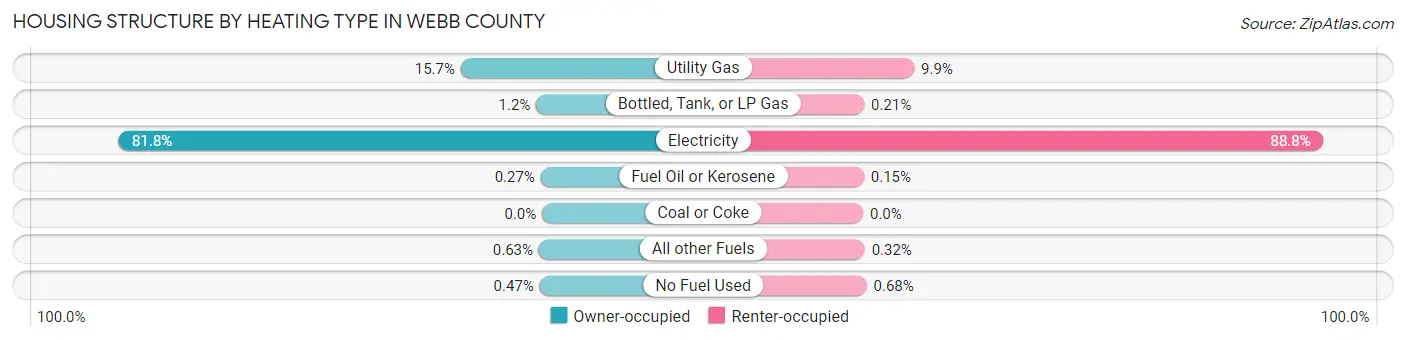
| Heating Type | Owner-occupied | Renter-occupied |
| Utility Gas | 7,736 (15.7%) | 2,817 (9.9%) |
| Bottled, Tank, or LP Gas | 568 (1.1%) | 61 (0.2%) |
| Electricity | 40,251 (81.8%) | 25,366 (88.8%) |
| Fuel Oil or Kerosene | 131 (0.3%) | 43 (0.2%) |
| Coal or Coke | 0 (0.0%) | 0 (0.0%) |
| All other Fuels | 312 (0.6%) | 90 (0.3%) |
| No Fuel Used | 229 (0.5%) | 193 (0.7%) |
| Total | 49,227 (100.0%) | 28,570 (100.0%) |
Household Vehicle Usage in Webb County
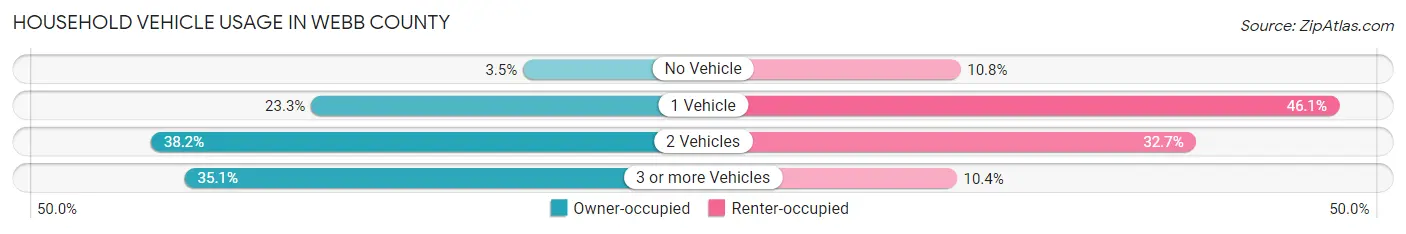
| Vehicles per Household | Owner-occupied | Renter-occupied |
| No Vehicle | 1,709 (3.5%) | 3,076 (10.8%) |
| 1 Vehicle | 11,447 (23.3%) | 13,171 (46.1%) |
| 2 Vehicles | 18,812 (38.2%) | 9,347 (32.7%) |
| 3 or more Vehicles | 17,259 (35.1%) | 2,976 (10.4%) |
| Total | 49,227 (100.0%) | 28,570 (100.0%) |
Real Estate & Mortgages in Webb County
Real Estate and Mortgage Overview in Webb County
| Characteristic | Without Mortgage | With Mortgage |
| Housing Units | 22,822 | 26,405 |
| Median Property Value | $131,200 | $182,800 |
| Median Household Income | $61,568 | $4,690 |
| Monthly Housing Costs | $560 | $1,398 |
| Real Estate Taxes | $2,448 | $635 |
Property Value by Mortgage Status in Webb County
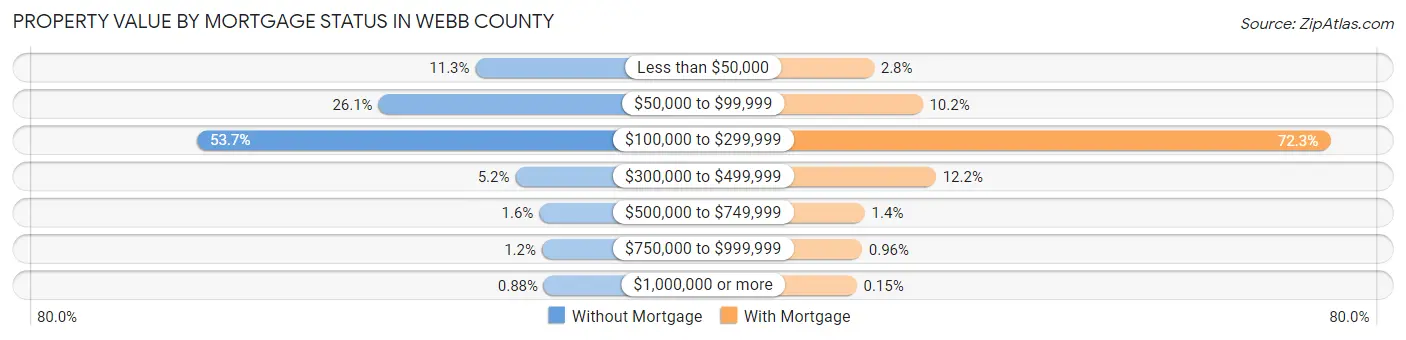
| Property Value | Without Mortgage | With Mortgage |
| Less than $50,000 | 2,582 (11.3%) | 733 (2.8%) |
| $50,000 to $99,999 | 5,951 (26.1%) | 2,694 (10.2%) |
| $100,000 to $299,999 | 12,261 (53.7%) | 19,091 (72.3%) |
| $300,000 to $499,999 | 1,194 (5.2%) | 3,228 (12.2%) |
| $500,000 to $749,999 | 362 (1.6%) | 367 (1.4%) |
| $750,000 to $999,999 | 272 (1.2%) | 253 (1.0%) |
| $1,000,000 or more | 200 (0.9%) | 39 (0.2%) |
| Total | 22,822 (100.0%) | 26,405 (100.0%) |
Household Income by Mortgage Status in Webb County
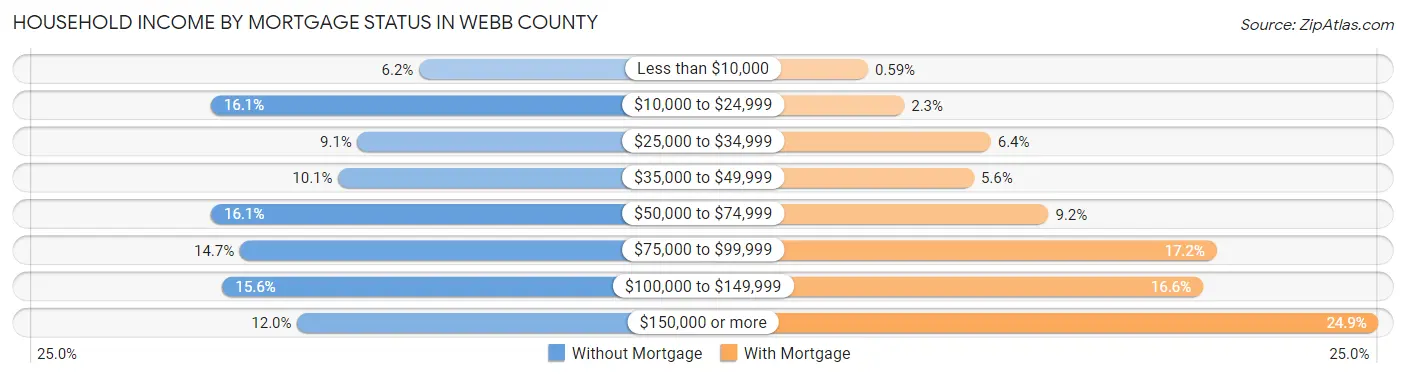
| Household Income | Without Mortgage | With Mortgage |
| Less than $10,000 | 1,417 (6.2%) | 157 (0.6%) |
| $10,000 to $24,999 | 3,681 (16.1%) | 613 (2.3%) |
| $25,000 to $34,999 | 2,087 (9.1%) | 1,700 (6.4%) |
| $35,000 to $49,999 | 2,296 (10.1%) | 1,488 (5.6%) |
| $50,000 to $74,999 | 3,680 (16.1%) | 2,426 (9.2%) |
| $75,000 to $99,999 | 3,364 (14.7%) | 4,541 (17.2%) |
| $100,000 to $149,999 | 3,556 (15.6%) | 4,369 (16.6%) |
| $150,000 or more | 2,741 (12.0%) | 6,578 (24.9%) |
| Total | 22,822 (100.0%) | 26,405 (100.0%) |
Property Value to Household Income Ratio in Webb County
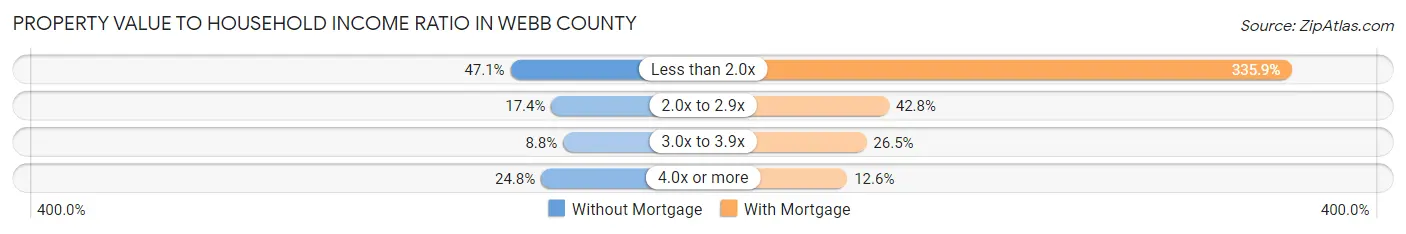
| Value-to-Income Ratio | Without Mortgage | With Mortgage |
| Less than 2.0x | 10,738 (47.0%) | 88,696 (335.9%) |
| 2.0x to 2.9x | 3,970 (17.4%) | 11,292 (42.8%) |
| 3.0x to 3.9x | 2,018 (8.8%) | 6,995 (26.5%) |
| 4.0x or more | 5,667 (24.8%) | 3,316 (12.6%) |
| Total | 22,822 (100.0%) | 26,405 (100.0%) |
Real Estate Taxes by Mortgage Status in Webb County
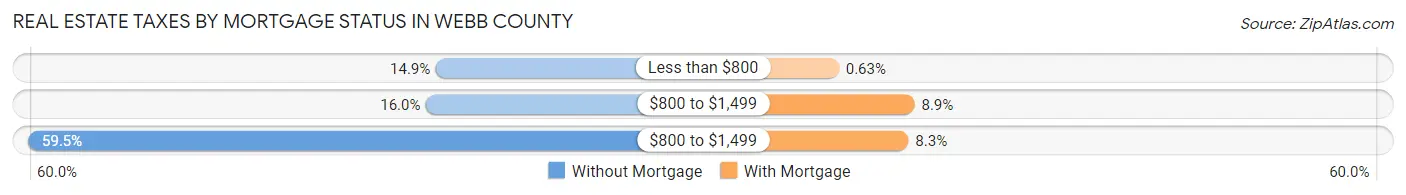
| Property Taxes | Without Mortgage | With Mortgage |
| Less than $800 | 3,401 (14.9%) | 167 (0.6%) |
| $800 to $1,499 | 3,646 (16.0%) | 2,358 (8.9%) |
| $800 to $1,499 | 13,586 (59.5%) | 2,182 (8.3%) |
| Total | 22,822 (100.0%) | 26,405 (100.0%) |
Health & Disability in Webb County
Health Insurance Coverage by Age in Webb County
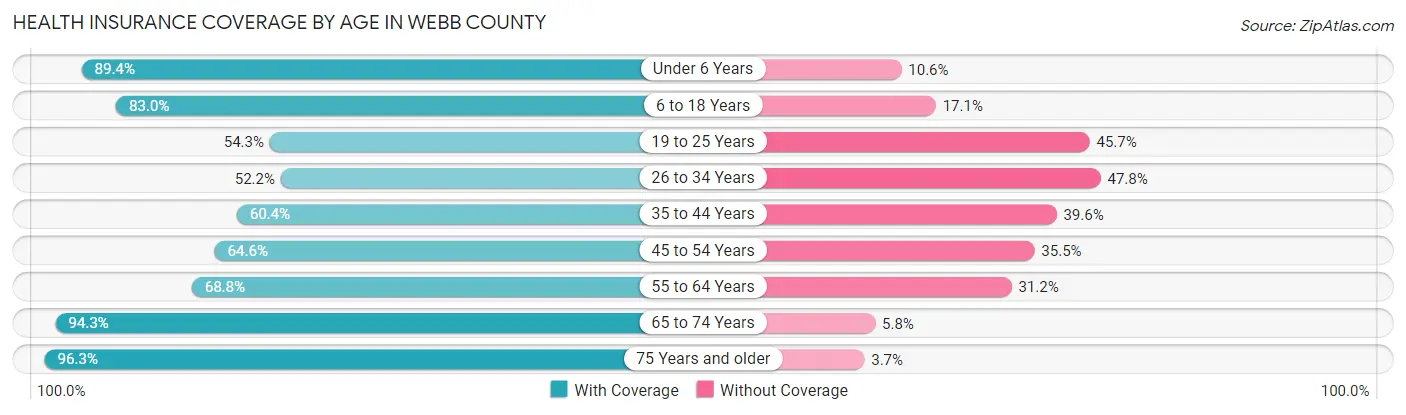
| Age Bracket | With Coverage | Without Coverage |
| Under 6 Years | 23,990 (89.4%) | 2,857 (10.6%) |
| 6 to 18 Years | 52,344 (83.0%) | 10,761 (17.1%) |
| 19 to 25 Years | 16,697 (54.3%) | 14,068 (45.7%) |
| 26 to 34 Years | 16,410 (52.2%) | 15,016 (47.8%) |
| 35 to 44 Years | 20,097 (60.4%) | 13,157 (39.6%) |
| 45 to 54 Years | 20,059 (64.5%) | 11,018 (35.4%) |
| 55 to 64 Years | 16,105 (68.8%) | 7,300 (31.2%) |
| 65 to 74 Years | 14,320 (94.3%) | 873 (5.8%) |
| 75 Years and older | 9,983 (96.3%) | 387 (3.7%) |
| Total | 190,005 (71.6%) | 75,437 (28.4%) |
Health Insurance Coverage by Citizenship Status in Webb County
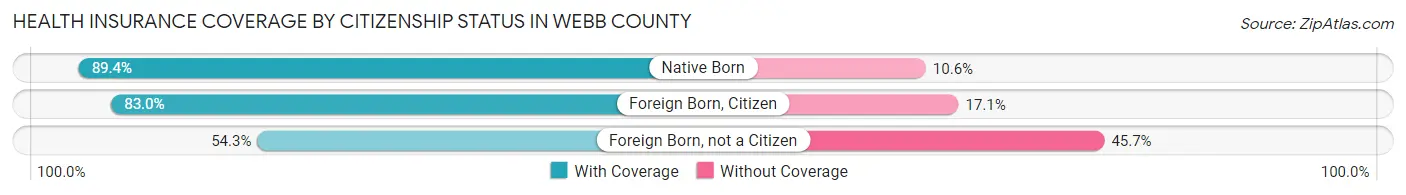
| Citizenship Status | With Coverage | Without Coverage |
| Native Born | 23,990 (89.4%) | 2,857 (10.6%) |
| Foreign Born, Citizen | 52,344 (83.0%) | 10,761 (17.1%) |
| Foreign Born, not a Citizen | 16,697 (54.3%) | 14,068 (45.7%) |
Health Insurance Coverage by Household Income in Webb County
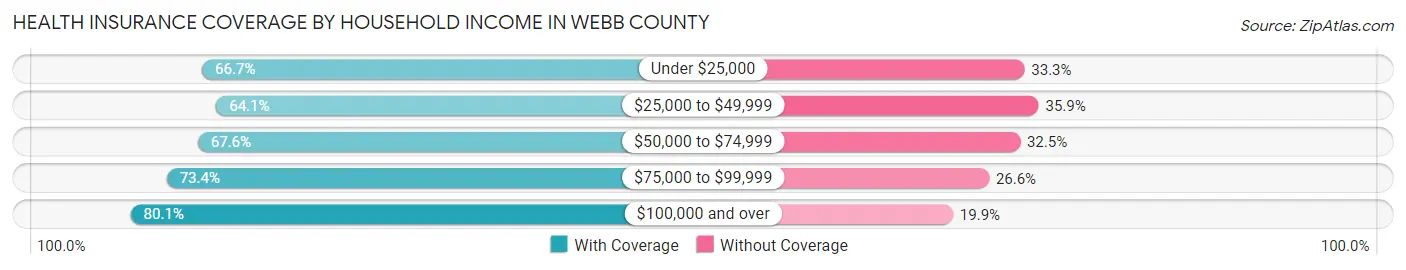
| Household Income | With Coverage | Without Coverage |
| Under $25,000 | 27,697 (66.7%) | 13,810 (33.3%) |
| $25,000 to $49,999 | 33,338 (64.1%) | 18,685 (35.9%) |
| $50,000 to $74,999 | 31,220 (67.5%) | 14,995 (32.5%) |
| $75,000 to $99,999 | 30,388 (73.4%) | 11,029 (26.6%) |
| $100,000 and over | 66,512 (80.1%) | 16,507 (19.9%) |
Public vs Private Health Insurance Coverage by Age in Webb County
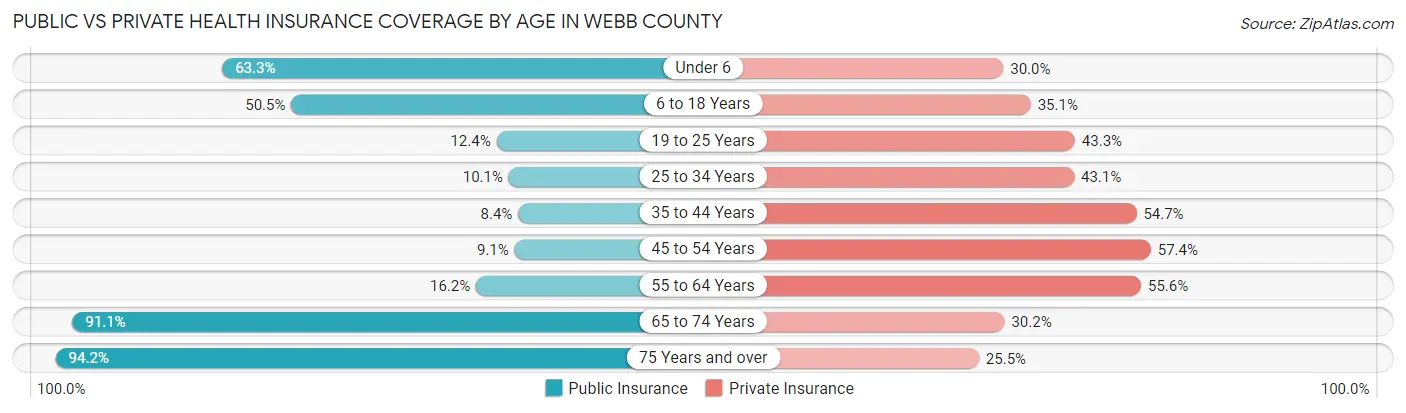
| Age Bracket | Public Insurance | Private Insurance |
| Under 6 | 16,998 (63.3%) | 8,050 (30.0%) |
| 6 to 18 Years | 31,859 (50.5%) | 22,132 (35.1%) |
| 19 to 25 Years | 3,819 (12.4%) | 13,312 (43.3%) |
| 25 to 34 Years | 3,185 (10.1%) | 13,547 (43.1%) |
| 35 to 44 Years | 2,787 (8.4%) | 18,186 (54.7%) |
| 45 to 54 Years | 2,811 (9.0%) | 17,826 (57.4%) |
| 55 to 64 Years | 3,792 (16.2%) | 13,002 (55.5%) |
| 65 to 74 Years | 13,844 (91.1%) | 4,588 (30.2%) |
| 75 Years and over | 9,772 (94.2%) | 2,639 (25.5%) |
| Total | 88,867 (33.5%) | 113,282 (42.7%) |
Disability Status by Sex by Age in Webb County
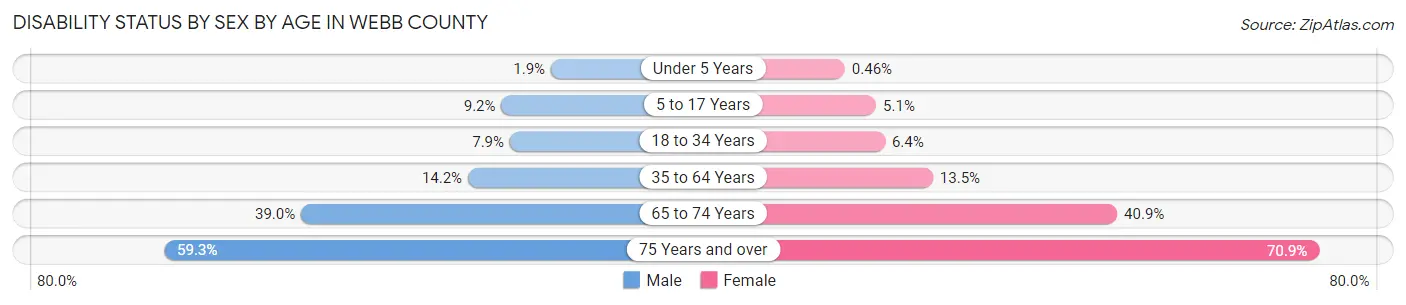
| Age Bracket | Male | Female |
| Under 5 Years | 213 (1.8%) | 51 (0.5%) |
| 5 to 17 Years | 2,909 (9.2%) | 1,573 (5.1%) |
| 18 to 34 Years | 2,709 (7.9%) | 2,112 (6.4%) |
| 35 to 64 Years | 6,076 (14.2%) | 6,070 (13.5%) |
| 65 to 74 Years | 2,695 (39.0%) | 3,383 (40.9%) |
| 75 Years and over | 2,396 (59.3%) | 4,485 (70.9%) |
Disability Class by Sex by Age in Webb County
Disability Class: Hearing Difficulty
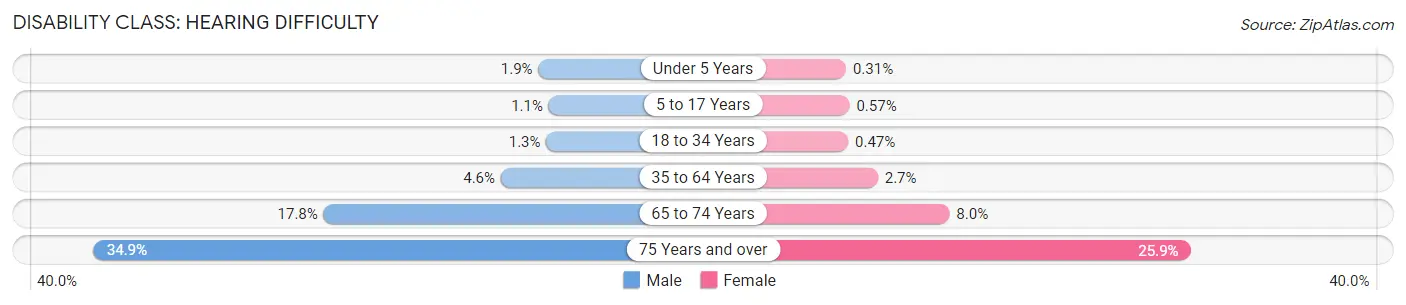
| Age Bracket | Male | Female |
| Under 5 Years | 213 (1.8%) | 34 (0.3%) |
| 5 to 17 Years | 341 (1.1%) | 176 (0.6%) |
| 18 to 34 Years | 430 (1.3%) | 154 (0.5%) |
| 35 to 64 Years | 1,990 (4.6%) | 1,197 (2.7%) |
| 65 to 74 Years | 1,232 (17.8%) | 661 (8.0%) |
| 75 Years and over | 1,409 (34.9%) | 1,638 (25.9%) |
Disability Class: Vision Difficulty
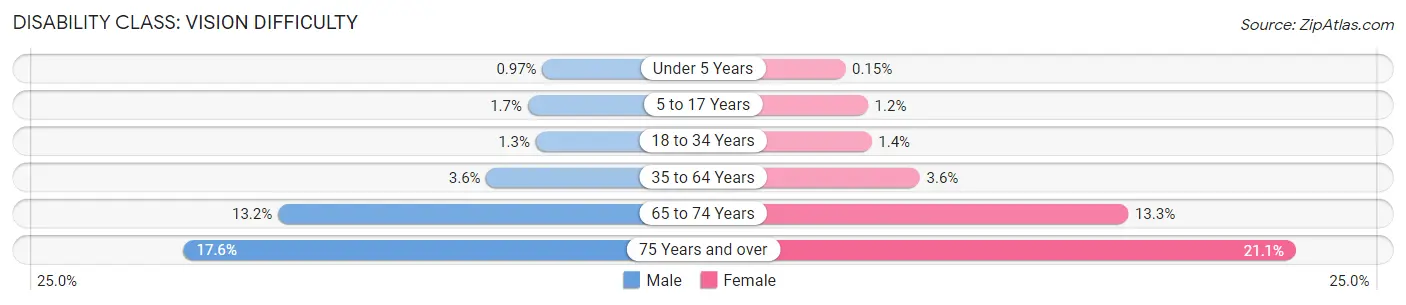
| Age Bracket | Male | Female |
| Under 5 Years | 112 (1.0%) | 17 (0.2%) |
| 5 to 17 Years | 522 (1.7%) | 370 (1.2%) |
| 18 to 34 Years | 436 (1.3%) | 452 (1.4%) |
| 35 to 64 Years | 1,532 (3.6%) | 1,620 (3.6%) |
| 65 to 74 Years | 916 (13.2%) | 1,099 (13.3%) |
| 75 Years and over | 712 (17.6%) | 1,333 (21.1%) |
Disability Class: Cognitive Difficulty
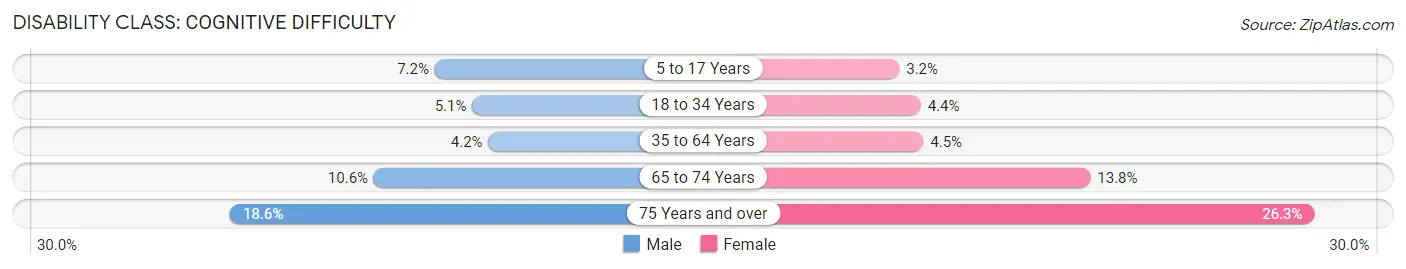
| Age Bracket | Male | Female |
| 5 to 17 Years | 2,263 (7.2%) | 987 (3.2%) |
| 18 to 34 Years | 1,729 (5.1%) | 1,450 (4.4%) |
| 35 to 64 Years | 1,788 (4.2%) | 2,037 (4.5%) |
| 65 to 74 Years | 730 (10.5%) | 1,145 (13.8%) |
| 75 Years and over | 750 (18.6%) | 1,665 (26.3%) |
Disability Class: Ambulatory Difficulty
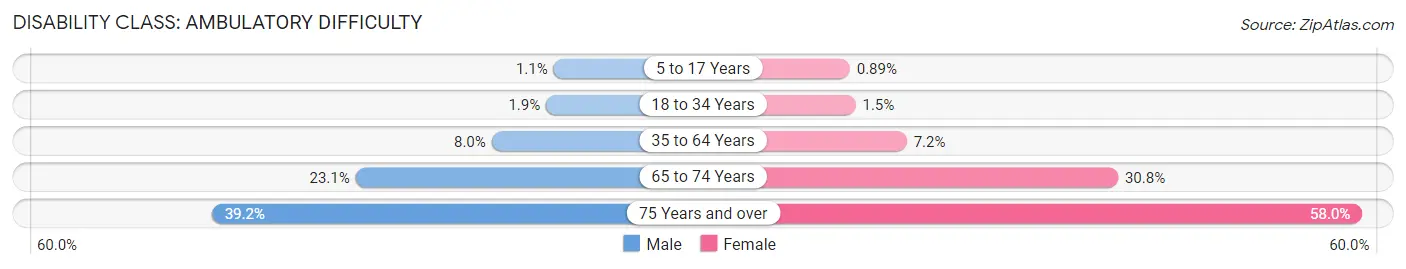
| Age Bracket | Male | Female |
| 5 to 17 Years | 344 (1.1%) | 273 (0.9%) |
| 18 to 34 Years | 660 (1.9%) | 505 (1.5%) |
| 35 to 64 Years | 3,426 (8.0%) | 3,245 (7.2%) |
| 65 to 74 Years | 1,601 (23.1%) | 2,545 (30.8%) |
| 75 Years and over | 1,583 (39.2%) | 3,667 (58.0%) |
Disability Class: Self-Care Difficulty
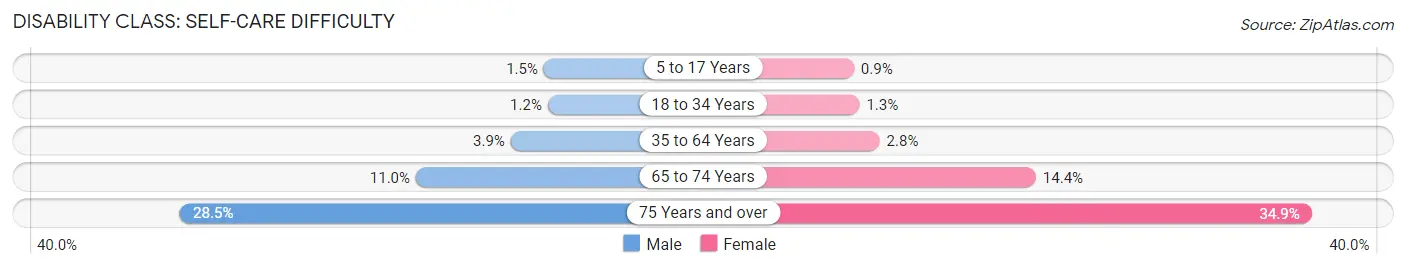
| Age Bracket | Male | Female |
| 5 to 17 Years | 458 (1.5%) | 278 (0.9%) |
| 18 to 34 Years | 397 (1.2%) | 430 (1.3%) |
| 35 to 64 Years | 1,678 (3.9%) | 1,260 (2.8%) |
| 65 to 74 Years | 758 (11.0%) | 1,192 (14.4%) |
| 75 Years and over | 1,150 (28.4%) | 2,207 (34.9%) |
Technology Access in Webb County
Computing Device Access in Webb County
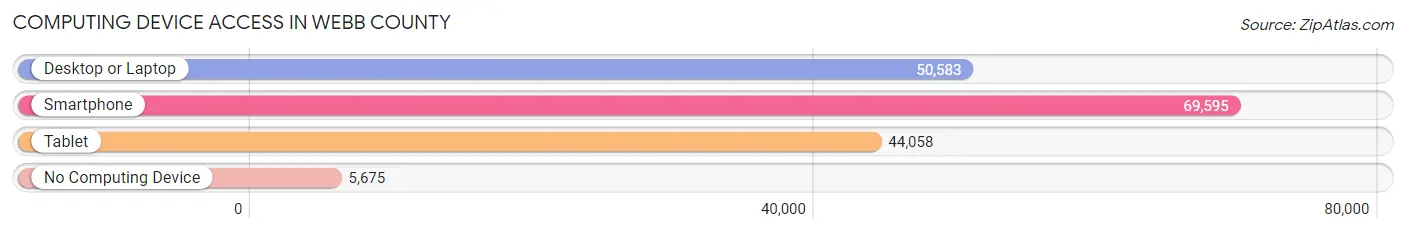
| Device Type | # Households | % Households |
| Desktop or Laptop | 50,583 | 65.0% |
| Smartphone | 69,595 | 89.5% |
| Tablet | 44,058 | 56.6% |
| No Computing Device | 5,675 | 7.3% |
| Total | 77,797 | 100.0% |
Internet Access in Webb County
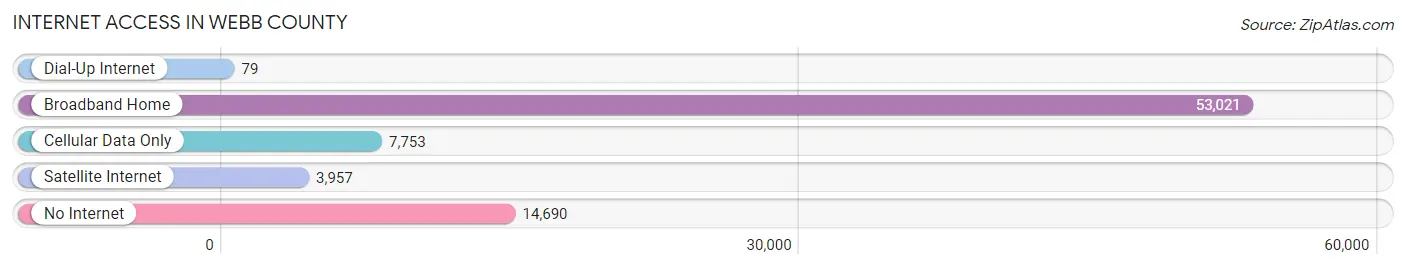
| Internet Type | # Households | % Households |
| Dial-Up Internet | 79 | 0.1% |
| Broadband Home | 53,021 | 68.1% |
| Cellular Data Only | 7,753 | 10.0% |
| Satellite Internet | 3,957 | 5.1% |
| No Internet | 14,690 | 18.9% |
| Total | 77,797 | 100.0% |
Webb County Summary
Webb County is located in the southern part of Texas, along the Rio Grande River. It is bordered by Zapata County to the south, Jim Hogg County to the east, La Salle County to the north, and Maverick County to the west. The county seat is Laredo, which is the largest city in the county. Webb County was established in 1848 and is named after James Webb, who was the Secretary of the Treasury under President John Tyler.
Webb County has a total area of 3,376 square miles, making it the sixth largest county in Texas. The terrain is mostly flat with some rolling hills in the northern part of the county. The Rio Grande River forms the southern border of the county. The climate is semi-arid with hot summers and mild winters.
The population of Webb County was 250,304 in 2000, making it the fourth most populous county in Texas. The population is predominantly Hispanic, with over 90% of the population identifying as Hispanic or Latino. The median household income in 2000 was $27,845, and the median home value was $64,400.
The economy of Webb County is largely based on trade and transportation. The Port of Laredo is the largest inland port in the United States and is a major hub for international trade. The Laredo International Airport is also a major transportation hub for the region. Other major industries in the county include manufacturing, retail, and tourism.
Webb County is home to several educational institutions, including Texas A&M International University, Laredo Community College, and the University of Texas at Austin-Laredo. The county is also home to several museums, including the Laredo Center for the Arts, the Laredo Children’s Museum, and the Laredo Historical Museum.
Webb County is a vibrant and diverse community with a rich history and culture. It is home to a variety of attractions, including the San Agustin Historical District, the Laredo Zoo, and the Laredo Center for the Arts. The county is also home to a number of parks and recreational areas, including Lake Casa Blanca International State Park and the Laredo Community College Nature Trail.
Webb County is a great place to live, work, and play. It is a vibrant and diverse community with a rich history and culture. It is home to a variety of attractions, educational institutions, and businesses. The county is also home to a number of parks and recreational areas, making it a great place to enjoy the outdoors.
Common Questions
What is Per Capita Income in Webb County?
Per Capita income in Webb County is $23,446.
What is the Median Family Income in Webb County?
Median Family Income in Webb County is $65,891.
What is the Median Household income in Webb County?
Median Household Income in Webb County is $59,984.
What is Income or Wage Gap in Webb County?
Income or Wage Gap in Webb County is 39.2%.
Women in Webb County earn 60.8 cents for every dollar earned by a man.
What is Family Income Deficit in Webb County?
Family Income Deficit in Webb County is $11,446.
Families that are below poverty line in Webb County earn $11,446 less on average than the poverty threshold level.
What is Inequality or Gini Index in Webb County?
Inequality or Gini Index in Webb County is 0.46.
What is the Total Population of Webb County?
Total Population of Webb County is 267,282.
What is the Total Male Population of Webb County?
Total Male Population of Webb County is 132,495.
What is the Total Female Population of Webb County?
Total Female Population of Webb County is 134,787.
What is the Ratio of Males per 100 Females in Webb County?
There are 98.30 Males per 100 Females in Webb County.
What is the Ratio of Females per 100 Males in Webb County?
There are 101.73 Females per 100 Males in Webb County.
What is the Median Population Age in Webb County?
Median Population Age in Webb County is 29.4 Years.
What is the Average Family Size in Webb County
Average Family Size in Webb County is 3.9 People.
What is the Average Household Size in Webb County
Average Household Size in Webb County is 3.4 People.
How Large is the Labor Force in Webb County?
There are 118,730 People in the Labor Forcein in Webb County.
What is the Percentage of People in the Labor Force in Webb County?
62.0% of People are in the Labor Force in Webb County.
What is the Unemployment Rate in Webb County?
Unemployment Rate in Webb County is 5.9%.