Union County, OR Map & Demographics
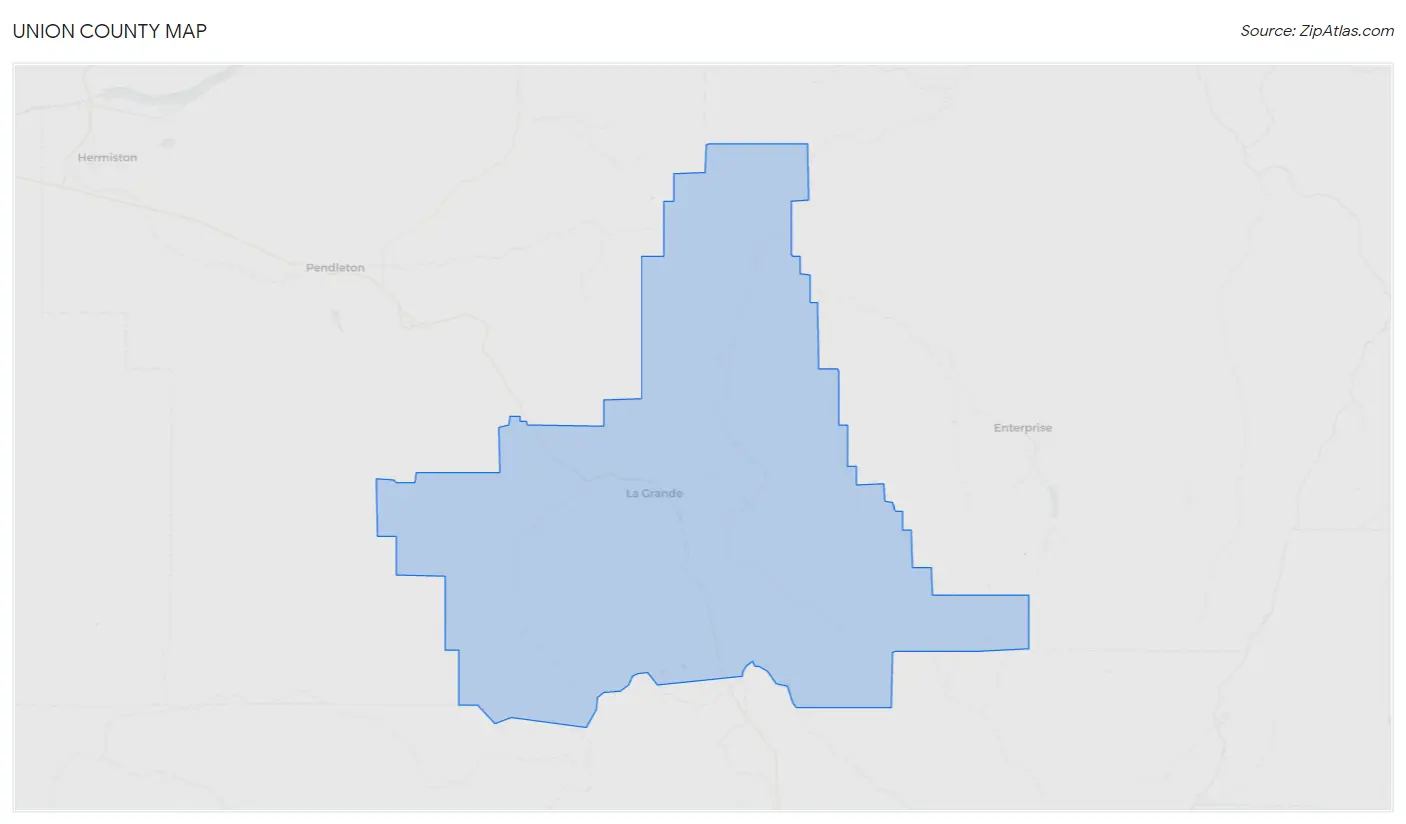
Union County Map
Union County Overview
$31,640
PER CAPITA INCOME
$73,561
AVG FAMILY INCOME
$61,946
AVG HOUSEHOLD INCOME
42.0%
WAGE / INCOME GAP [ % ]
58.0¢/ $1
WAGE / INCOME GAP [ $ ]
$7,832
FAMILY INCOME DEFICIT
0.43
INEQUALITY / GINI INDEX
26,286
TOTAL POPULATION
13,176
MALE POPULATION
13,110
FEMALE POPULATION
100.50
MALES / 100 FEMALES
99.50
FEMALES / 100 MALES
39.7
MEDIAN AGE
2.9
AVG FAMILY SIZE
2.4
AVG HOUSEHOLD SIZE
12,327
LABOR FORCE [ PEOPLE ]
58.2%
PERCENT IN LABOR FORCE
6.3%
UNEMPLOYMENT RATE
Union County Area Codes
Income in Union County
Income Overview in Union County
Per Capita Income in Union County is $31,640, while median incomes of families and households are $73,561 and $61,946 respectively.
| Characteristic | Number | Measure |
| Per Capita Income | 26,286 | $31,640 |
| Median Family Income | 6,884 | $73,561 |
| Mean Family Income | 6,884 | $90,691 |
| Median Household Income | 10,700 | $61,946 |
| Mean Household Income | 10,700 | $77,054 |
| Income Deficit | 6,884 | $7,832 |
| Wage / Income Gap (%) | 26,286 | 42.03% |
| Wage / Income Gap ($) | 26,286 | 57.97¢ per $1 |
| Gini / Inequality Index | 26,286 | 0.43 |
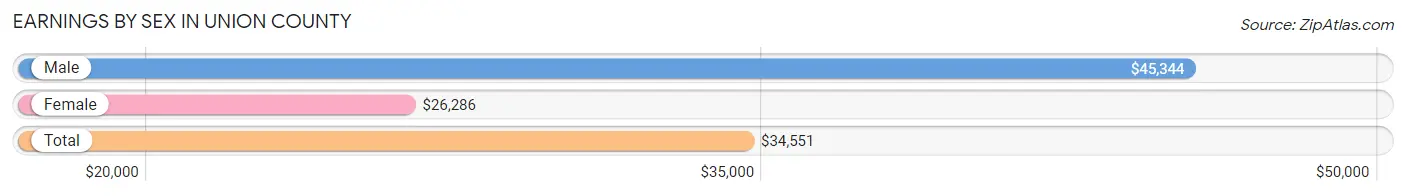
Earnings by Sex in Union County
Average Earnings in Union County are $34,551, $45,344 for men and $26,286 for women, a difference of 42.0%.
| Sex | Number | Average Earnings |
| Male | 7,034 (53.5%) | $45,344 |
| Female | 6,109 (46.5%) | $26,286 |
| Total | 13,143 (100.0%) | $34,551 |
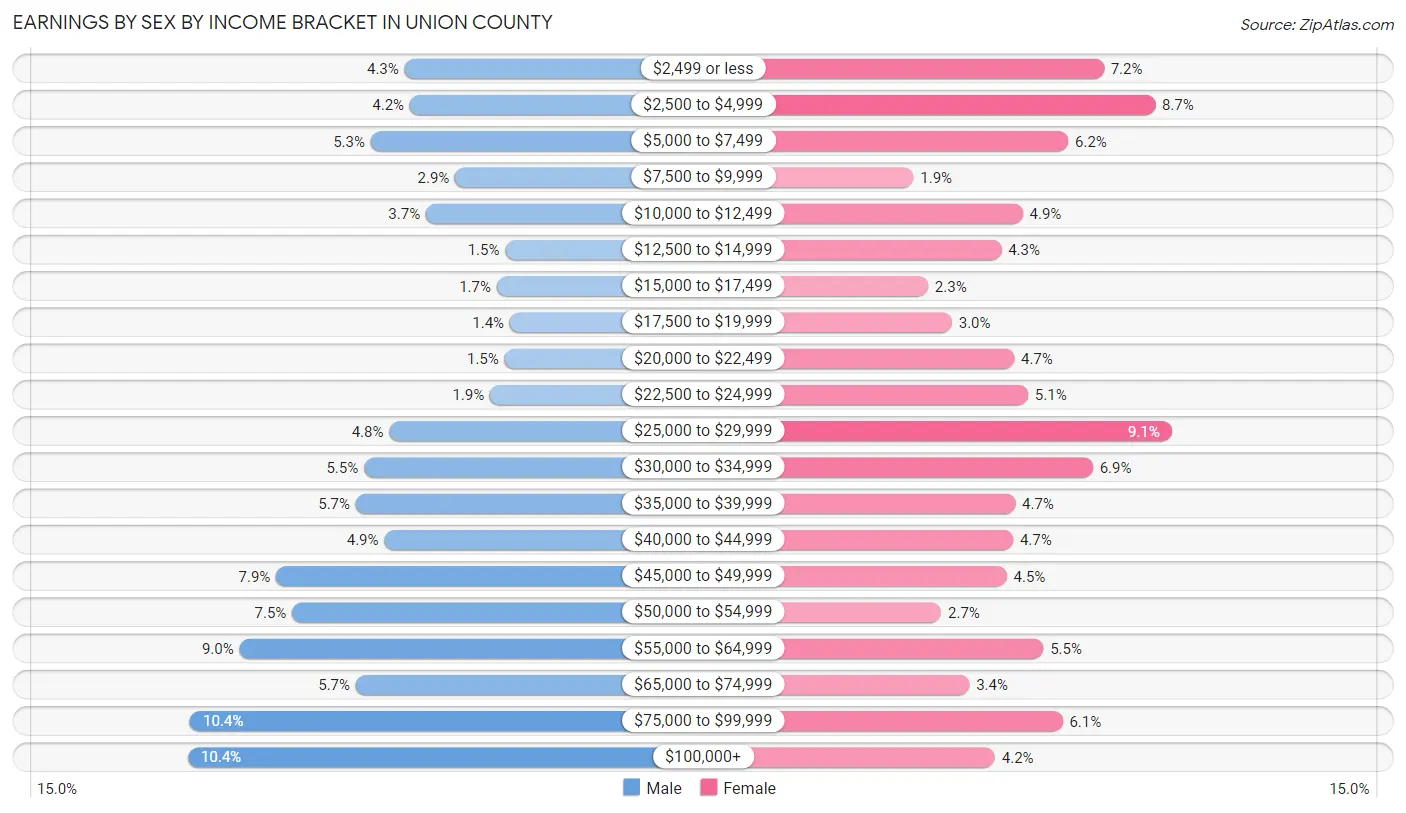
Earnings by Sex by Income Bracket in Union County
The most common earnings brackets in Union County are $100,000+ for men (732 | 10.4%) and $25,000 to $29,999 for women (558 | 9.1%).
| Income | Male | Female |
| $2,499 or less | 304 (4.3%) | 441 (7.2%) |
| $2,500 to $4,999 | 293 (4.2%) | 529 (8.7%) |
| $5,000 to $7,499 | 371 (5.3%) | 380 (6.2%) |
| $7,500 to $9,999 | 204 (2.9%) | 114 (1.9%) |
| $10,000 to $12,499 | 262 (3.7%) | 302 (4.9%) |
| $12,500 to $14,999 | 105 (1.5%) | 265 (4.3%) |
| $15,000 to $17,499 | 122 (1.7%) | 139 (2.3%) |
| $17,500 to $19,999 | 96 (1.4%) | 180 (2.9%) |
| $20,000 to $22,499 | 106 (1.5%) | 287 (4.7%) |
| $22,500 to $24,999 | 135 (1.9%) | 311 (5.1%) |
| $25,000 to $29,999 | 334 (4.8%) | 558 (9.1%) |
| $30,000 to $34,999 | 384 (5.5%) | 422 (6.9%) |
| $35,000 to $39,999 | 400 (5.7%) | 289 (4.7%) |
| $40,000 to $44,999 | 344 (4.9%) | 285 (4.7%) |
| $45,000 to $49,999 | 558 (7.9%) | 274 (4.5%) |
| $50,000 to $54,999 | 526 (7.5%) | 162 (2.6%) |
| $55,000 to $64,999 | 630 (9.0%) | 337 (5.5%) |
| $65,000 to $74,999 | 400 (5.7%) | 210 (3.4%) |
| $75,000 to $99,999 | 728 (10.3%) | 370 (6.1%) |
| $100,000+ | 732 (10.4%) | 254 (4.2%) |
| Total | 7,034 (100.0%) | 6,109 (100.0%) |
Earnings by Sex by Educational Attainment in Union County
Average earnings in Union County are $50,130 for men and $31,325 for women, a difference of 37.5%. Men with an educational attainment of graduate degree enjoy the highest average annual earnings of $88,348, while those with high school diploma education earn the least with $43,359. Women with an educational attainment of graduate degree earn the most with the average annual earnings of $54,265, while those with high school diploma education have the smallest earnings of $25,822.

| Educational Attainment | Male Income | Female Income |
| Less than High School | $46,534 | $0 |
| High School Diploma | $43,359 | $25,822 |
| College or Associate's Degree | $49,308 | $26,884 |
| Bachelor's Degree | $56,786 | $48,484 |
| Graduate Degree | $88,348 | $54,265 |
| Total | $50,130 | $31,325 |
Family Income in Union County
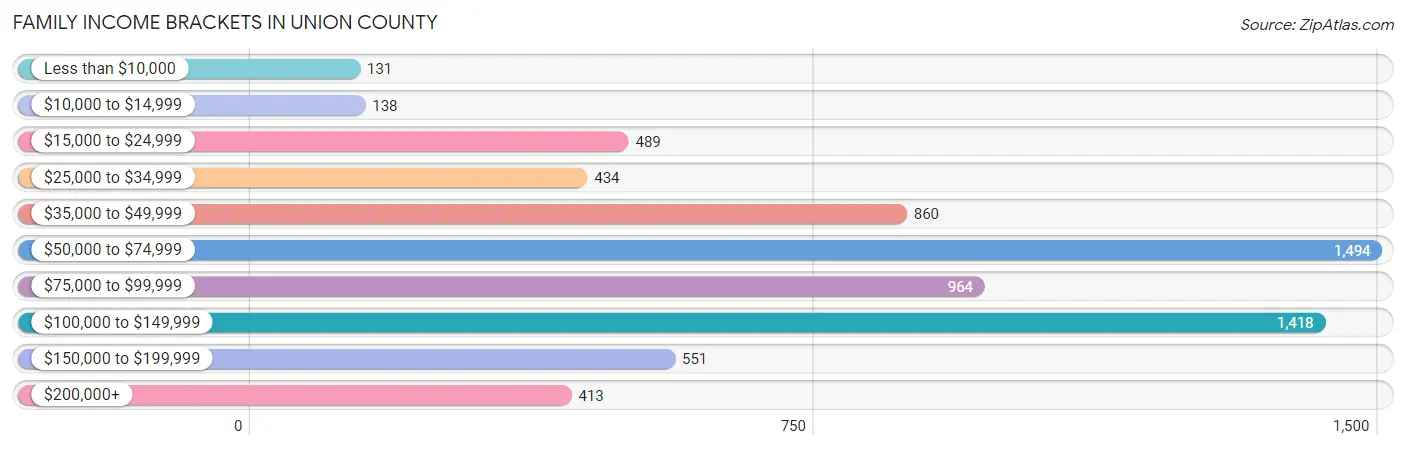
Family Income Brackets in Union County
According to the Union County family income data, there are 1,494 families falling into the $50,000 to $74,999 income range, which is the most common income bracket and makes up 21.7% of all families. Conversely, the less than $10,000 income bracket is the least frequent group with only 131 families (1.9%) belonging to this category.
| Income Bracket | # Families | % Families |
| Less than $10,000 | 131 | 1.9% |
| $10,000 to $14,999 | 138 | 2.0% |
| $15,000 to $24,999 | 489 | 7.1% |
| $25,000 to $34,999 | 434 | 6.3% |
| $35,000 to $49,999 | 860 | 12.5% |
| $50,000 to $74,999 | 1,494 | 21.7% |
| $75,000 to $99,999 | 964 | 14.0% |
| $100,000 to $149,999 | 1,418 | 20.6% |
| $150,000 to $199,999 | 551 | 8.0% |
| $200,000+ | 413 | 6.0% |
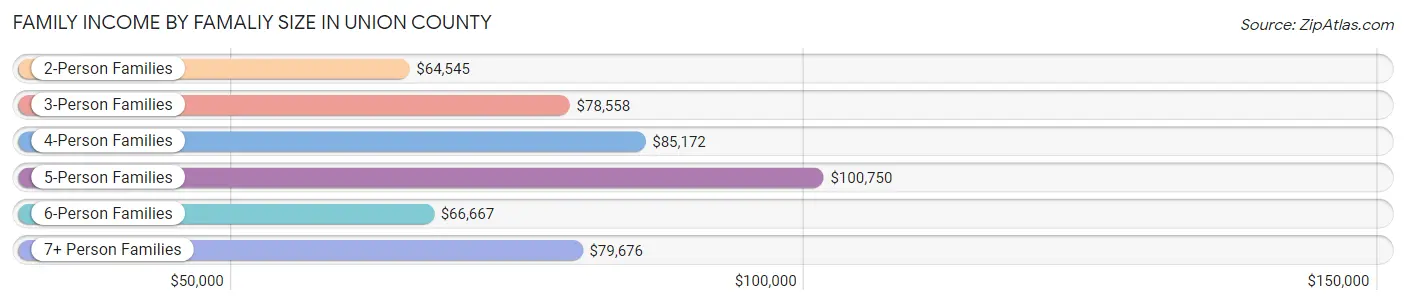
Family Income by Famaliy Size in Union County
5-person families (559 | 8.1%) account for the highest median family income in Union County with $100,750 per family, while 2-person families (3,916 | 56.9%) have the highest median income of $32,272 per family member.
| Income Bracket | # Families | Median Income |
| 2-Person Families | 3,916 (56.9%) | $64,545 |
| 3-Person Families | 1,171 (17.0%) | $78,558 |
| 4-Person Families | 854 (12.4%) | $85,172 |
| 5-Person Families | 559 (8.1%) | $100,750 |
| 6-Person Families | 140 (2.0%) | $66,667 |
| 7+ Person Families | 244 (3.5%) | $79,676 |
| Total | 6,884 (100.0%) | $73,561 |
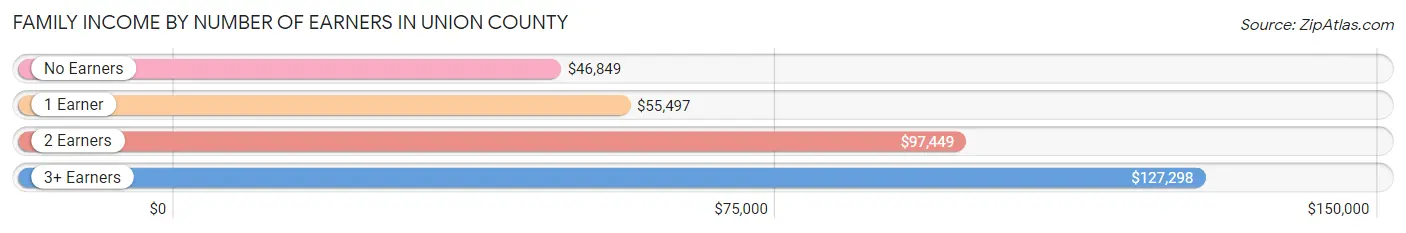
Family Income by Number of Earners in Union County
The median family income in Union County is $73,561, with families comprising 3+ earners (617) having the highest median family income of $127,298, while families with no earners (1,279) have the lowest median family income of $46,849, accounting for 9.0% and 18.6% of families, respectively.
| Number of Earners | # Families | Median Income |
| No Earners | 1,279 (18.6%) | $46,849 |
| 1 Earner | 2,419 (35.1%) | $55,497 |
| 2 Earners | 2,569 (37.3%) | $97,449 |
| 3+ Earners | 617 (9.0%) | $127,298 |
| Total | 6,884 (100.0%) | $73,561 |
Household Income in Union County
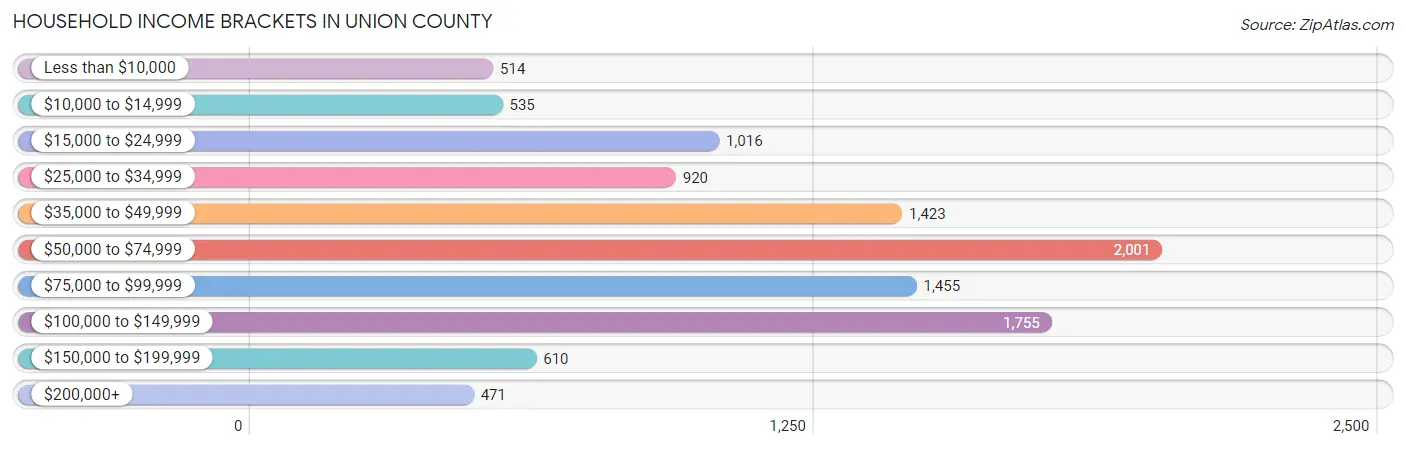
Household Income Brackets in Union County
With 2,001 households falling in the category, the $50,000 to $74,999 income range is the most frequent in Union County, accounting for 18.7% of all households. In contrast, only 471 households (4.4%) fall into the $200,000+ income bracket, making it the least populous group.
| Income Bracket | # Households | % Households |
| Less than $10,000 | 514 | 4.8% |
| $10,000 to $14,999 | 535 | 5.0% |
| $15,000 to $24,999 | 1,016 | 9.5% |
| $25,000 to $34,999 | 920 | 8.6% |
| $35,000 to $49,999 | 1,423 | 13.3% |
| $50,000 to $74,999 | 2,001 | 18.7% |
| $75,000 to $99,999 | 1,455 | 13.6% |
| $100,000 to $149,999 | 1,755 | 16.4% |
| $150,000 to $199,999 | 610 | 5.7% |
| $200,000+ | 471 | 4.4% |
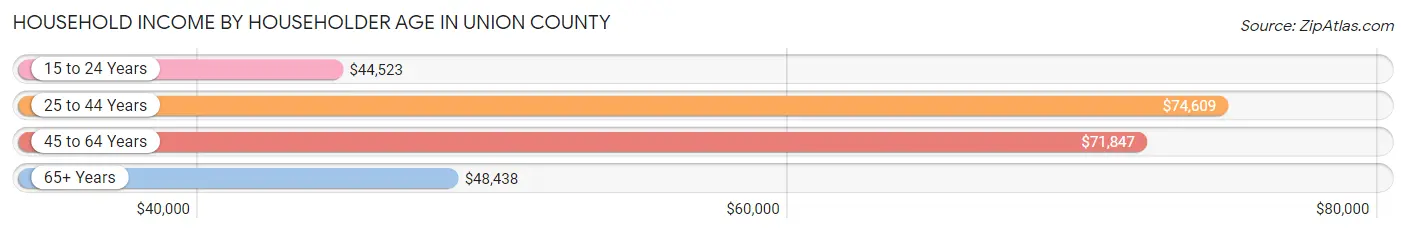
Household Income by Householder Age in Union County
The median household income in Union County is $61,946, with the highest median household income of $74,609 found in the 25 to 44 years age bracket for the primary householder. A total of 3,121 households (29.2%) fall into this category. Meanwhile, the 15 to 24 years age bracket for the primary householder has the lowest median household income of $44,523, with 855 households (8.0%) in this group.
| Income Bracket | # Households | Median Income |
| 15 to 24 Years | 855 (8.0%) | $44,523 |
| 25 to 44 Years | 3,121 (29.2%) | $74,609 |
| 45 to 64 Years | 3,169 (29.6%) | $71,847 |
| 65+ Years | 3,555 (33.2%) | $48,438 |
| Total | 10,700 (100.0%) | $61,946 |
Poverty in Union County
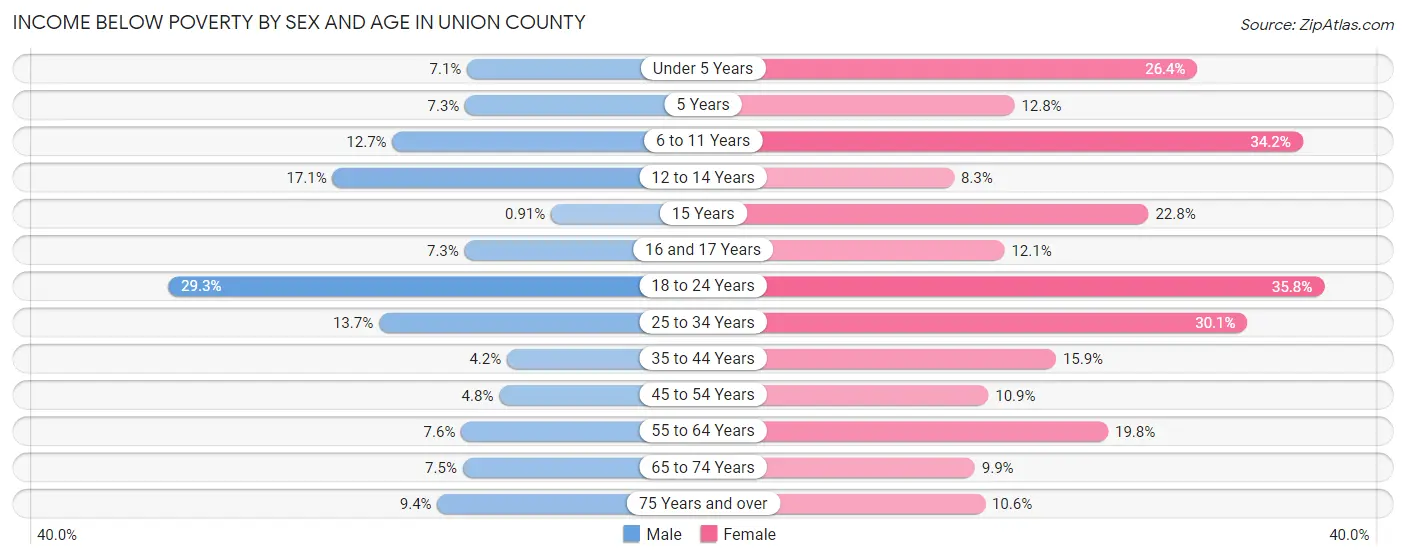
Income Below Poverty by Sex and Age in Union County
With 10.6% poverty level for males and 19.9% for females among the residents of Union County, 18 to 24 year old males and 18 to 24 year old females are the most vulnerable to poverty, with 406 males (29.3%) and 450 females (35.8%) in their respective age groups living below the poverty level.
| Age Bracket | Male | Female |
| Under 5 Years | 48 (7.1%) | 161 (26.4%) |
| 5 Years | 14 (7.3%) | 25 (12.8%) |
| 6 to 11 Years | 147 (12.7%) | 325 (34.2%) |
| 12 to 14 Years | 72 (17.1%) | 33 (8.3%) |
| 15 Years | 2 (0.9%) | 51 (22.8%) |
| 16 and 17 Years | 22 (7.3%) | 40 (12.1%) |
| 18 to 24 Years | 406 (29.3%) | 450 (35.8%) |
| 25 to 34 Years | 211 (13.7%) | 446 (30.1%) |
| 35 to 44 Years | 69 (4.2%) | 253 (15.9%) |
| 45 to 54 Years | 62 (4.8%) | 133 (10.9%) |
| 55 to 64 Years | 118 (7.6%) | 340 (19.8%) |
| 65 to 74 Years | 119 (7.5%) | 159 (9.9%) |
| 75 Years and over | 90 (9.3%) | 129 (10.6%) |
| Total | 1,380 (10.6%) | 2,545 (19.9%) |
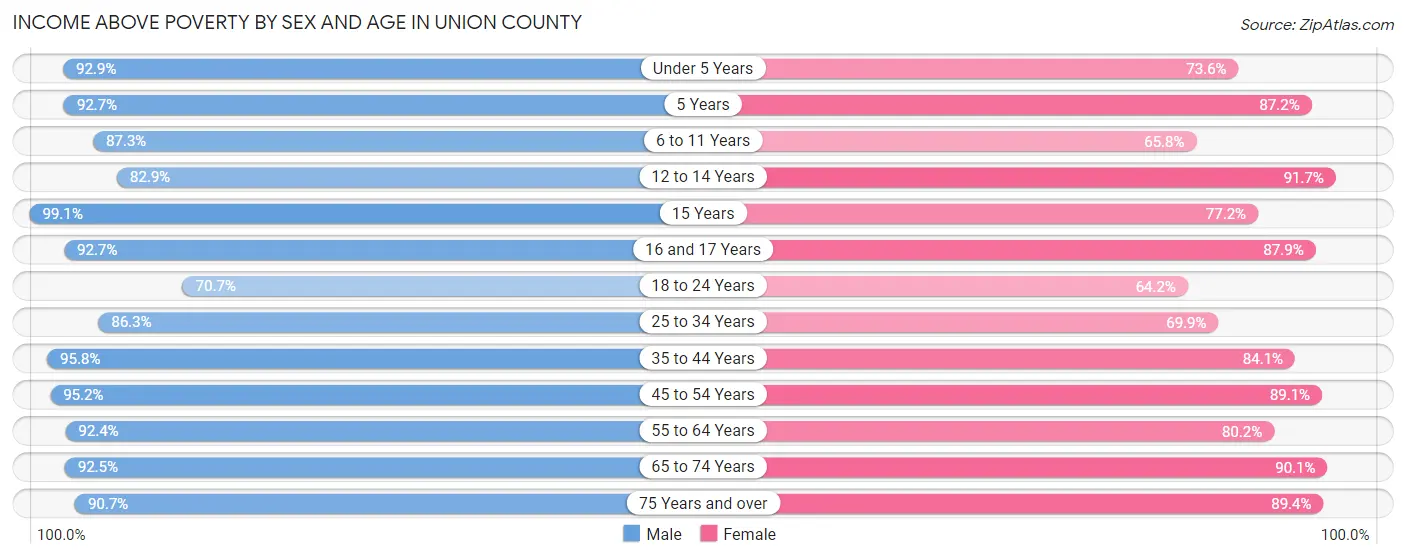
Income Above Poverty by Sex and Age in Union County
According to the poverty statistics in Union County, males aged 15 years and females aged 12 to 14 years are the age groups that are most secure financially, with 99.1% of males and 91.7% of females in these age groups living above the poverty line.
| Age Bracket | Male | Female |
| Under 5 Years | 624 (92.9%) | 449 (73.6%) |
| 5 Years | 178 (92.7%) | 170 (87.2%) |
| 6 to 11 Years | 1,011 (87.3%) | 625 (65.8%) |
| 12 to 14 Years | 348 (82.9%) | 363 (91.7%) |
| 15 Years | 217 (99.1%) | 173 (77.2%) |
| 16 and 17 Years | 278 (92.7%) | 291 (87.9%) |
| 18 to 24 Years | 978 (70.7%) | 807 (64.2%) |
| 25 to 34 Years | 1,330 (86.3%) | 1,035 (69.9%) |
| 35 to 44 Years | 1,582 (95.8%) | 1,338 (84.1%) |
| 45 to 54 Years | 1,241 (95.2%) | 1,089 (89.1%) |
| 55 to 64 Years | 1,438 (92.4%) | 1,380 (80.2%) |
| 65 to 74 Years | 1,475 (92.5%) | 1,450 (90.1%) |
| 75 Years and over | 873 (90.6%) | 1,084 (89.4%) |
| Total | 11,573 (89.3%) | 10,254 (80.1%) |
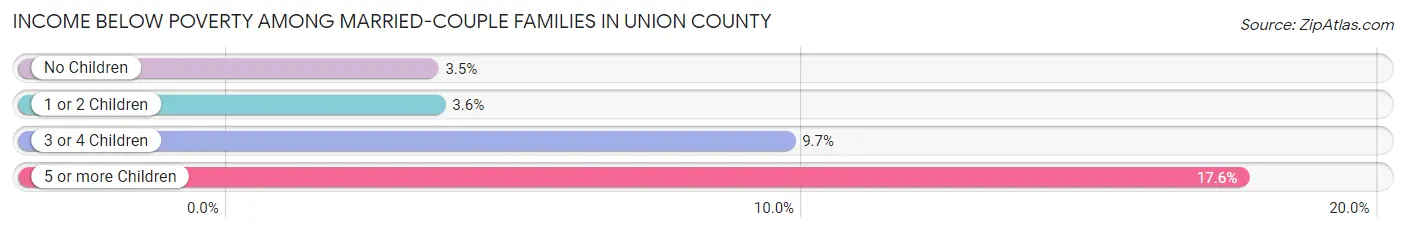
Income Below Poverty Among Married-Couple Families in Union County
The poverty statistics for married-couple families in Union County show that 4.5% or 237 of the total 5,285 families live below the poverty line. Families with 5 or more children have the highest poverty rate of 17.6%, comprising of 22 families. On the other hand, families with no children have the lowest poverty rate of 3.5%, which includes 118 families.
| Children | Above Poverty | Below Poverty |
| No Children | 3,259 (96.5%) | 118 (3.5%) |
| 1 or 2 Children | 1,202 (96.4%) | 45 (3.6%) |
| 3 or 4 Children | 484 (90.3%) | 52 (9.7%) |
| 5 or more Children | 103 (82.4%) | 22 (17.6%) |
| Total | 5,048 (95.5%) | 237 (4.5%) |
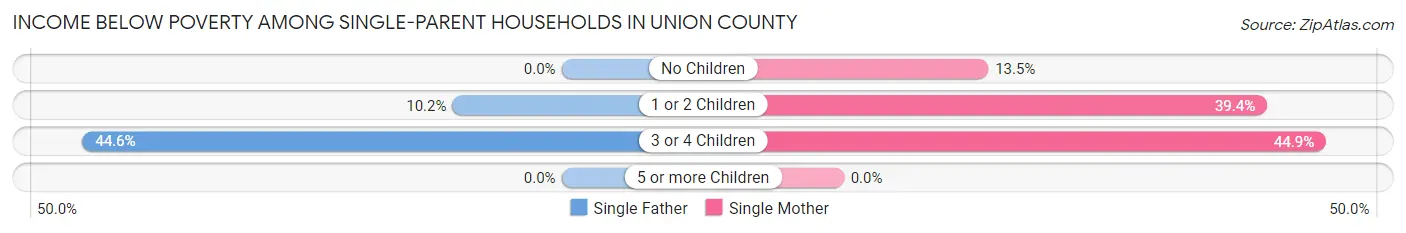
Income Below Poverty Among Single-Parent Households in Union County
According to the poverty data in Union County, 9.0% or 47 single-father households and 29.1% or 314 single-mother households are living below the poverty line. Among single-father households, those with 3 or 4 children have the highest poverty rate, with 29 households (44.6%) experiencing poverty. Likewise, among single-mother households, those with 3 or 4 children have the highest poverty rate, with 53 households (44.9%) falling below the poverty line.
| Children | Single Father | Single Mother |
| No Children | 0 (0.0%) | 56 (13.5%) |
| 1 or 2 Children | 18 (10.2%) | 205 (39.4%) |
| 3 or 4 Children | 29 (44.6%) | 53 (44.9%) |
| 5 or more Children | 0 (0.0%) | 0 (0.0%) |
| Total | 47 (9.0%) | 314 (29.1%) |
Income Below Poverty Among Married-Couple vs Single-Parent Households in Union County
The poverty data for Union County shows that 237 of the married-couple family households (4.5%) and 361 of the single-parent households (22.6%) are living below the poverty level. Within the married-couple family households, those with 5 or more children have the highest poverty rate, with 22 households (17.6%) falling below the poverty line. Among the single-parent households, those with 3 or 4 children have the highest poverty rate, with 82 household (44.8%) living below poverty.
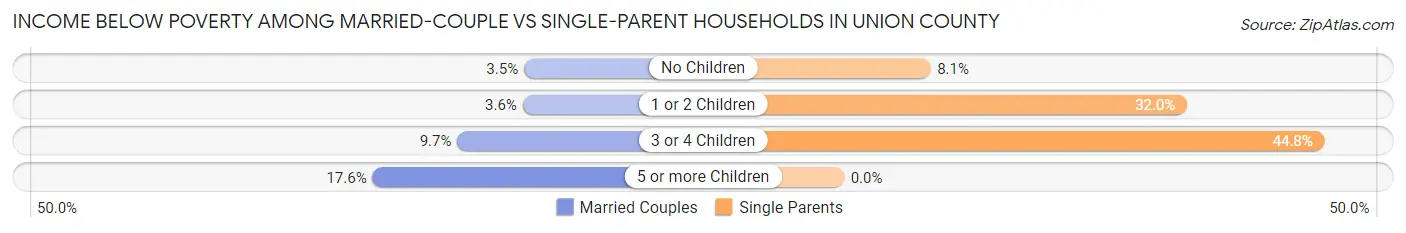
| Children | Married-Couple Families | Single-Parent Households |
| No Children | 118 (3.5%) | 56 (8.1%) |
| 1 or 2 Children | 45 (3.6%) | 223 (32.0%) |
| 3 or 4 Children | 52 (9.7%) | 82 (44.8%) |
| 5 or more Children | 22 (17.6%) | 0 (0.0%) |
| Total | 237 (4.5%) | 361 (22.6%) |
Race in Union County
The most populous races in Union County are White / Caucasian (23,701 | 90.2%), Hispanic or Latino (1,368 | 5.2%), and Two or more Races (1,067 | 4.1%).
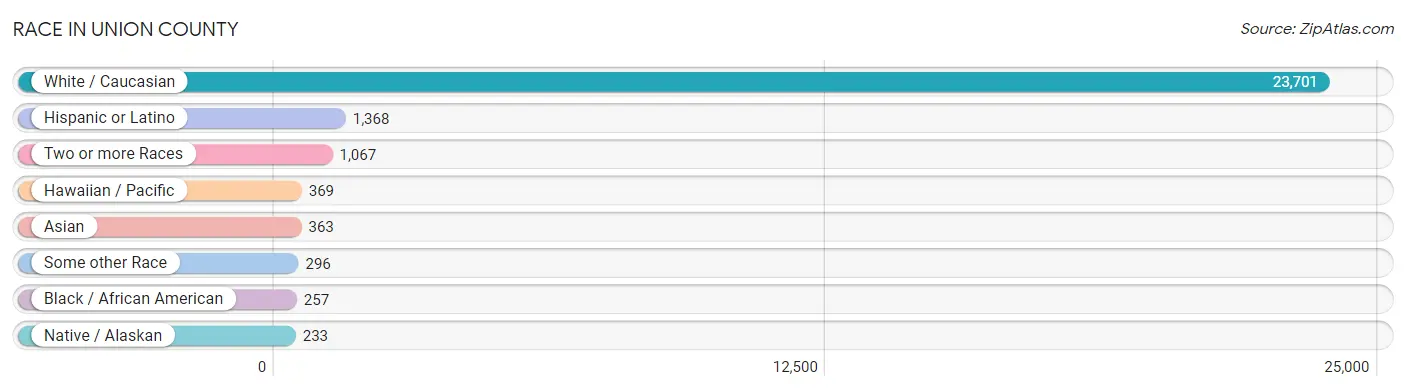
| Race | # Population | % Population |
| Asian | 363 | 1.4% |
| Black / African American | 257 | 1.0% |
| Hawaiian / Pacific | 369 | 1.4% |
| Hispanic or Latino | 1,368 | 5.2% |
| Native / Alaskan | 233 | 0.9% |
| White / Caucasian | 23,701 | 90.2% |
| Two or more Races | 1,067 | 4.1% |
| Some other Race | 296 | 1.1% |
| Total | 26,286 | 100.0% |
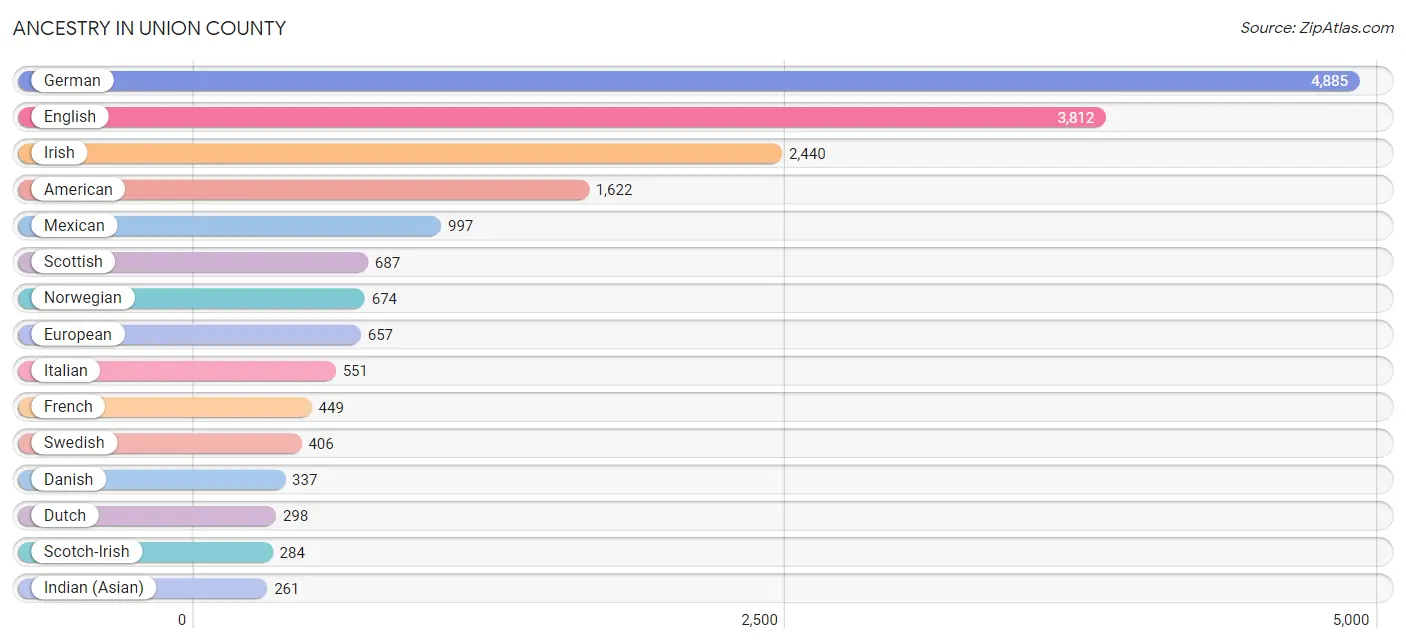
Ancestry in Union County
The most populous ancestries reported in Union County are German (4,885 | 18.6%), English (3,812 | 14.5%), Irish (2,440 | 9.3%), American (1,622 | 6.2%), and Mexican (997 | 3.8%), together accounting for 52.3% of all Union County residents.
| Ancestry | # Population | % Population |
| African | 25 | 0.1% |
| Alaska Native | 19 | 0.1% |
| Alsatian | 10 | 0.0% |
| American | 1,622 | 6.2% |
| Arab | 59 | 0.2% |
| Arapaho | 17 | 0.1% |
| Armenian | 2 | 0.0% |
| Austrian | 34 | 0.1% |
| Basque | 49 | 0.2% |
| Belgian | 97 | 0.4% |
| Bhutanese | 62 | 0.2% |
| Blackfeet | 10 | 0.0% |
| British | 215 | 0.8% |
| Burmese | 43 | 0.2% |
| Cajun | 8 | 0.0% |
| Canadian | 64 | 0.2% |
| Central American | 31 | 0.1% |
| Central American Indian | 5 | 0.0% |
| Cherokee | 95 | 0.4% |
| Cheyenne | 12 | 0.1% |
| Chickasaw | 28 | 0.1% |
| Chippewa | 11 | 0.0% |
| Choctaw | 93 | 0.4% |
| Colombian | 82 | 0.3% |
| Croatian | 59 | 0.2% |
| Crow | 32 | 0.1% |
| Cuban | 4 | 0.0% |
| Czech | 111 | 0.4% |
| Czechoslovakian | 21 | 0.1% |
| Danish | 337 | 1.3% |
| Delaware | 2 | 0.0% |
| Dominican | 11 | 0.0% |
| Dutch | 298 | 1.1% |
| Eastern European | 12 | 0.1% |
| English | 3,812 | 14.5% |
| Ethiopian | 14 | 0.1% |
| European | 657 | 2.5% |
| Fijian | 19 | 0.1% |
| Filipino | 3 | 0.0% |
| Finnish | 52 | 0.2% |
| French | 449 | 1.7% |
| French Canadian | 60 | 0.2% |
| German | 4,885 | 18.6% |
| Greek | 103 | 0.4% |
| Guamanian / Chamorro | 84 | 0.3% |
| Guatemalan | 7 | 0.0% |
| Haitian | 18 | 0.1% |
| Hopi | 4 | 0.0% |
| Hungarian | 53 | 0.2% |
| Icelander | 3 | 0.0% |
| Indian (Asian) | 261 | 1.0% |
| Irish | 2,440 | 9.3% |
| Italian | 551 | 2.1% |
| Korean | 144 | 0.5% |
| Latvian | 2 | 0.0% |
| Lebanese | 13 | 0.1% |
| Malaysian | 17 | 0.1% |
| Mexican | 997 | 3.8% |
| Mexican American Indian | 10 | 0.0% |
| Moroccan | 11 | 0.0% |
| Native Hawaiian | 13 | 0.1% |
| Nicaraguan | 7 | 0.0% |
| Northern European | 72 | 0.3% |
| Norwegian | 674 | 2.6% |
| Peruvian | 10 | 0.0% |
| Polish | 150 | 0.6% |
| Portuguese | 79 | 0.3% |
| Puerto Rican | 74 | 0.3% |
| Romanian | 10 | 0.0% |
| Russian | 56 | 0.2% |
| Salvadoran | 17 | 0.1% |
| Scandinavian | 216 | 0.8% |
| Scotch-Irish | 284 | 1.1% |
| Scottish | 687 | 2.6% |
| Shoshone | 17 | 0.1% |
| Sioux | 1 | 0.0% |
| Slavic | 13 | 0.1% |
| Slovak | 19 | 0.1% |
| Slovene | 8 | 0.0% |
| South American | 106 | 0.4% |
| Spaniard | 53 | 0.2% |
| Spanish | 66 | 0.3% |
| Sri Lankan | 5 | 0.0% |
| Subsaharan African | 39 | 0.2% |
| Swedish | 406 | 1.5% |
| Swiss | 210 | 0.8% |
| Syrian | 25 | 0.1% |
| Thai | 74 | 0.3% |
| Tlingit-Haida | 3 | 0.0% |
| Ukrainian | 46 | 0.2% |
| Venezuelan | 14 | 0.1% |
| Welsh | 234 | 0.9% |
| Yaqui | 14 | 0.1% |
| Yup'ik | 1 | 0.0% | View All 94 Rows |
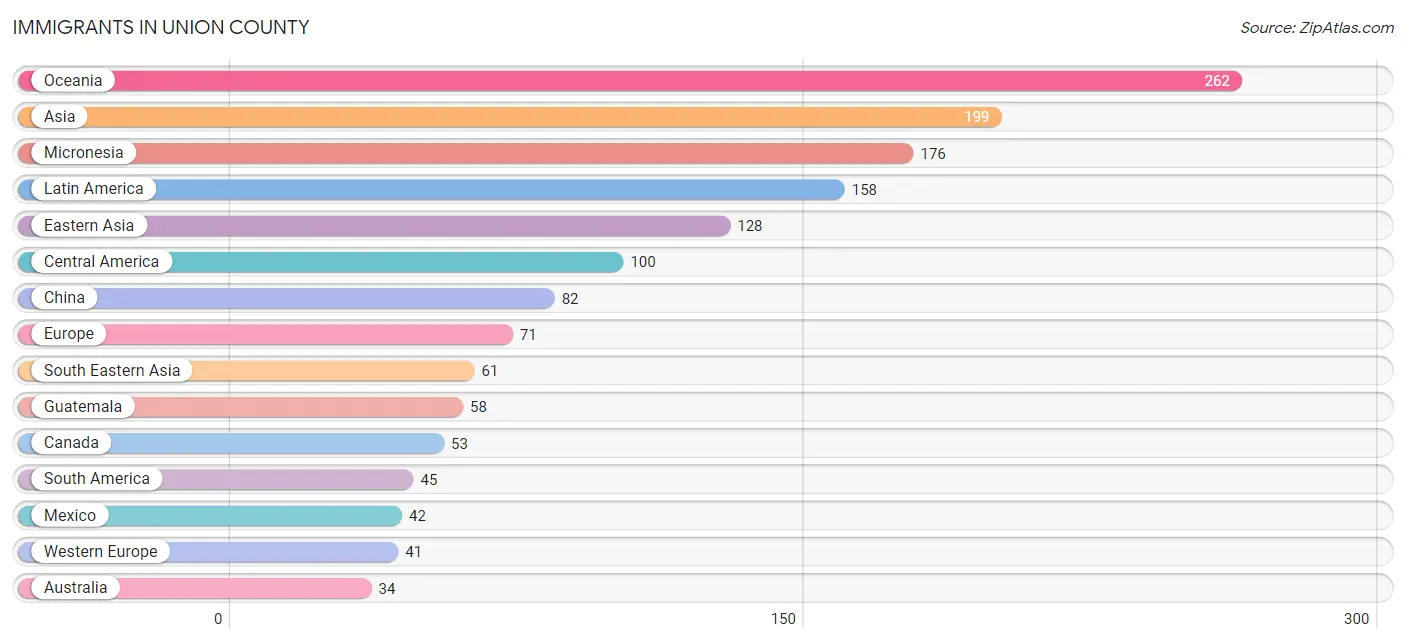
Immigrants in Union County
The most numerous immigrant groups reported in Union County came from Oceania (262 | 1.0%), Asia (199 | 0.8%), Micronesia (176 | 0.7%), Latin America (158 | 0.6%), and Eastern Asia (128 | 0.5%), together accounting for 3.5% of all Union County residents.
| Immigration Origin | # Population | % Population |
| Africa | 25 | 0.1% |
| Argentina | 2 | 0.0% |
| Asia | 199 | 0.8% |
| Australia | 34 | 0.1% |
| Brazil | 20 | 0.1% |
| Canada | 53 | 0.2% |
| Caribbean | 13 | 0.1% |
| Central America | 100 | 0.4% |
| Chile | 13 | 0.1% |
| China | 82 | 0.3% |
| Dominican Republic | 11 | 0.0% |
| Eastern Africa | 14 | 0.1% |
| Eastern Asia | 128 | 0.5% |
| Eastern Europe | 10 | 0.0% |
| England | 5 | 0.0% |
| Ethiopia | 14 | 0.1% |
| Europe | 71 | 0.3% |
| France | 16 | 0.1% |
| Germany | 6 | 0.0% |
| Greece | 8 | 0.0% |
| Guatemala | 58 | 0.2% |
| Haiti | 2 | 0.0% |
| Hong Kong | 22 | 0.1% |
| India | 10 | 0.0% |
| Italy | 4 | 0.0% |
| Japan | 23 | 0.1% |
| Korea | 23 | 0.1% |
| Laos | 17 | 0.1% |
| Latin America | 158 | 0.6% |
| Mexico | 42 | 0.2% |
| Micronesia | 176 | 0.7% |
| Morocco | 11 | 0.0% |
| Netherlands | 12 | 0.1% |
| Northern Africa | 11 | 0.0% |
| Northern Europe | 5 | 0.0% |
| Oceania | 262 | 1.0% |
| Peru | 10 | 0.0% |
| Philippines | 19 | 0.1% |
| Poland | 8 | 0.0% |
| Russia | 2 | 0.0% |
| Singapore | 20 | 0.1% |
| South America | 45 | 0.2% |
| South Central Asia | 10 | 0.0% |
| South Eastern Asia | 61 | 0.2% |
| Southern Europe | 15 | 0.1% |
| Spain | 3 | 0.0% |
| Switzerland | 7 | 0.0% |
| Vietnam | 5 | 0.0% |
| Western Europe | 41 | 0.2% | View All 49 Rows |
Sex and Age in Union County
Sex and Age in Union County
The most populous age groups in Union County are 20 to 24 Years (1,084 | 8.2%) for men and 20 to 24 Years (1,112 | 8.5%) for women.
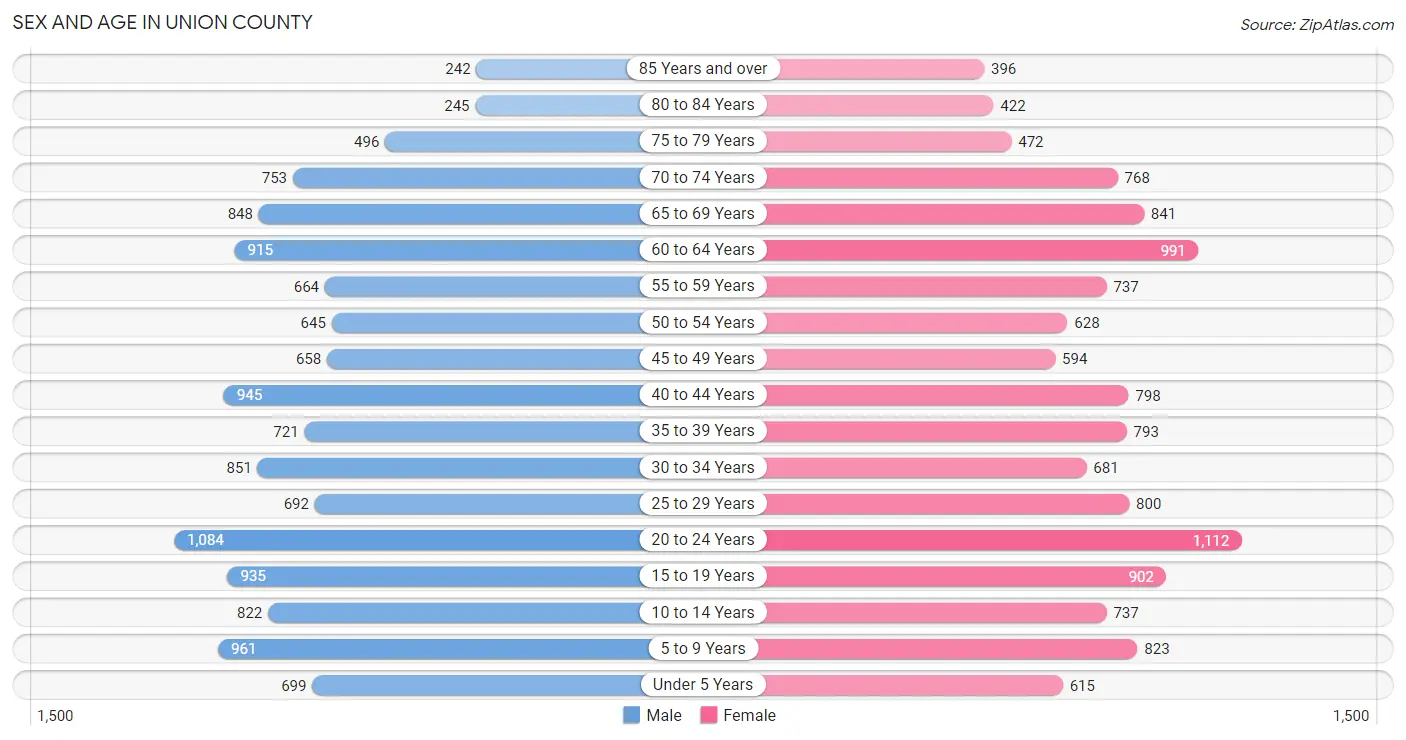
| Age Bracket | Male | Female |
| Under 5 Years | 699 (5.3%) | 615 (4.7%) |
| 5 to 9 Years | 961 (7.3%) | 823 (6.3%) |
| 10 to 14 Years | 822 (6.2%) | 737 (5.6%) |
| 15 to 19 Years | 935 (7.1%) | 902 (6.9%) |
| 20 to 24 Years | 1,084 (8.2%) | 1,112 (8.5%) |
| 25 to 29 Years | 692 (5.2%) | 800 (6.1%) |
| 30 to 34 Years | 851 (6.5%) | 681 (5.2%) |
| 35 to 39 Years | 721 (5.5%) | 793 (6.0%) |
| 40 to 44 Years | 945 (7.2%) | 798 (6.1%) |
| 45 to 49 Years | 658 (5.0%) | 594 (4.5%) |
| 50 to 54 Years | 645 (4.9%) | 628 (4.8%) |
| 55 to 59 Years | 664 (5.0%) | 737 (5.6%) |
| 60 to 64 Years | 915 (6.9%) | 991 (7.6%) |
| 65 to 69 Years | 848 (6.4%) | 841 (6.4%) |
| 70 to 74 Years | 753 (5.7%) | 768 (5.9%) |
| 75 to 79 Years | 496 (3.8%) | 472 (3.6%) |
| 80 to 84 Years | 245 (1.9%) | 422 (3.2%) |
| 85 Years and over | 242 (1.8%) | 396 (3.0%) |
| Total | 13,176 (100.0%) | 13,110 (100.0%) |
Families and Households in Union County
Median Family Size in Union County
The median family size in Union County is 2.89 persons per family, with married-couple families (5,285 | 76.8%) accounting for the largest median family size of 2.96 persons per family. On the other hand, single male/father families (521 | 7.6%) represent the smallest median family size with 2.46 persons per family.
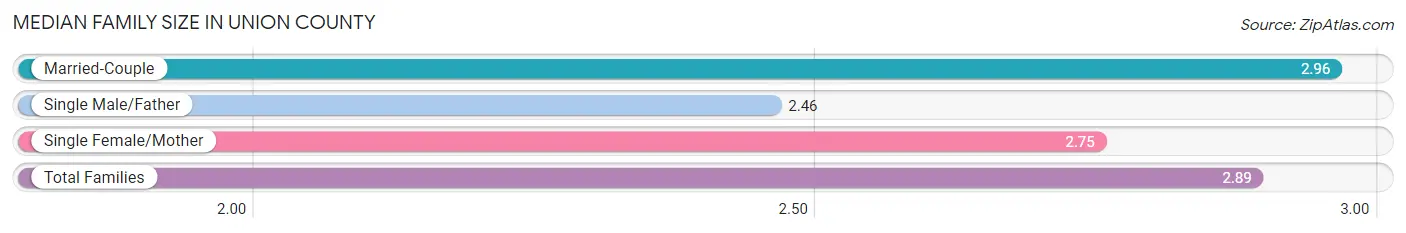
| Family Type | # Families | Family Size |
| Married-Couple | 5,285 (76.8%) | 2.96 |
| Single Male/Father | 521 (7.6%) | 2.46 |
| Single Female/Mother | 1,078 (15.7%) | 2.75 |
| Total Families | 6,884 (100.0%) | 2.89 |
Median Household Size in Union County
The median household size in Union County is 2.39 persons per household, with single female/mother households (1,078 | 10.1%) accounting for the largest median household size of 3.06 persons per household. non-family households (3,816 | 35.7%) represent the smallest median household size with 1.30 persons per household.
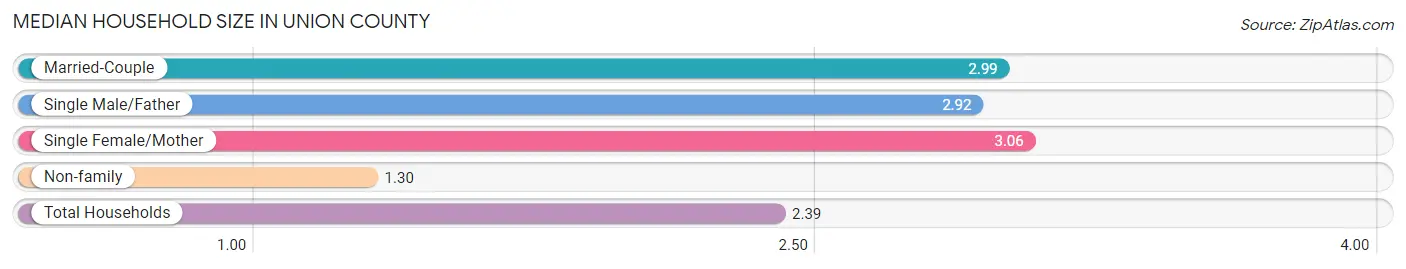
| Household Type | # Households | Household Size |
| Married-Couple | 5,285 (49.4%) | 2.99 |
| Single Male/Father | 521 (4.9%) | 2.92 |
| Single Female/Mother | 1,078 (10.1%) | 3.06 |
| Non-family | 3,816 (35.7%) | 1.30 |
| Total Households | 10,700 (100.0%) | 2.39 |
Household Size by Marriage Status in Union County
Out of a total of 10,700 households in Union County, 6,884 (64.3%) are family households, while 3,816 (35.7%) are nonfamily households. The most numerous type of family households are 2-person households, comprising 3,647, and the most common type of nonfamily households are 1-person households, comprising 2,897.
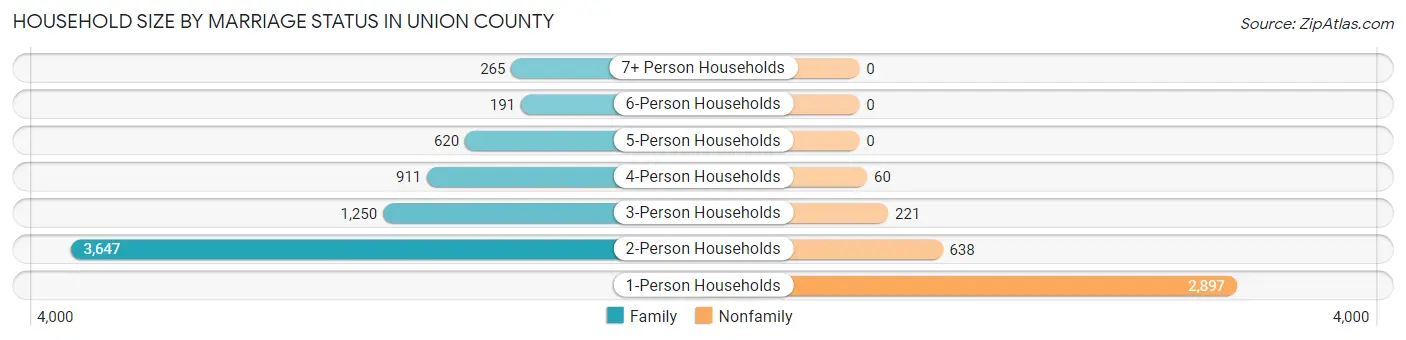
| Household Size | Family Households | Nonfamily Households |
| 1-Person Households | - | 2,897 (27.1%) |
| 2-Person Households | 3,647 (34.1%) | 638 (6.0%) |
| 3-Person Households | 1,250 (11.7%) | 221 (2.1%) |
| 4-Person Households | 911 (8.5%) | 60 (0.6%) |
| 5-Person Households | 620 (5.8%) | 0 (0.0%) |
| 6-Person Households | 191 (1.8%) | 0 (0.0%) |
| 7+ Person Households | 265 (2.5%) | 0 (0.0%) |
| Total | 6,884 (64.3%) | 3,816 (35.7%) |
Female Fertility in Union County
Fertility by Age in Union County
Average fertility rate in Union County is 39.0 births per 1,000 women. Women in the age bracket of 20 to 34 years have the highest fertility rate with 83.0 births per 1,000 women. Women in the age bracket of 20 to 34 years acount for 94.7% of all women with births.
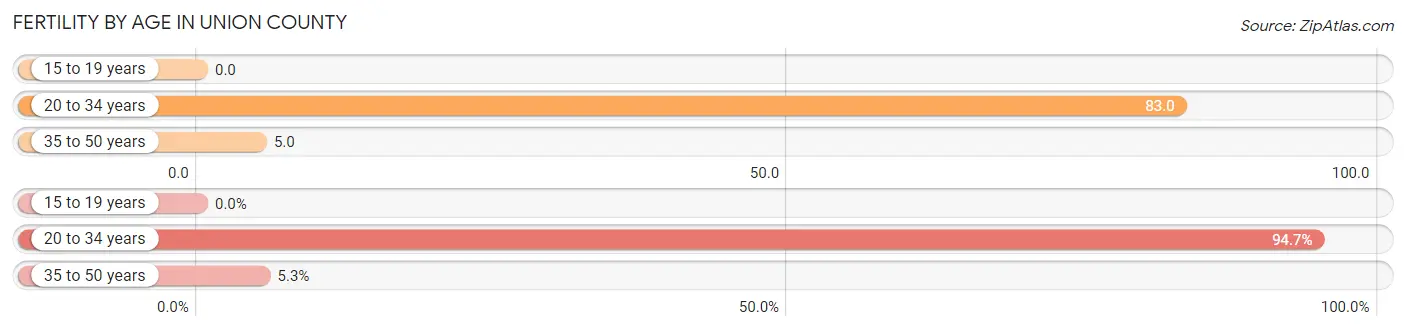
| Age Bracket | Women with Births | Births / 1,000 Women |
| 15 to 19 years | 0 (0.0%) | 0.0 |
| 20 to 34 years | 214 (94.7%) | 83.0 |
| 35 to 50 years | 12 (5.3%) | 5.0 |
| Total | 226 (100.0%) | 39.0 |
Fertility by Age by Marriage Status in Union County
82.3% of women with births (226) in Union County are married. The highest percentage of unmarried women with births falls into 20 to 34 years age bracket with 18.7% of them unmarried at the time of birth, while the lowest percentage of unmarried women with births belong to 35 to 50 years age bracket with 0.0% of them unmarried.
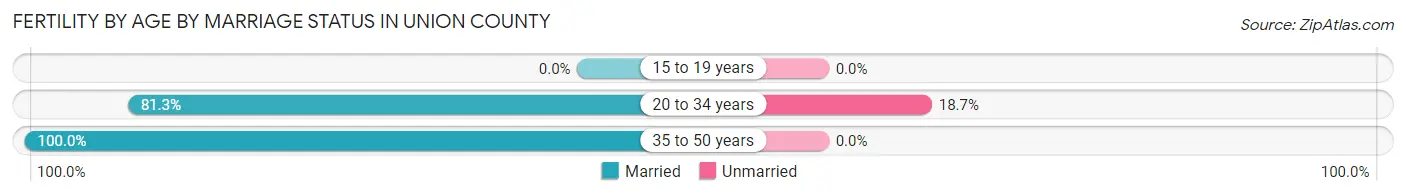
| Age Bracket | Married | Unmarried |
| 15 to 19 years | 0 (0.0%) | 0 (0.0%) |
| 20 to 34 years | 174 (81.3%) | 40 (18.7%) |
| 35 to 50 years | 12 (100.0%) | 0 (0.0%) |
| Total | 186 (82.3%) | 40 (17.7%) |
Fertility by Education in Union County
Average fertility rate in Union County is 39.0 births per 1,000 women. Women with the education attainment of high school diploma have the highest fertility rate of 54.0 births per 1,000 women, while women with the education attainment of less than high school have the lowest fertility at 20.0 births per 1,000 women. Women with the education attainment of high school diploma represent 35.8% of all women with births.
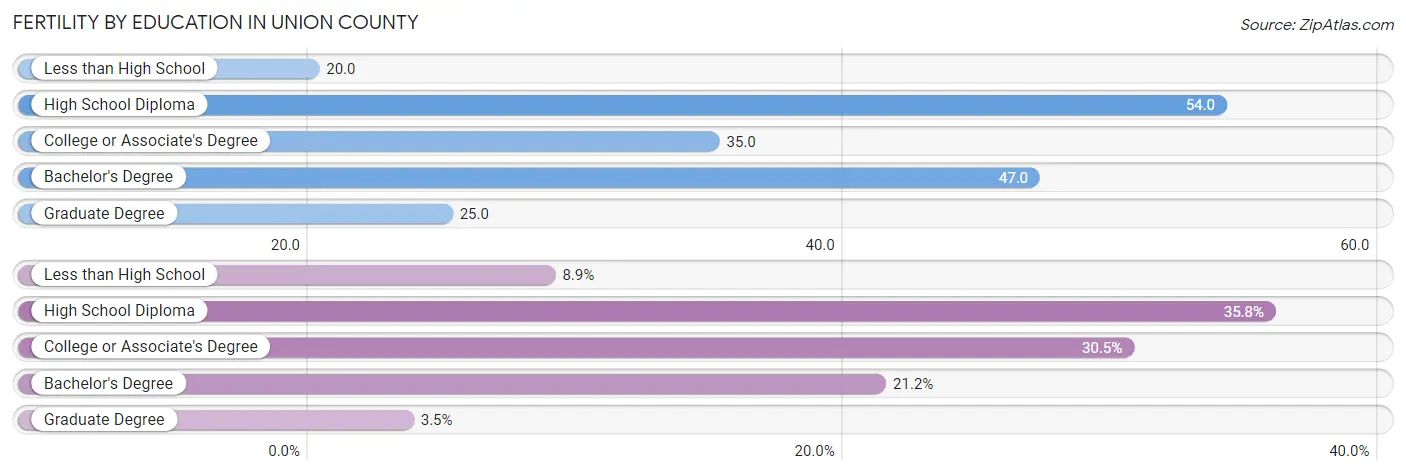
| Educational Attainment | Women with Births | Births / 1,000 Women |
| Less than High School | 20 (8.8%) | 20.0 |
| High School Diploma | 81 (35.8%) | 54.0 |
| College or Associate's Degree | 69 (30.5%) | 35.0 |
| Bachelor's Degree | 48 (21.2%) | 47.0 |
| Graduate Degree | 8 (3.5%) | 25.0 |
| Total | 226 (100.0%) | 39.0 |
Fertility by Education by Marriage Status in Union County
17.7% of women with births in Union County are unmarried. Women with the educational attainment of bachelor's degree are most likely to be married with 100.0% of them married at childbirth, while women with the educational attainment of less than high school are least likely to be married with 80.0% of them unmarried at childbirth.
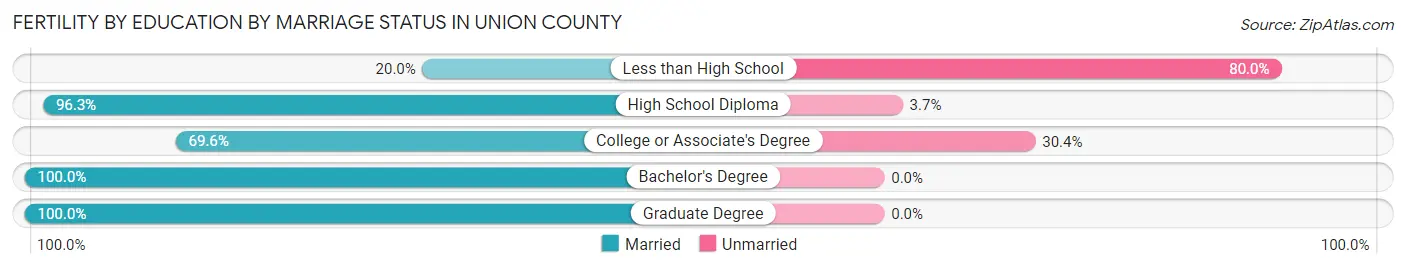
| Educational Attainment | Married | Unmarried |
| Less than High School | 4 (20.0%) | 16 (80.0%) |
| High School Diploma | 78 (96.3%) | 3 (3.7%) |
| College or Associate's Degree | 48 (69.6%) | 21 (30.4%) |
| Bachelor's Degree | 48 (100.0%) | 0 (0.0%) |
| Graduate Degree | 8 (100.0%) | 0 (0.0%) |
| Total | 186 (82.3%) | 40 (17.7%) |
Employment Characteristics in Union County
Employment by Class of Employer in Union County
Among the 11,304 employed individuals in Union County, private company employees (6,636 | 58.7%), local government employees (1,025 | 9.1%), and not-for-profit organizations (934 | 8.3%) make up the most common classes of employment.
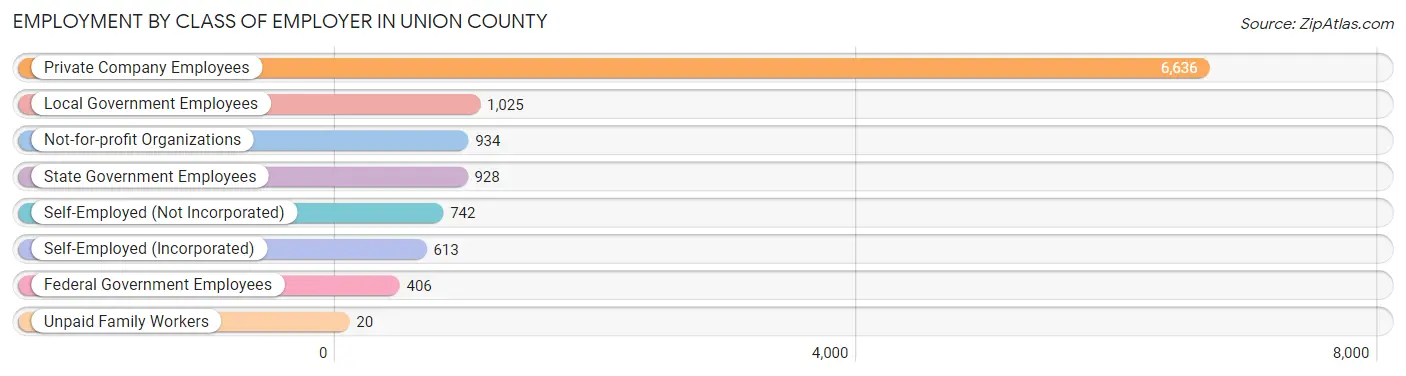
| Employer Class | # Employees | % Employees |
| Private Company Employees | 6,636 | 58.7% |
| Self-Employed (Incorporated) | 613 | 5.4% |
| Self-Employed (Not Incorporated) | 742 | 6.6% |
| Not-for-profit Organizations | 934 | 8.3% |
| Local Government Employees | 1,025 | 9.1% |
| State Government Employees | 928 | 8.2% |
| Federal Government Employees | 406 | 3.6% |
| Unpaid Family Workers | 20 | 0.2% |
| Total | 11,304 | 100.0% |
Employment Status by Age in Union County
According to the labor force statistics for Union County, out of the total population over 16 years of age (21,181), 58.2% or 12,327 individuals are in the labor force, with 6.3% or 777 of them unemployed. The age group with the highest labor force participation rate is 35 to 44 years, with 83.8% or 2,729 individuals in the labor force. Within the labor force, the 16 to 19 years age range has the highest percentage of unemployed individuals, with 13.6% or 93 of them being unemployed.
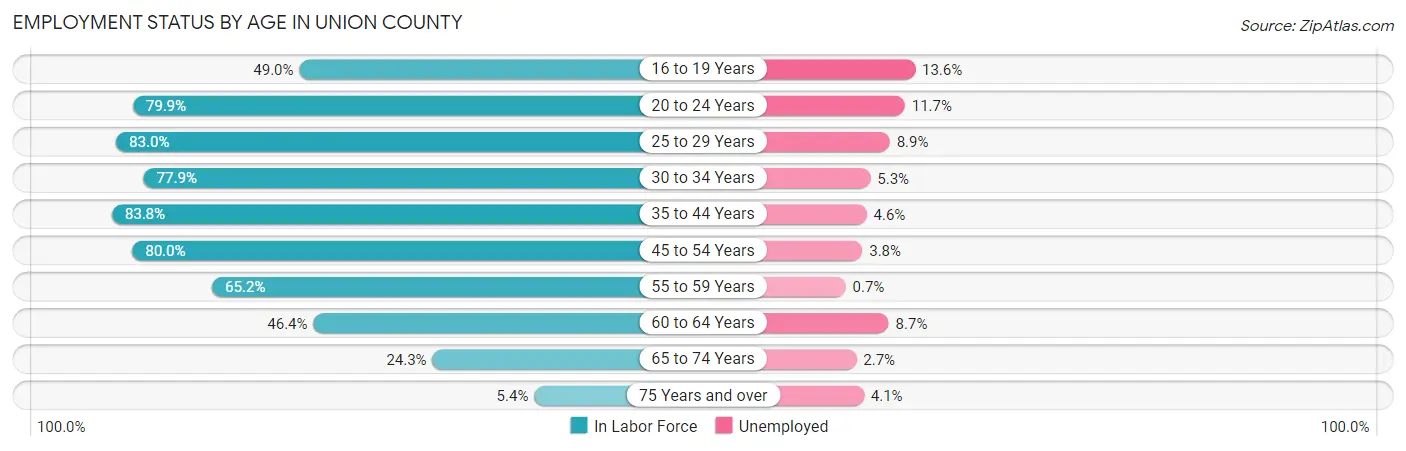
| Age Bracket | In Labor Force | Unemployed |
| 16 to 19 Years | 681 (49.0%) | 93 (13.6%) |
| 20 to 24 Years | 1,755 (79.9%) | 205 (11.7%) |
| 25 to 29 Years | 1,238 (83.0%) | 110 (8.9%) |
| 30 to 34 Years | 1,193 (77.9%) | 63 (5.3%) |
| 35 to 44 Years | 2,729 (83.8%) | 126 (4.6%) |
| 45 to 54 Years | 2,020 (80.0%) | 77 (3.8%) |
| 55 to 59 Years | 913 (65.2%) | 6 (0.7%) |
| 60 to 64 Years | 884 (46.4%) | 77 (8.7%) |
| 65 to 74 Years | 780 (24.3%) | 21 (2.7%) |
| 75 Years and over | 123 (5.4%) | 5 (4.1%) |
| Total | 12,327 (58.2%) | 777 (6.3%) |
Employment Status by Educational Attainment in Union County
According to labor force statistics for Union County, 74.1% of individuals (8,976) out of the total population between 25 and 64 years of age (12,113) are in the labor force, with 5.1% or 458 of them being unemployed. The group with the highest labor force participation rate are those with the educational attainment of bachelor's degree or higher, with 82.5% or 2,446 individuals in the labor force. Within the labor force, individuals with less than high school education have the highest percentage of unemployment, with 13.0% or 54 of them being unemployed.
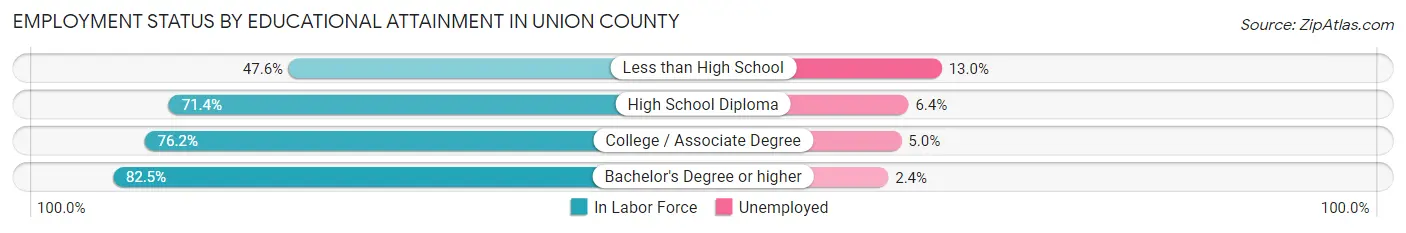
| Educational Attainment | In Labor Force | Unemployed |
| Less than High School | 416 (47.6%) | 114 (13.0%) |
| High School Diploma | 2,772 (71.4%) | 248 (6.4%) |
| College / Associate Degree | 3,347 (76.2%) | 220 (5.0%) |
| Bachelor's Degree or higher | 2,446 (82.5%) | 71 (2.4%) |
| Total | 8,976 (74.1%) | 618 (5.1%) |
Employment Occupations by Sex in Union County
Management, Business, Science and Arts Occupations
The most common Management, Business, Science and Arts occupations in Union County are Community & Social Service (1,222 | 10.6%), Management (1,001 | 8.7%), Education Instruction & Library (711 | 6.2%), Health Diagnosing & Treating (623 | 5.4%), and Computers, Engineering & Science (495 | 4.3%).
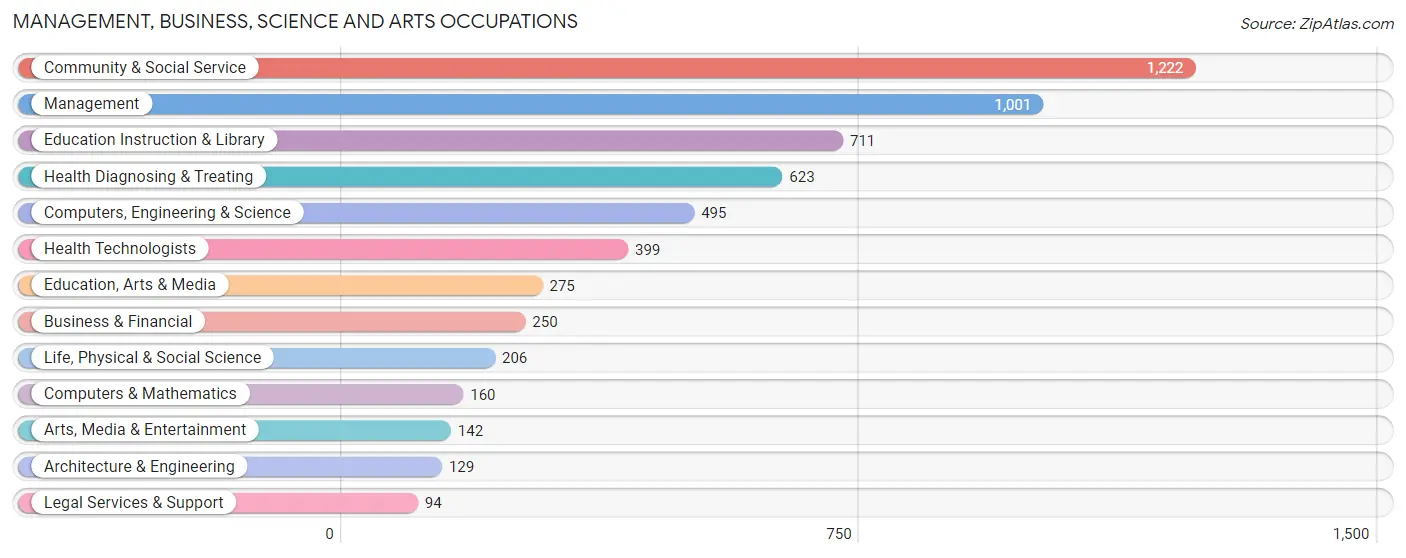
Management, Business, Science and Arts Occupations by Sex
Within the Management, Business, Science and Arts occupations in Union County, the most male-oriented occupations are Architecture & Engineering (87.6%), Computers, Engineering & Science (72.7%), and Computers & Mathematics (71.9%), while the most female-oriented occupations are Health Diagnosing & Treating (74.6%), Legal Services & Support (71.3%), and Education Instruction & Library (69.2%).
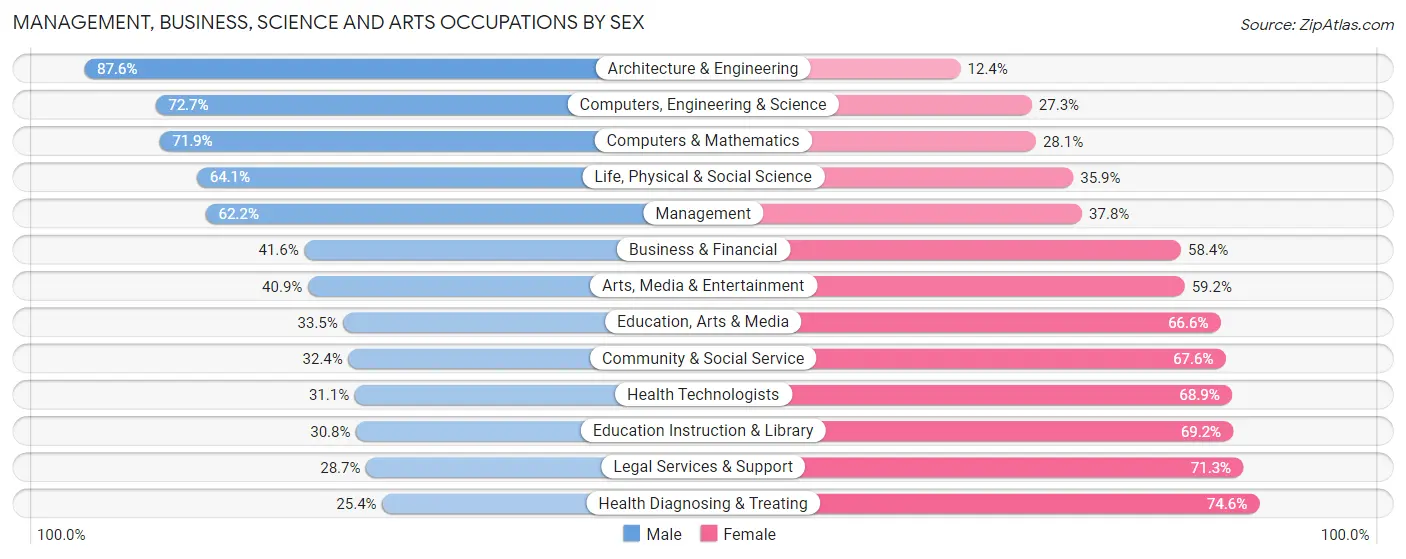
| Occupation | Male | Female |
| Management | 623 (62.2%) | 378 (37.8%) |
| Business & Financial | 104 (41.6%) | 146 (58.4%) |
| Computers, Engineering & Science | 360 (72.7%) | 135 (27.3%) |
| Computers & Mathematics | 115 (71.9%) | 45 (28.1%) |
| Architecture & Engineering | 113 (87.6%) | 16 (12.4%) |
| Life, Physical & Social Science | 132 (64.1%) | 74 (35.9%) |
| Community & Social Service | 396 (32.4%) | 826 (67.6%) |
| Education, Arts & Media | 92 (33.5%) | 183 (66.5%) |
| Legal Services & Support | 27 (28.7%) | 67 (71.3%) |
| Education Instruction & Library | 219 (30.8%) | 492 (69.2%) |
| Arts, Media & Entertainment | 58 (40.8%) | 84 (59.2%) |
| Health Diagnosing & Treating | 158 (25.4%) | 465 (74.6%) |
| Health Technologists | 124 (31.1%) | 275 (68.9%) |
| Total (Category) | 1,641 (45.7%) | 1,950 (54.3%) |
| Total (Overall) | 6,195 (53.8%) | 5,313 (46.2%) |
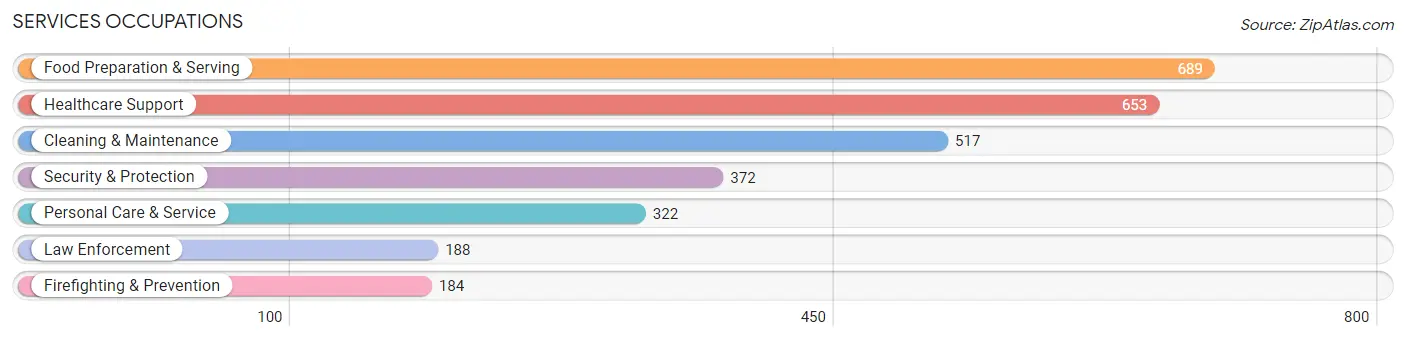
Services Occupations
The most common Services occupations in Union County are Food Preparation & Serving (689 | 6.0%), Healthcare Support (653 | 5.7%), Cleaning & Maintenance (517 | 4.5%), Security & Protection (372 | 3.2%), and Personal Care & Service (322 | 2.8%).
Services Occupations by Sex
Within the Services occupations in Union County, the most male-oriented occupations are Firefighting & Prevention (85.9%), Security & Protection (84.7%), and Law Enforcement (83.5%), while the most female-oriented occupations are Personal Care & Service (88.5%), Healthcare Support (81.5%), and Food Preparation & Serving (68.4%).
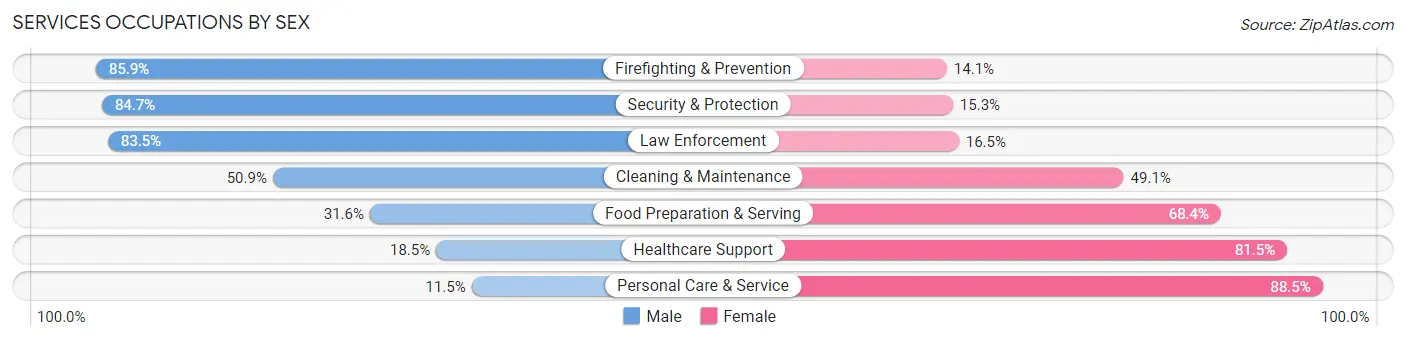
| Occupation | Male | Female |
| Healthcare Support | 121 (18.5%) | 532 (81.5%) |
| Security & Protection | 315 (84.7%) | 57 (15.3%) |
| Firefighting & Prevention | 158 (85.9%) | 26 (14.1%) |
| Law Enforcement | 157 (83.5%) | 31 (16.5%) |
| Food Preparation & Serving | 218 (31.6%) | 471 (68.4%) |
| Cleaning & Maintenance | 263 (50.9%) | 254 (49.1%) |
| Personal Care & Service | 37 (11.5%) | 285 (88.5%) |
| Total (Category) | 954 (37.4%) | 1,599 (62.6%) |
| Total (Overall) | 6,195 (53.8%) | 5,313 (46.2%) |
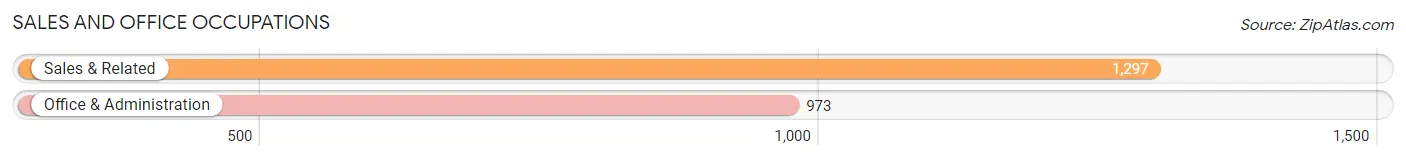
Sales and Office Occupations
The most common Sales and Office occupations in Union County are Sales & Related (1,297 | 11.3%), and Office & Administration (973 | 8.5%).
Sales and Office Occupations by Sex
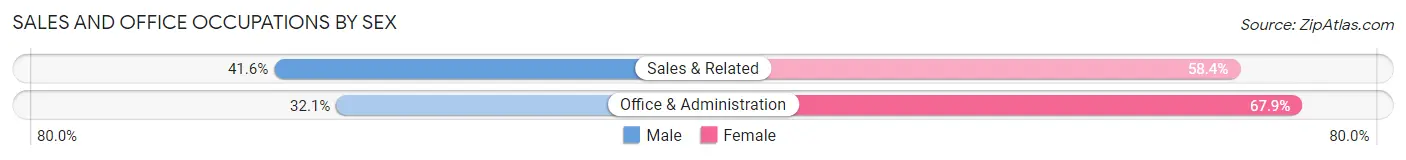
| Occupation | Male | Female |
| Sales & Related | 540 (41.6%) | 757 (58.4%) |
| Office & Administration | 312 (32.1%) | 661 (67.9%) |
| Total (Category) | 852 (37.5%) | 1,418 (62.5%) |
| Total (Overall) | 6,195 (53.8%) | 5,313 (46.2%) |
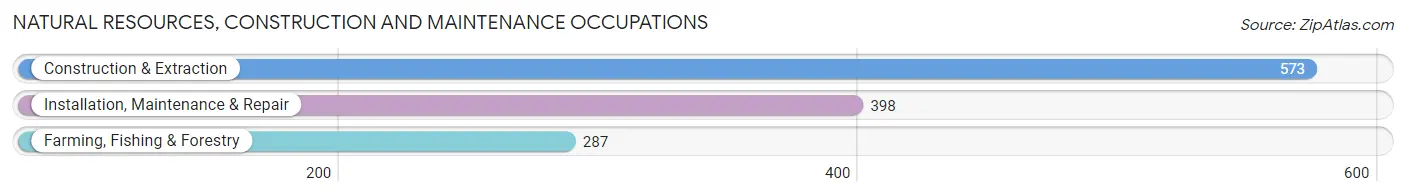
Natural Resources, Construction and Maintenance Occupations
The most common Natural Resources, Construction and Maintenance occupations in Union County are Construction & Extraction (573 | 5.0%), Installation, Maintenance & Repair (398 | 3.5%), and Farming, Fishing & Forestry (287 | 2.5%).
Natural Resources, Construction and Maintenance Occupations by Sex
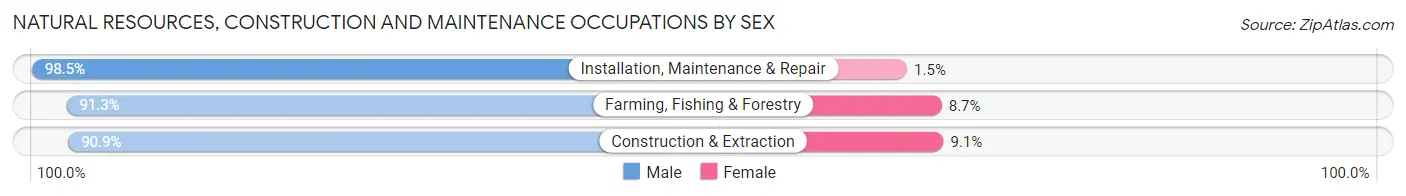
| Occupation | Male | Female |
| Farming, Fishing & Forestry | 262 (91.3%) | 25 (8.7%) |
| Construction & Extraction | 521 (90.9%) | 52 (9.1%) |
| Installation, Maintenance & Repair | 392 (98.5%) | 6 (1.5%) |
| Total (Category) | 1,175 (93.4%) | 83 (6.6%) |
| Total (Overall) | 6,195 (53.8%) | 5,313 (46.2%) |
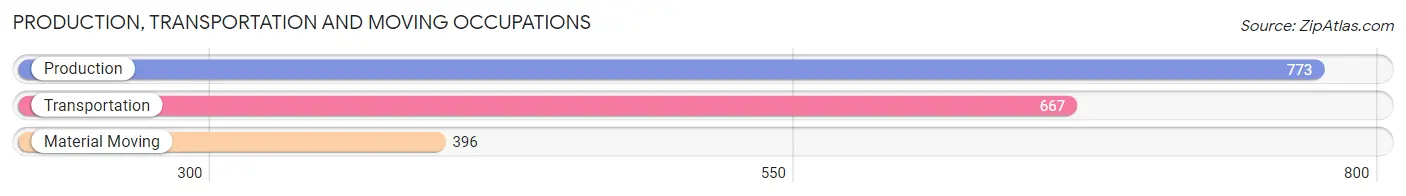
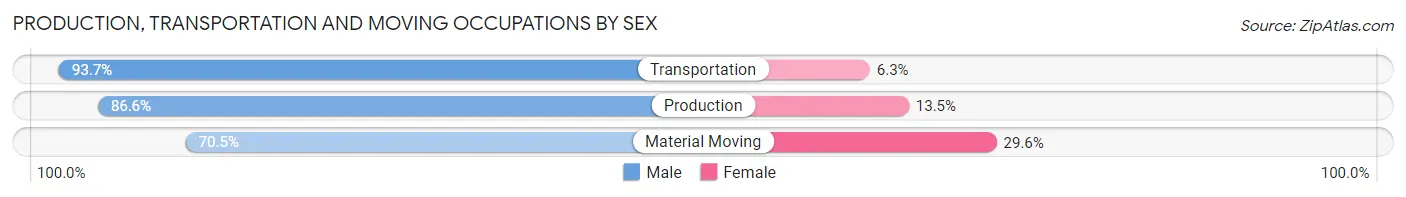
Production, Transportation and Moving Occupations
The most common Production, Transportation and Moving occupations in Union County are Production (773 | 6.7%), Transportation (667 | 5.8%), and Material Moving (396 | 3.4%).
Production, Transportation and Moving Occupations by Sex
| Occupation | Male | Female |
| Production | 669 (86.6%) | 104 (13.5%) |
| Transportation | 625 (93.7%) | 42 (6.3%) |
| Material Moving | 279 (70.5%) | 117 (29.5%) |
| Total (Category) | 1,573 (85.7%) | 263 (14.3%) |
| Total (Overall) | 6,195 (53.8%) | 5,313 (46.2%) |
Employment Industries by Sex in Union County
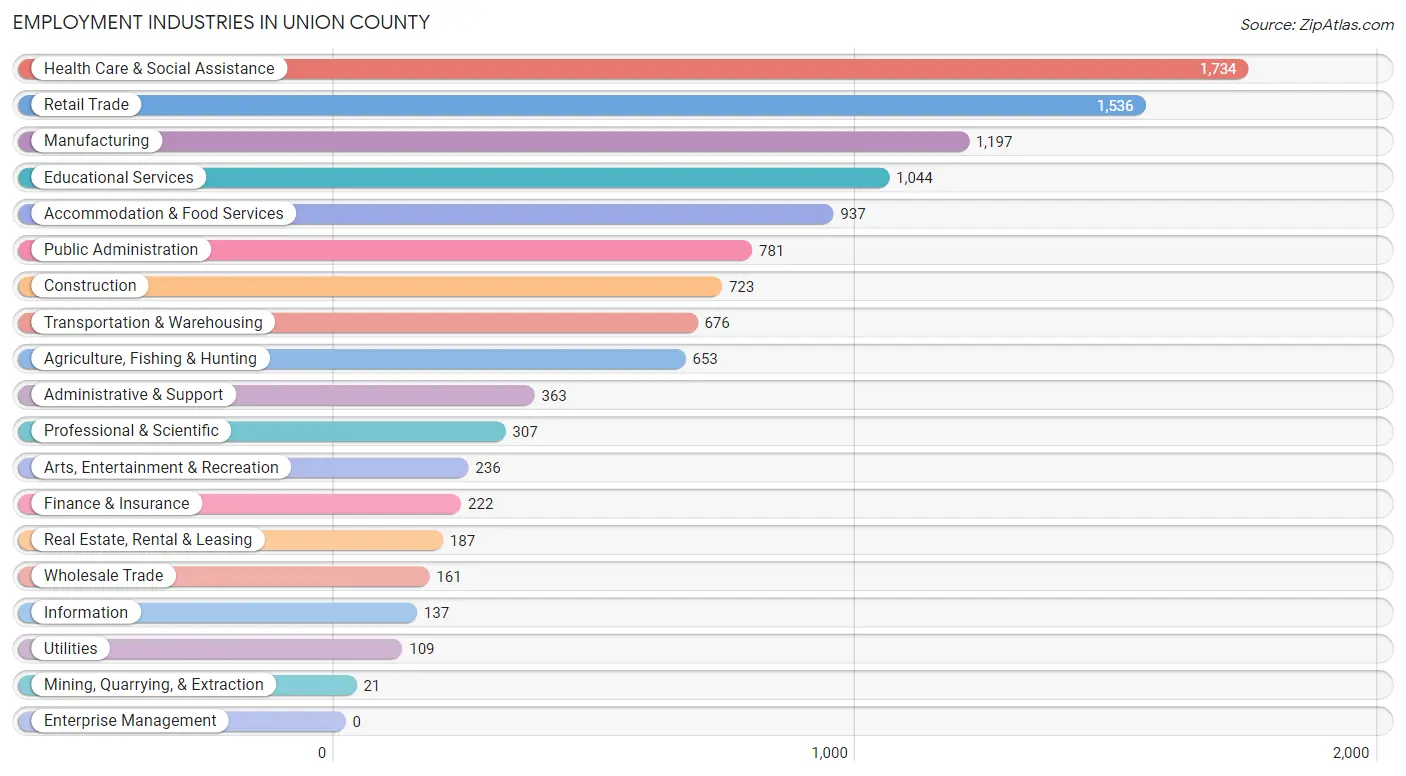
Employment Industries in Union County
The major employment industries in Union County include Health Care & Social Assistance (1,734 | 15.1%), Retail Trade (1,536 | 13.4%), Manufacturing (1,197 | 10.4%), Educational Services (1,044 | 9.1%), and Accommodation & Food Services (937 | 8.1%).
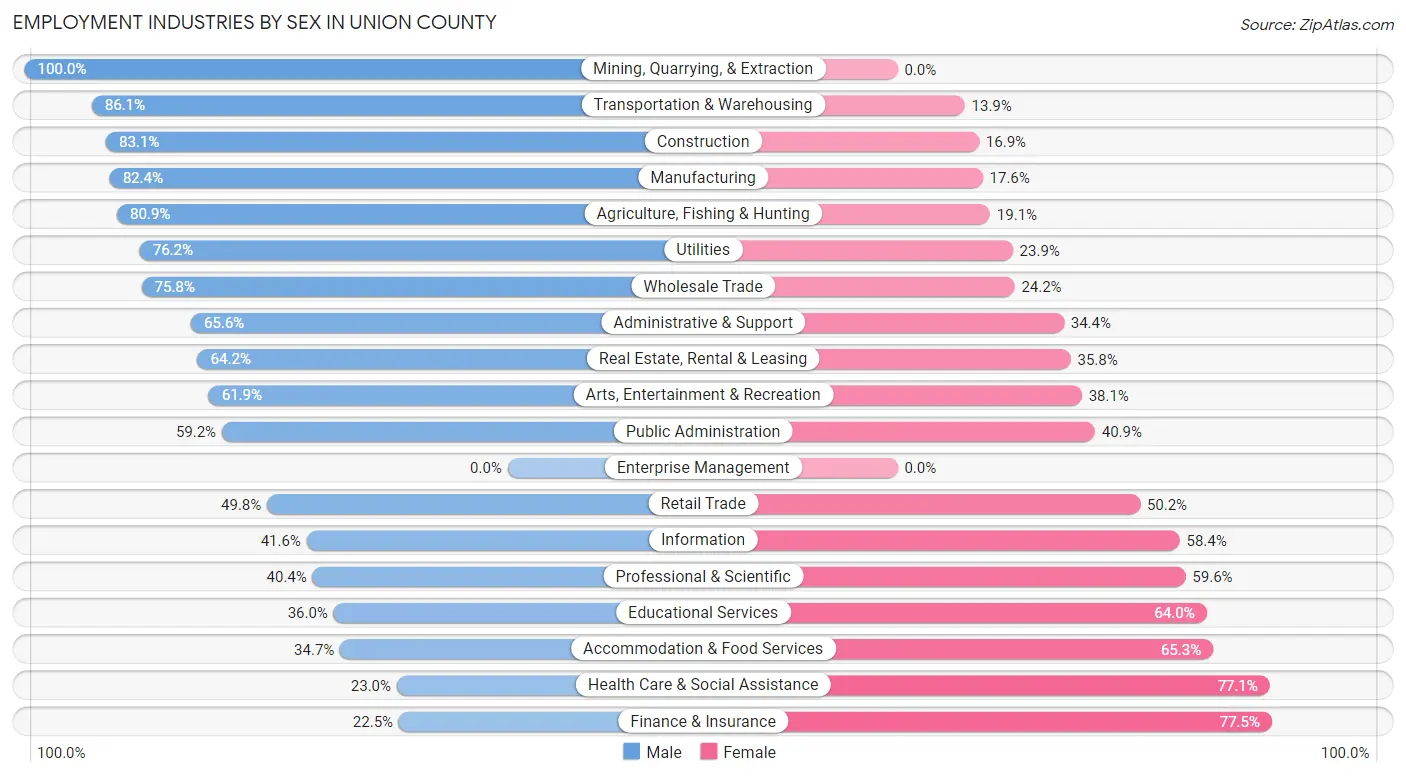
Employment Industries by Sex in Union County
The Union County industries that see more men than women are Mining, Quarrying, & Extraction (100.0%), Transportation & Warehousing (86.1%), and Construction (83.1%), whereas the industries that tend to have a higher number of women are Finance & Insurance (77.5%), Health Care & Social Assistance (77.0%), and Accommodation & Food Services (65.3%).
| Industry | Male | Female |
| Agriculture, Fishing & Hunting | 528 (80.9%) | 125 (19.1%) |
| Mining, Quarrying, & Extraction | 21 (100.0%) | 0 (0.0%) |
| Construction | 601 (83.1%) | 122 (16.9%) |
| Manufacturing | 986 (82.4%) | 211 (17.6%) |
| Wholesale Trade | 122 (75.8%) | 39 (24.2%) |
| Retail Trade | 765 (49.8%) | 771 (50.2%) |
| Transportation & Warehousing | 582 (86.1%) | 94 (13.9%) |
| Utilities | 83 (76.1%) | 26 (23.8%) |
| Information | 57 (41.6%) | 80 (58.4%) |
| Finance & Insurance | 50 (22.5%) | 172 (77.5%) |
| Real Estate, Rental & Leasing | 120 (64.2%) | 67 (35.8%) |
| Professional & Scientific | 124 (40.4%) | 183 (59.6%) |
| Enterprise Management | 0 (0.0%) | 0 (0.0%) |
| Administrative & Support | 238 (65.6%) | 125 (34.4%) |
| Educational Services | 376 (36.0%) | 668 (64.0%) |
| Health Care & Social Assistance | 398 (23.0%) | 1,336 (77.0%) |
| Arts, Entertainment & Recreation | 146 (61.9%) | 90 (38.1%) |
| Accommodation & Food Services | 325 (34.7%) | 612 (65.3%) |
| Public Administration | 462 (59.2%) | 319 (40.8%) |
| Total | 6,195 (53.8%) | 5,313 (46.2%) |
Education in Union County
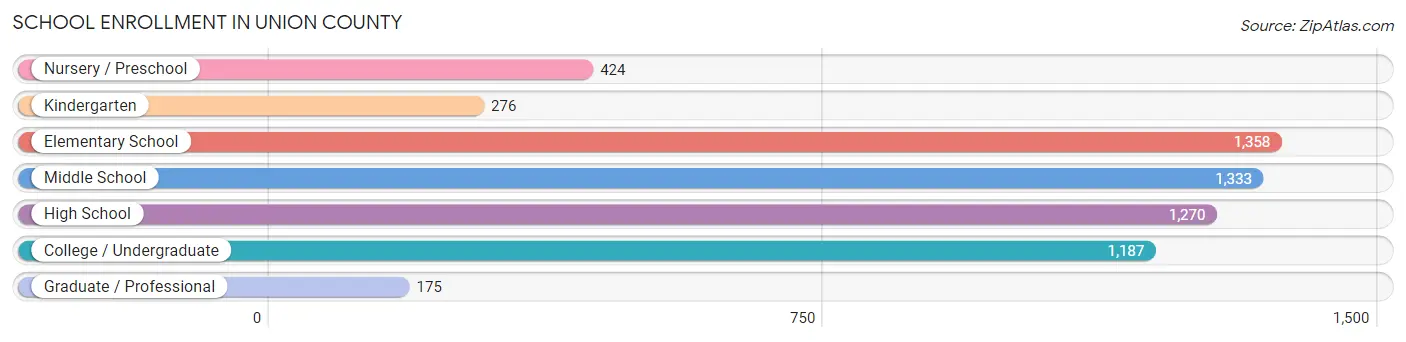
School Enrollment in Union County
The most common levels of schooling among the 6,023 students in Union County are elementary school (1,358 | 22.6%), middle school (1,333 | 22.1%), and high school (1,270 | 21.1%).
| School Level | # Students | % Students |
| Nursery / Preschool | 424 | 7.0% |
| Kindergarten | 276 | 4.6% |
| Elementary School | 1,358 | 22.6% |
| Middle School | 1,333 | 22.1% |
| High School | 1,270 | 21.1% |
| College / Undergraduate | 1,187 | 19.7% |
| Graduate / Professional | 175 | 2.9% |
| Total | 6,023 | 100.0% |
School Enrollment by Age by Funding Source in Union County
Out of a total of 6,023 students who are enrolled in schools in Union County, 1,156 (19.2%) attend a private institution, while the remaining 4,867 (80.8%) are enrolled in public schools. The age group of 3 to 4 year olds has the highest likelihood of being enrolled in private schools, with 95 (51.9% in the age bracket) enrolled. Conversely, the age group of 35 years and over has the lowest likelihood of being enrolled in a private school, with 217 (95.6% in the age bracket) attending a public institution.
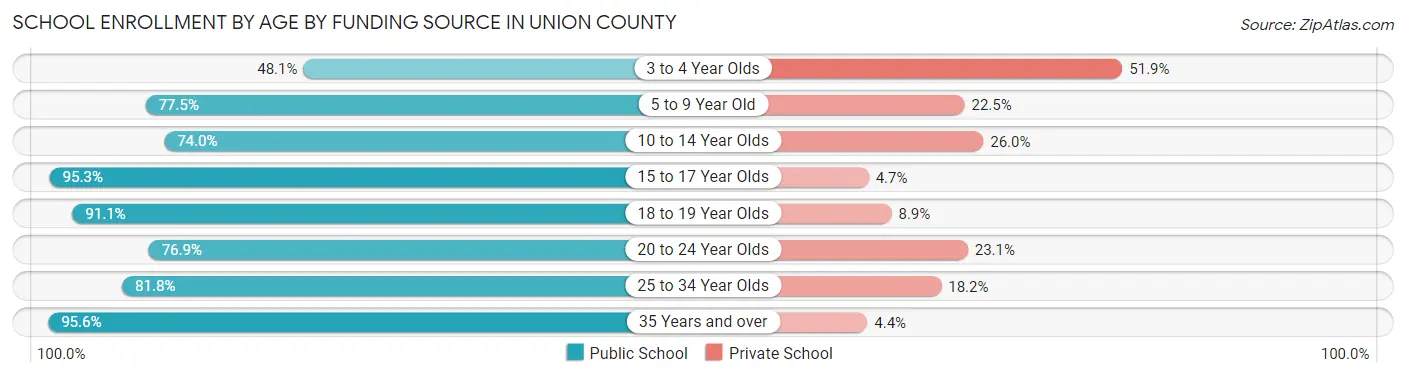
| Age Bracket | Public School | Private School |
| 3 to 4 Year Olds | 88 (48.1%) | 95 (51.9%) |
| 5 to 9 Year Old | 1,328 (77.5%) | 386 (22.5%) |
| 10 to 14 Year Olds | 1,132 (74.0%) | 398 (26.0%) |
| 15 to 17 Year Olds | 1,040 (95.3%) | 51 (4.7%) |
| 18 to 19 Year Olds | 470 (91.1%) | 46 (8.9%) |
| 20 to 24 Year Olds | 459 (76.9%) | 138 (23.1%) |
| 25 to 34 Year Olds | 135 (81.8%) | 30 (18.2%) |
| 35 Years and over | 217 (95.6%) | 10 (4.4%) |
| Total | 4,867 (80.8%) | 1,156 (19.2%) |
Educational Attainment by Field of Study in Union County
Bio, nature & agricultural (838 | 18.2%), education (717 | 15.5%), business (556 | 12.0%), science & technology (497 | 10.8%), and liberal arts & history (400 | 8.7%) are the most common fields of study among 4,614 individuals in Union County who have obtained a bachelor's degree or higher.
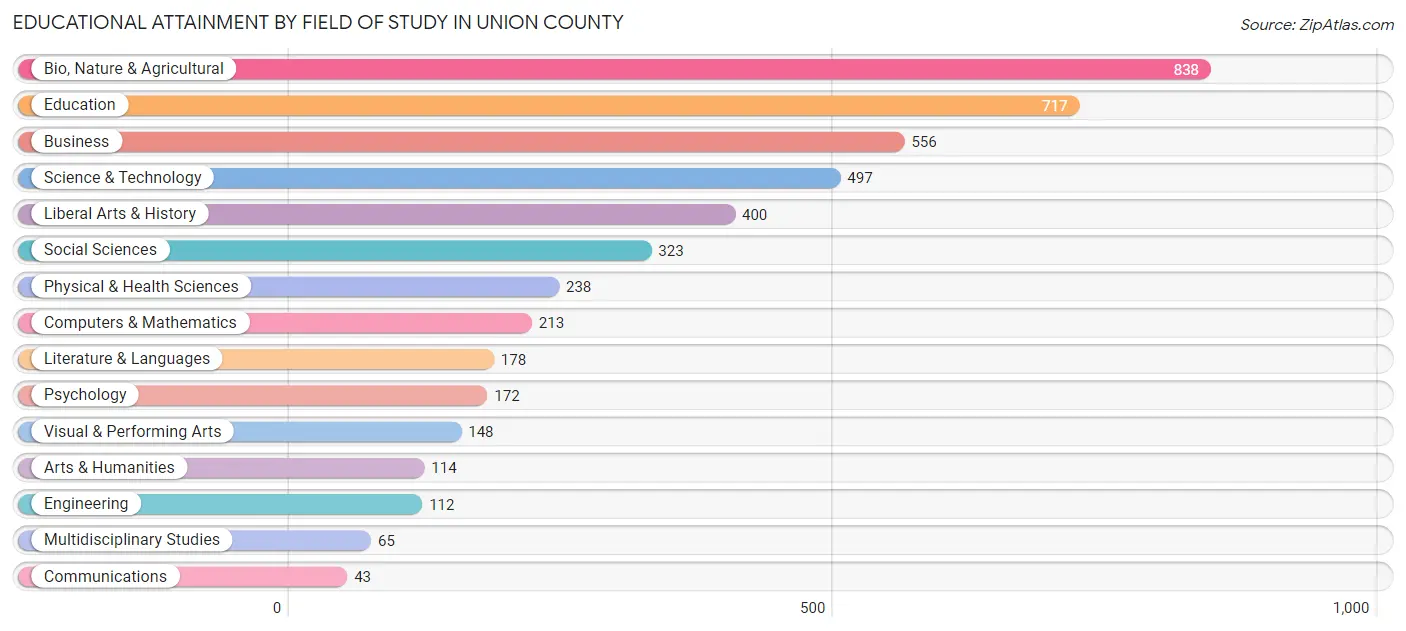
| Field of Study | # Graduates | % Graduates |
| Computers & Mathematics | 213 | 4.6% |
| Bio, Nature & Agricultural | 838 | 18.2% |
| Physical & Health Sciences | 238 | 5.2% |
| Psychology | 172 | 3.7% |
| Social Sciences | 323 | 7.0% |
| Engineering | 112 | 2.4% |
| Multidisciplinary Studies | 65 | 1.4% |
| Science & Technology | 497 | 10.8% |
| Business | 556 | 12.0% |
| Education | 717 | 15.5% |
| Literature & Languages | 178 | 3.9% |
| Liberal Arts & History | 400 | 8.7% |
| Visual & Performing Arts | 148 | 3.2% |
| Communications | 43 | 0.9% |
| Arts & Humanities | 114 | 2.5% |
| Total | 4,614 | 100.0% |
Transportation & Commute in Union County
Vehicle Availability by Sex in Union County
The most prevalent vehicle ownership categories in Union County are males with 2 vehicles (2,404, accounting for 39.7%) and females with 2 vehicles (1,910, making up 46.9%).
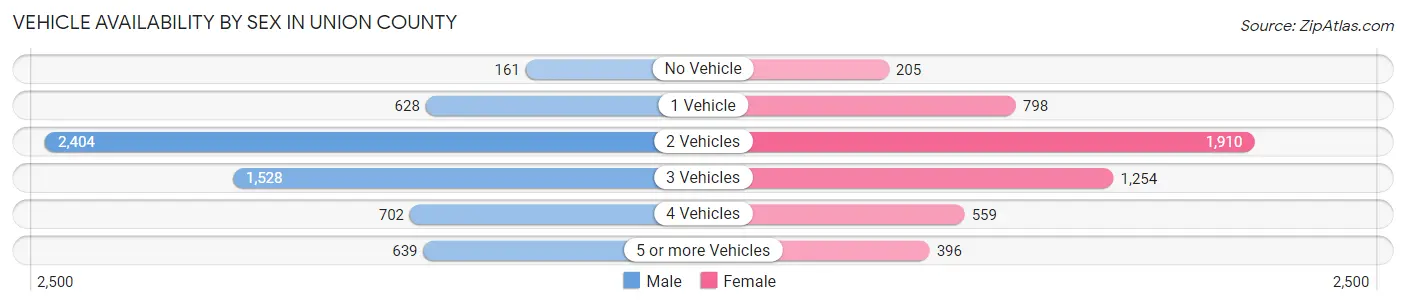
| Vehicles Available | Male | Female |
| No Vehicle | 161 (2.7%) | 205 (4.0%) |
| 1 Vehicle | 628 (10.4%) | 798 (15.6%) |
| 2 Vehicles | 2,404 (39.7%) | 1,910 (37.3%) |
| 3 Vehicles | 1,528 (25.2%) | 1,254 (24.5%) |
| 4 Vehicles | 702 (11.6%) | 559 (10.9%) |
| 5 or more Vehicles | 639 (10.5%) | 396 (7.7%) |
| Total | 6,062 (100.0%) | 5,122 (100.0%) |
Commute Time in Union County
The most frequently occuring commute durations in Union County are 5 to 9 minutes (2,717 commuters, 25.9%), 10 to 14 minutes (2,402 commuters, 22.9%), and less than 5 minutes (1,188 commuters, 11.3%).
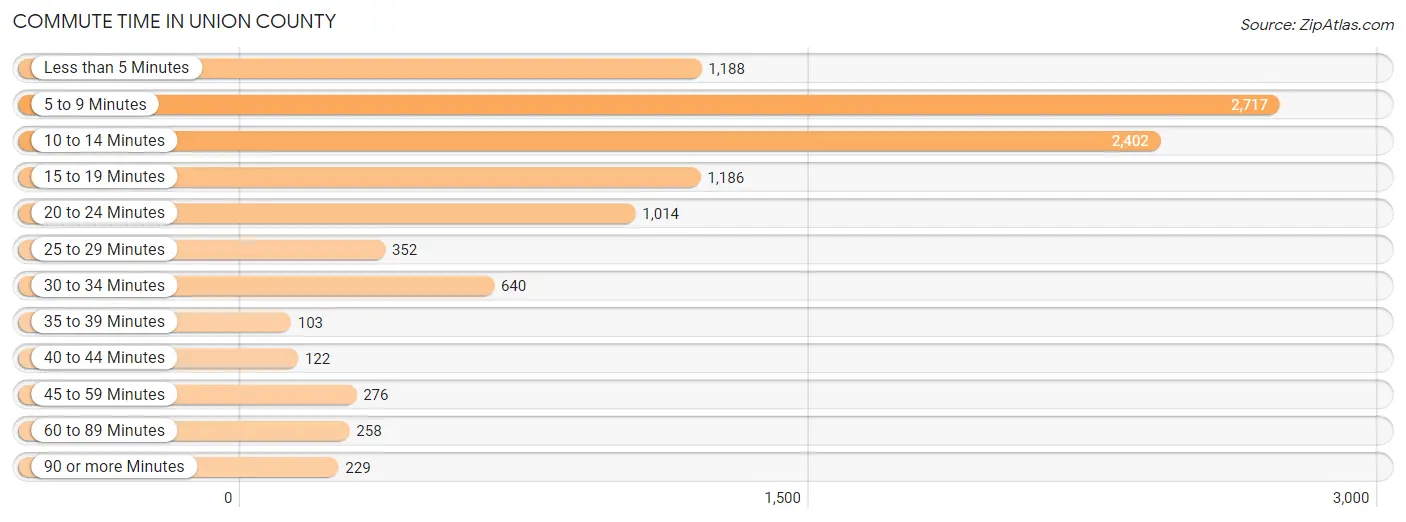
| Commute Time | # Commuters | % Commuters |
| Less than 5 Minutes | 1,188 | 11.3% |
| 5 to 9 Minutes | 2,717 | 25.9% |
| 10 to 14 Minutes | 2,402 | 22.9% |
| 15 to 19 Minutes | 1,186 | 11.3% |
| 20 to 24 Minutes | 1,014 | 9.7% |
| 25 to 29 Minutes | 352 | 3.4% |
| 30 to 34 Minutes | 640 | 6.1% |
| 35 to 39 Minutes | 103 | 1.0% |
| 40 to 44 Minutes | 122 | 1.2% |
| 45 to 59 Minutes | 276 | 2.6% |
| 60 to 89 Minutes | 258 | 2.5% |
| 90 or more Minutes | 229 | 2.2% |
Commute Time by Sex in Union County
The most common commute times in Union County are 10 to 14 minutes (1,524 commuters, 26.2%) for males and 5 to 9 minutes (1,422 commuters, 30.5%) for females.
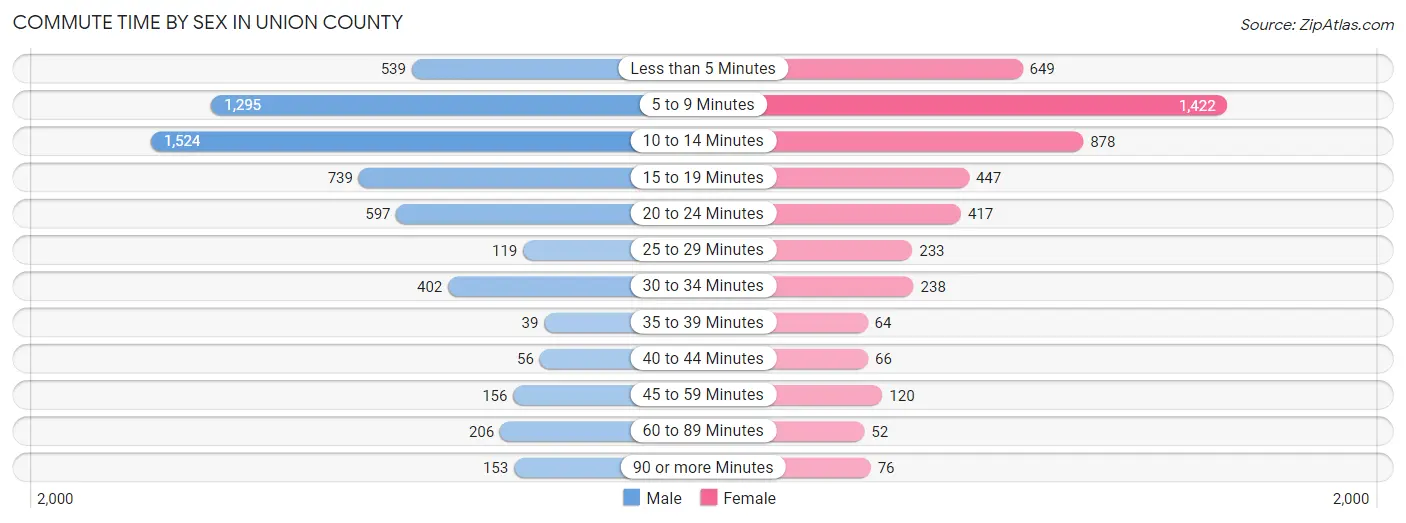
| Commute Time | Male | Female |
| Less than 5 Minutes | 539 (9.2%) | 649 (13.9%) |
| 5 to 9 Minutes | 1,295 (22.2%) | 1,422 (30.5%) |
| 10 to 14 Minutes | 1,524 (26.2%) | 878 (18.8%) |
| 15 to 19 Minutes | 739 (12.7%) | 447 (9.6%) |
| 20 to 24 Minutes | 597 (10.2%) | 417 (8.9%) |
| 25 to 29 Minutes | 119 (2.0%) | 233 (5.0%) |
| 30 to 34 Minutes | 402 (6.9%) | 238 (5.1%) |
| 35 to 39 Minutes | 39 (0.7%) | 64 (1.4%) |
| 40 to 44 Minutes | 56 (1.0%) | 66 (1.4%) |
| 45 to 59 Minutes | 156 (2.7%) | 120 (2.6%) |
| 60 to 89 Minutes | 206 (3.5%) | 52 (1.1%) |
| 90 or more Minutes | 153 (2.6%) | 76 (1.6%) |
Time of Departure to Work by Sex in Union County
The most frequent times of departure to work in Union County are 7:00 AM to 7:29 AM (815, 14.0%) for males and 7:30 AM to 7:59 AM (791, 17.0%) for females.
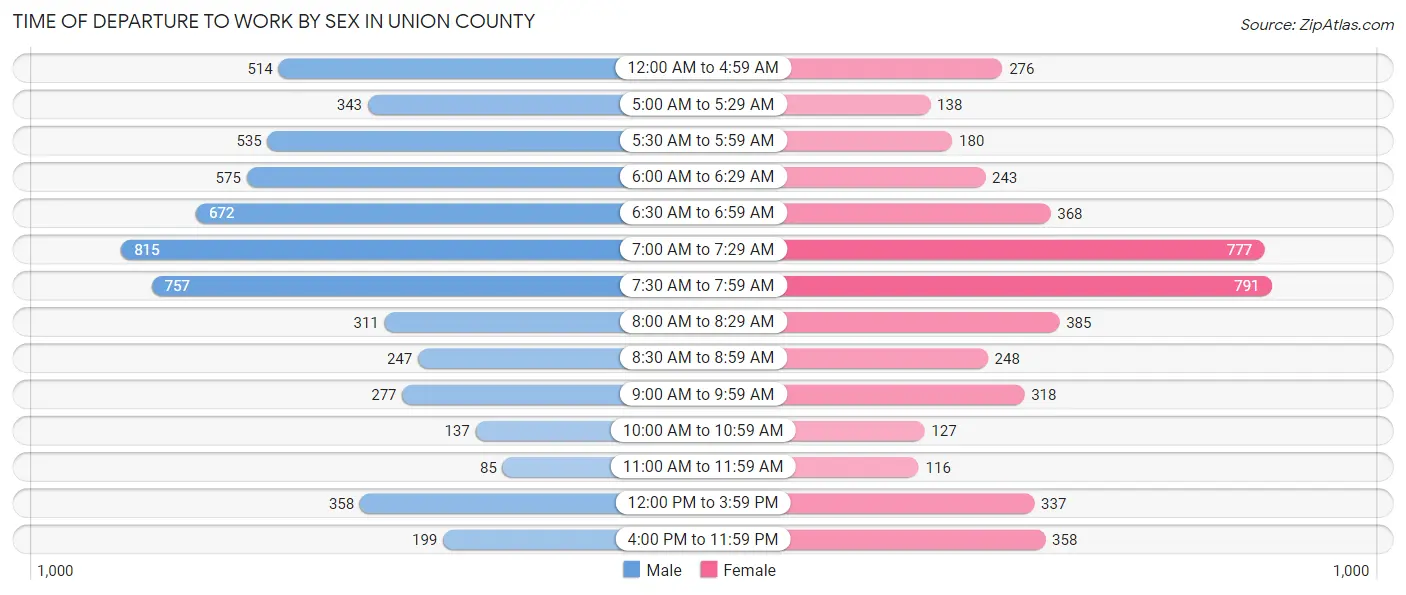
| Time of Departure | Male | Female |
| 12:00 AM to 4:59 AM | 514 (8.8%) | 276 (5.9%) |
| 5:00 AM to 5:29 AM | 343 (5.9%) | 138 (3.0%) |
| 5:30 AM to 5:59 AM | 535 (9.2%) | 180 (3.9%) |
| 6:00 AM to 6:29 AM | 575 (9.9%) | 243 (5.2%) |
| 6:30 AM to 6:59 AM | 672 (11.5%) | 368 (7.9%) |
| 7:00 AM to 7:29 AM | 815 (14.0%) | 777 (16.7%) |
| 7:30 AM to 7:59 AM | 757 (13.0%) | 791 (17.0%) |
| 8:00 AM to 8:29 AM | 311 (5.3%) | 385 (8.3%) |
| 8:30 AM to 8:59 AM | 247 (4.2%) | 248 (5.3%) |
| 9:00 AM to 9:59 AM | 277 (4.8%) | 318 (6.8%) |
| 10:00 AM to 10:59 AM | 137 (2.4%) | 127 (2.7%) |
| 11:00 AM to 11:59 AM | 85 (1.5%) | 116 (2.5%) |
| 12:00 PM to 3:59 PM | 358 (6.1%) | 337 (7.2%) |
| 4:00 PM to 11:59 PM | 199 (3.4%) | 358 (7.7%) |
| Total | 5,825 (100.0%) | 4,662 (100.0%) |
Housing Occupancy in Union County
Occupancy by Ownership in Union County
Of the total 10,700 dwellings in Union County, owner-occupied units account for 7,127 (66.6%), while renter-occupied units make up 3,573 (33.4%).
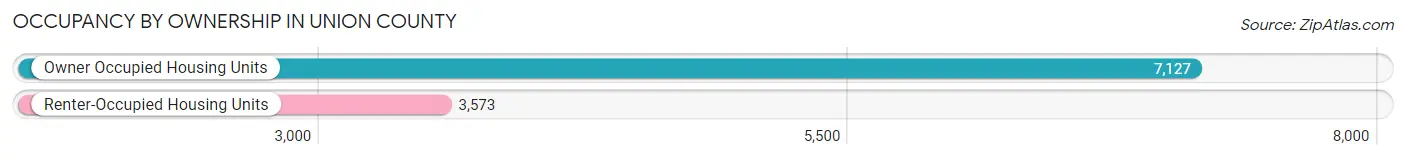
| Occupancy | # Housing Units | % Housing Units |
| Owner Occupied Housing Units | 7,127 | 66.6% |
| Renter-Occupied Housing Units | 3,573 | 33.4% |
| Total Occupied Housing Units | 10,700 | 100.0% |
Occupancy by Household Size in Union County
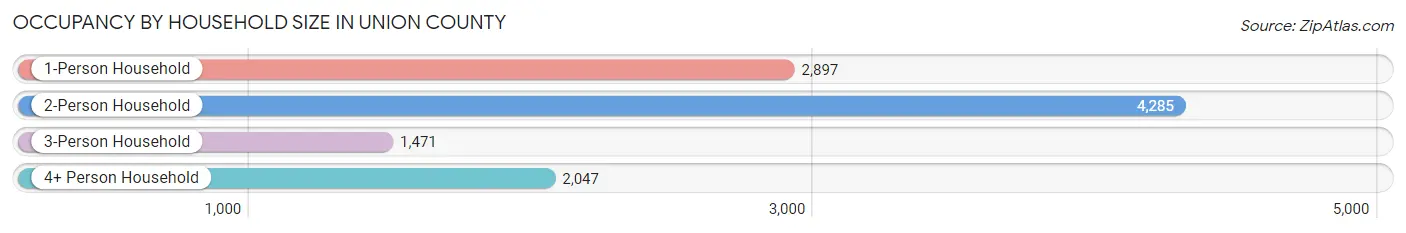
| Household Size | # Housing Units | % Housing Units |
| 1-Person Household | 2,897 | 27.1% |
| 2-Person Household | 4,285 | 40.1% |
| 3-Person Household | 1,471 | 13.8% |
| 4+ Person Household | 2,047 | 19.1% |
| Total Housing Units | 10,700 | 100.0% |
Occupancy by Ownership by Household Size in Union County
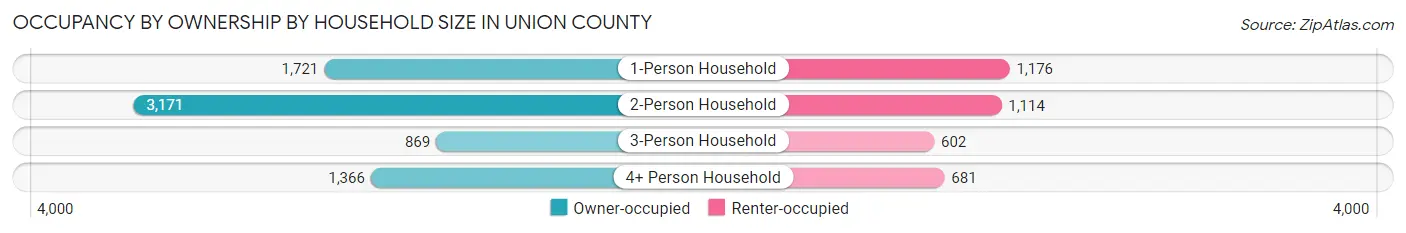
| Household Size | Owner-occupied | Renter-occupied |
| 1-Person Household | 1,721 (59.4%) | 1,176 (40.6%) |
| 2-Person Household | 3,171 (74.0%) | 1,114 (26.0%) |
| 3-Person Household | 869 (59.1%) | 602 (40.9%) |
| 4+ Person Household | 1,366 (66.7%) | 681 (33.3%) |
| Total Housing Units | 7,127 (66.6%) | 3,573 (33.4%) |
Occupancy by Educational Attainment in Union County
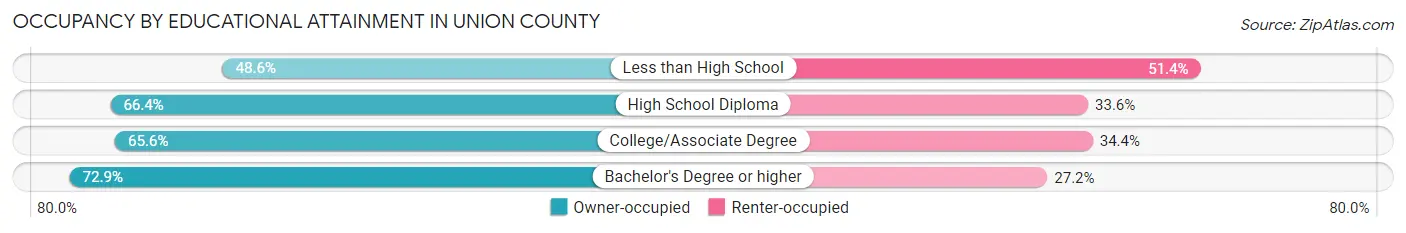
| Household Size | Owner-occupied | Renter-occupied |
| Less than High School | 359 (48.6%) | 380 (51.4%) |
| High School Diploma | 2,055 (66.4%) | 1,041 (33.6%) |
| College/Associate Degree | 2,625 (65.6%) | 1,374 (34.4%) |
| Bachelor's Degree or higher | 2,088 (72.9%) | 778 (27.2%) |
Occupancy by Age of Householder in Union County
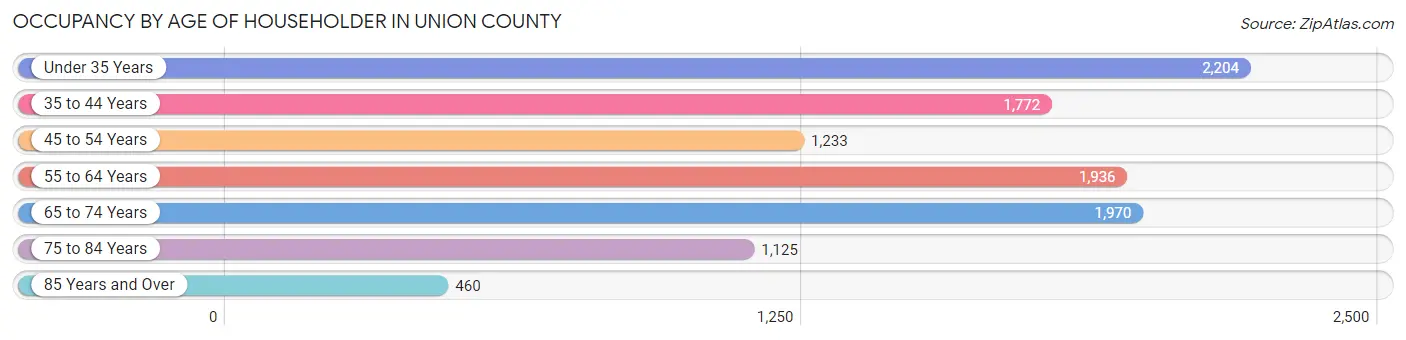
| Age Bracket | # Households | % Households |
| Under 35 Years | 2,204 | 20.6% |
| 35 to 44 Years | 1,772 | 16.6% |
| 45 to 54 Years | 1,233 | 11.5% |
| 55 to 64 Years | 1,936 | 18.1% |
| 65 to 74 Years | 1,970 | 18.4% |
| 75 to 84 Years | 1,125 | 10.5% |
| 85 Years and Over | 460 | 4.3% |
| Total | 10,700 | 100.0% |
Housing Finances in Union County
Median Income by Occupancy in Union County
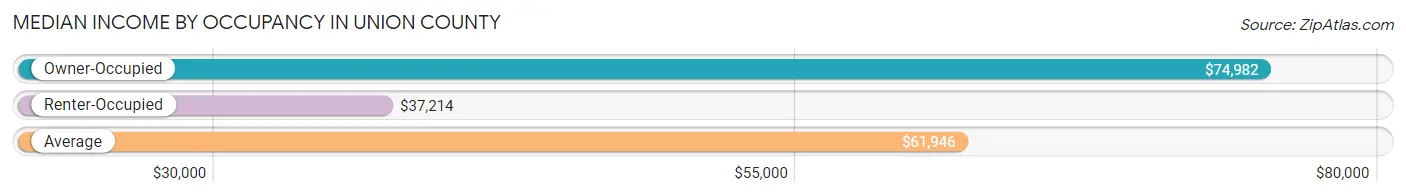
| Occupancy Type | # Households | Median Income |
| Owner-Occupied | 7,127 (66.6%) | $74,982 |
| Renter-Occupied | 3,573 (33.4%) | $37,214 |
| Average | 10,700 (100.0%) | $61,946 |
Occupancy by Householder Income Bracket in Union County
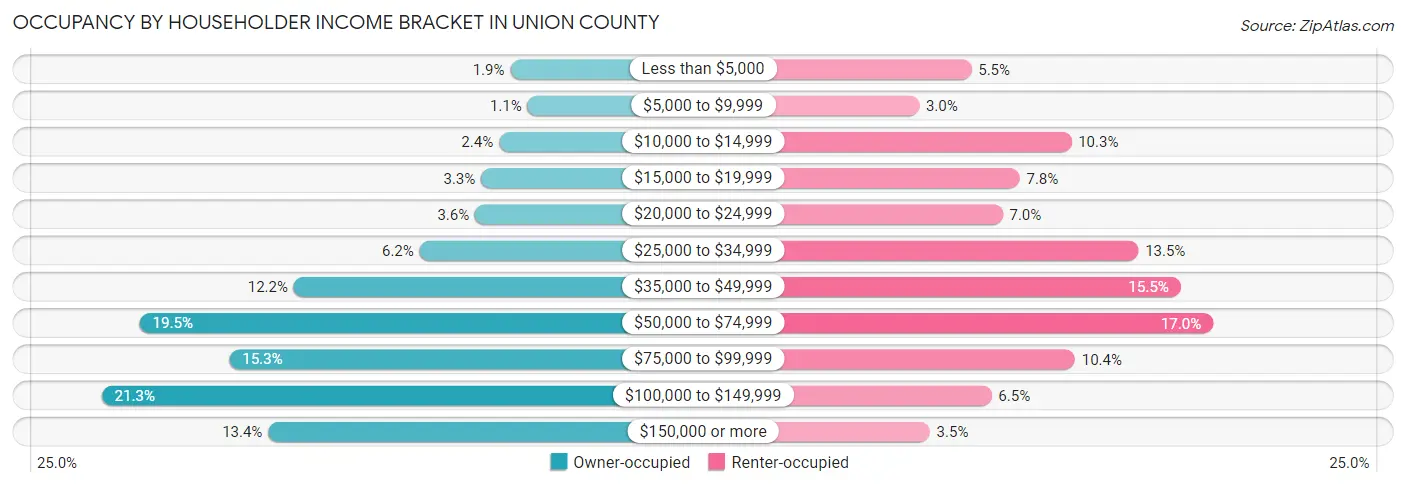
| Income Bracket | Owner-occupied | Renter-occupied |
| Less than $5,000 | 133 (1.9%) | 197 (5.5%) |
| $5,000 to $9,999 | 75 (1.1%) | 108 (3.0%) |
| $10,000 to $14,999 | 172 (2.4%) | 367 (10.3%) |
| $15,000 to $19,999 | 232 (3.3%) | 279 (7.8%) |
| $20,000 to $24,999 | 253 (3.5%) | 250 (7.0%) |
| $25,000 to $34,999 | 441 (6.2%) | 481 (13.5%) |
| $35,000 to $49,999 | 868 (12.2%) | 553 (15.5%) |
| $50,000 to $74,999 | 1,391 (19.5%) | 608 (17.0%) |
| $75,000 to $99,999 | 1,087 (15.2%) | 373 (10.4%) |
| $100,000 to $149,999 | 1,520 (21.3%) | 231 (6.5%) |
| $150,000 or more | 955 (13.4%) | 126 (3.5%) |
| Total | 7,127 (100.0%) | 3,573 (100.0%) |
Monthly Housing Cost Tiers in Union County
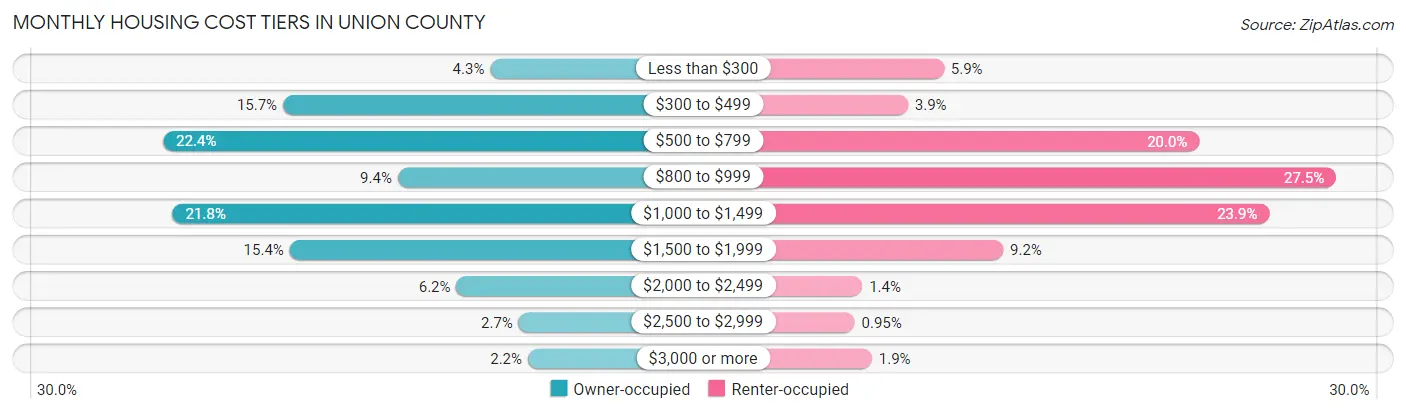
| Monthly Cost | Owner-occupied | Renter-occupied |
| Less than $300 | 305 (4.3%) | 210 (5.9%) |
| $300 to $499 | 1,121 (15.7%) | 139 (3.9%) |
| $500 to $799 | 1,593 (22.4%) | 714 (20.0%) |
| $800 to $999 | 669 (9.4%) | 984 (27.5%) |
| $1,000 to $1,499 | 1,556 (21.8%) | 852 (23.8%) |
| $1,500 to $1,999 | 1,095 (15.4%) | 327 (9.1%) |
| $2,000 to $2,499 | 438 (6.1%) | 49 (1.4%) |
| $2,500 to $2,999 | 193 (2.7%) | 34 (0.9%) |
| $3,000 or more | 157 (2.2%) | 68 (1.9%) |
| Total | 7,127 (100.0%) | 3,573 (100.0%) |
Physical Housing Characteristics in Union County
Housing Structures in Union County
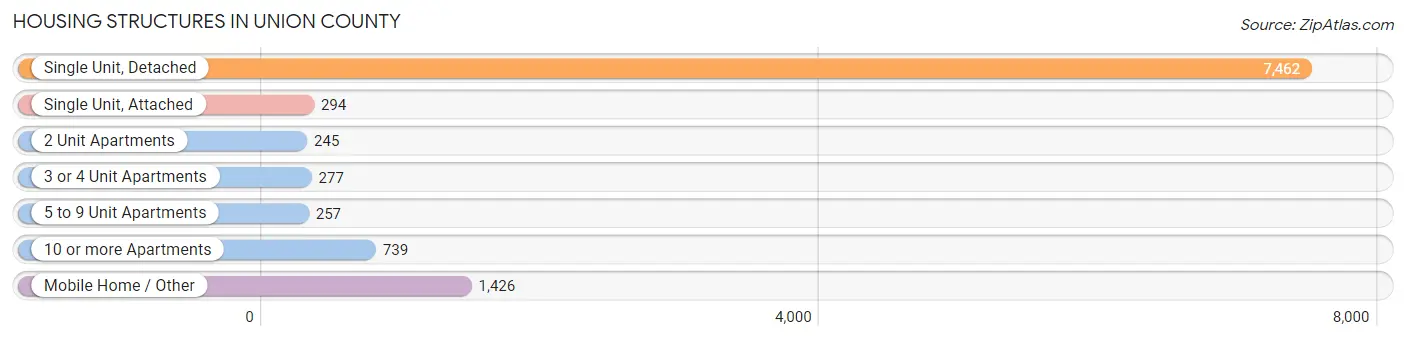
| Structure Type | # Housing Units | % Housing Units |
| Single Unit, Detached | 7,462 | 69.7% |
| Single Unit, Attached | 294 | 2.8% |
| 2 Unit Apartments | 245 | 2.3% |
| 3 or 4 Unit Apartments | 277 | 2.6% |
| 5 to 9 Unit Apartments | 257 | 2.4% |
| 10 or more Apartments | 739 | 6.9% |
| Mobile Home / Other | 1,426 | 13.3% |
| Total | 10,700 | 100.0% |
Housing Structures by Occupancy in Union County
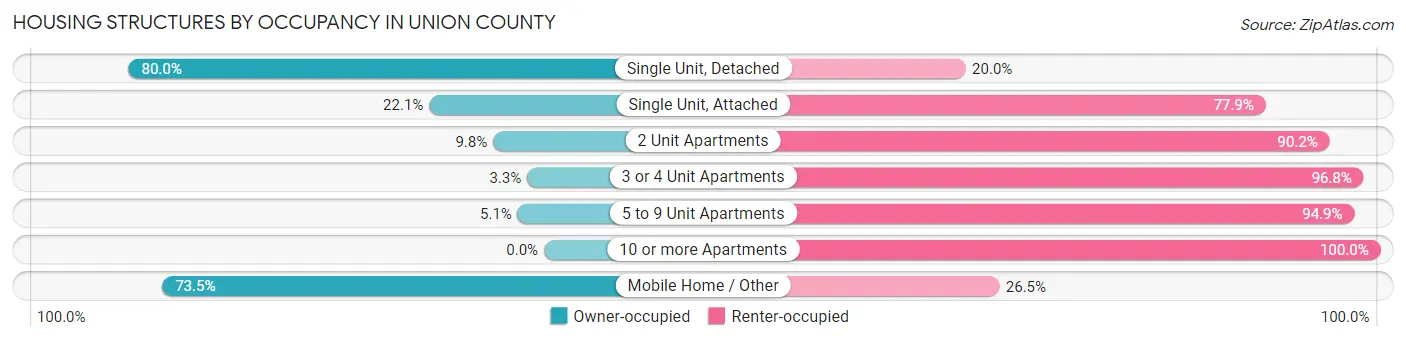
| Structure Type | Owner-occupied | Renter-occupied |
| Single Unit, Detached | 5,968 (80.0%) | 1,494 (20.0%) |
| Single Unit, Attached | 65 (22.1%) | 229 (77.9%) |
| 2 Unit Apartments | 24 (9.8%) | 221 (90.2%) |
| 3 or 4 Unit Apartments | 9 (3.3%) | 268 (96.8%) |
| 5 to 9 Unit Apartments | 13 (5.1%) | 244 (94.9%) |
| 10 or more Apartments | 0 (0.0%) | 739 (100.0%) |
| Mobile Home / Other | 1,048 (73.5%) | 378 (26.5%) |
| Total | 7,127 (66.6%) | 3,573 (33.4%) |
Housing Structures by Number of Rooms in Union County
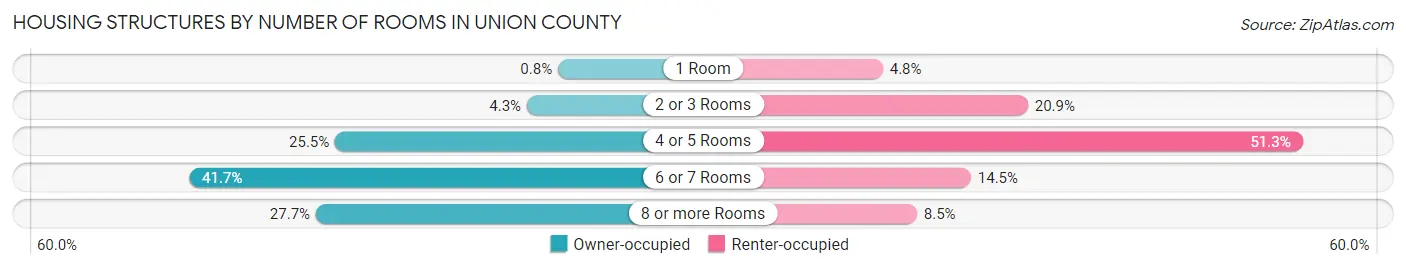
| Number of Rooms | Owner-occupied | Renter-occupied |
| 1 Room | 57 (0.8%) | 170 (4.8%) |
| 2 or 3 Rooms | 303 (4.3%) | 745 (20.8%) |
| 4 or 5 Rooms | 1,820 (25.5%) | 1,834 (51.3%) |
| 6 or 7 Rooms | 2,975 (41.7%) | 519 (14.5%) |
| 8 or more Rooms | 1,972 (27.7%) | 305 (8.5%) |
| Total | 7,127 (100.0%) | 3,573 (100.0%) |
Housing Structure by Heating Type in Union County
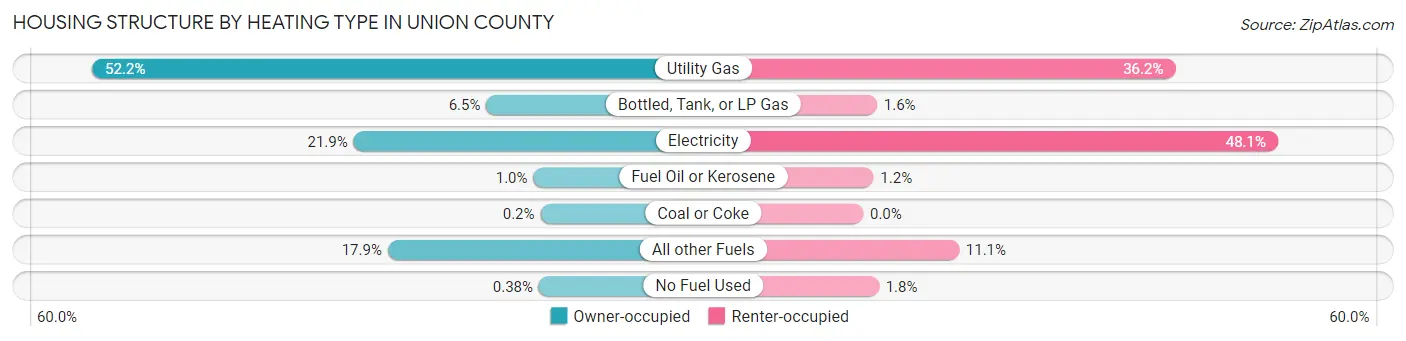
| Heating Type | Owner-occupied | Renter-occupied |
| Utility Gas | 3,719 (52.2%) | 1,293 (36.2%) |
| Bottled, Tank, or LP Gas | 461 (6.5%) | 57 (1.6%) |
| Electricity | 1,558 (21.9%) | 1,718 (48.1%) |
| Fuel Oil or Kerosene | 72 (1.0%) | 43 (1.2%) |
| Coal or Coke | 14 (0.2%) | 0 (0.0%) |
| All other Fuels | 1,276 (17.9%) | 397 (11.1%) |
| No Fuel Used | 27 (0.4%) | 65 (1.8%) |
| Total | 7,127 (100.0%) | 3,573 (100.0%) |
Household Vehicle Usage in Union County
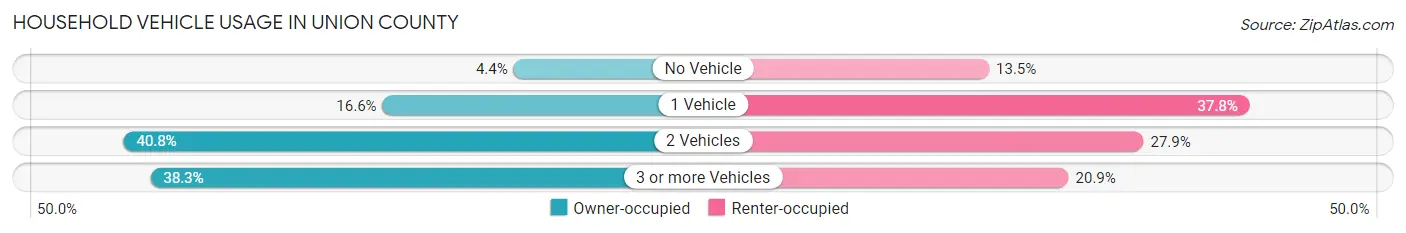
| Vehicles per Household | Owner-occupied | Renter-occupied |
| No Vehicle | 311 (4.4%) | 481 (13.5%) |
| 1 Vehicle | 1,183 (16.6%) | 1,350 (37.8%) |
| 2 Vehicles | 2,906 (40.8%) | 996 (27.9%) |
| 3 or more Vehicles | 2,727 (38.3%) | 746 (20.9%) |
| Total | 7,127 (100.0%) | 3,573 (100.0%) |
Real Estate & Mortgages in Union County
Real Estate and Mortgage Overview in Union County
| Characteristic | Without Mortgage | With Mortgage |
| Housing Units | 3,009 | 4,118 |
| Median Property Value | $226,800 | $251,200 |
| Median Household Income | $54,623 | $667 |
| Monthly Housing Costs | $516 | $157 |
| Real Estate Taxes | $1,982 | $119 |
Property Value by Mortgage Status in Union County
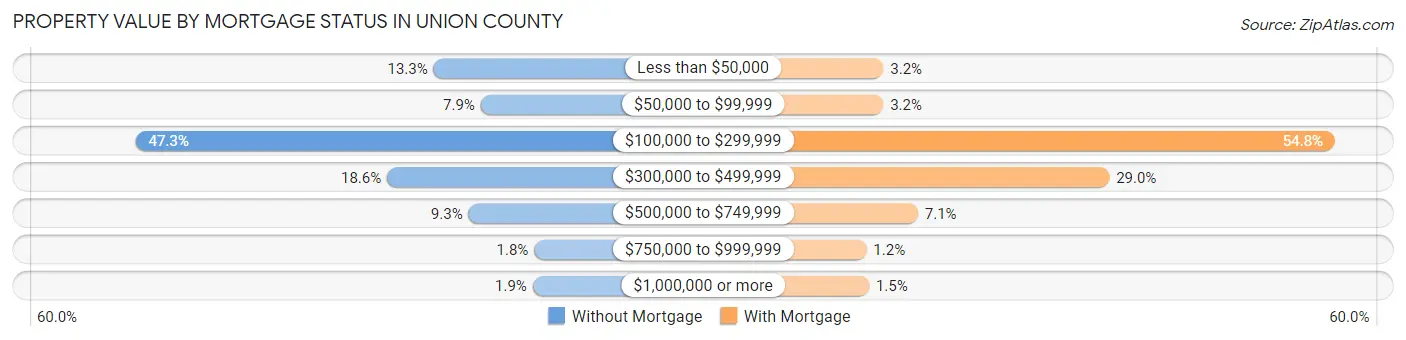
| Property Value | Without Mortgage | With Mortgage |
| Less than $50,000 | 399 (13.3%) | 131 (3.2%) |
| $50,000 to $99,999 | 237 (7.9%) | 130 (3.2%) |
| $100,000 to $299,999 | 1,424 (47.3%) | 2,256 (54.8%) |
| $300,000 to $499,999 | 559 (18.6%) | 1,194 (29.0%) |
| $500,000 to $749,999 | 279 (9.3%) | 293 (7.1%) |
| $750,000 to $999,999 | 53 (1.8%) | 51 (1.2%) |
| $1,000,000 or more | 58 (1.9%) | 63 (1.5%) |
| Total | 3,009 (100.0%) | 4,118 (100.0%) |
Household Income by Mortgage Status in Union County
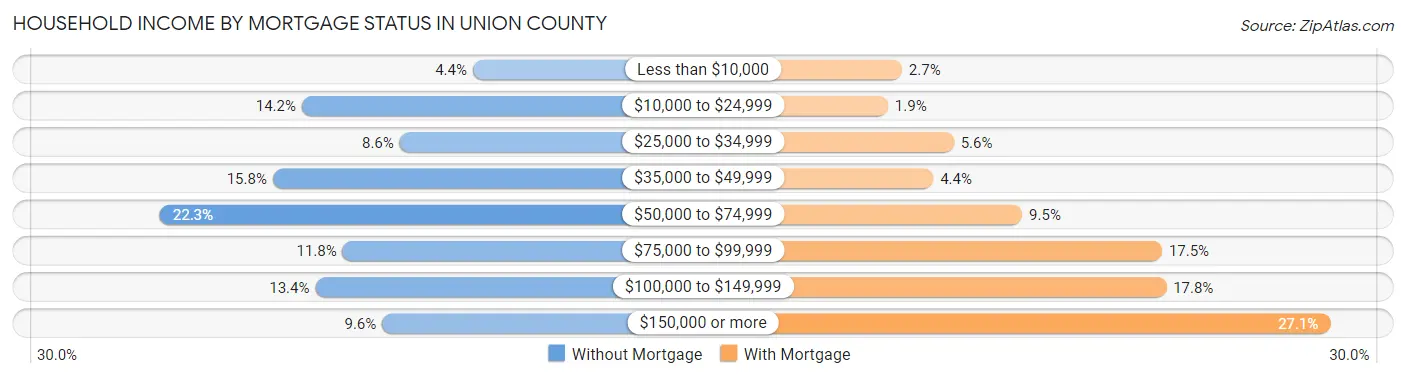
| Household Income | Without Mortgage | With Mortgage |
| Less than $10,000 | 132 (4.4%) | 109 (2.6%) |
| $10,000 to $24,999 | 426 (14.2%) | 76 (1.8%) |
| $25,000 to $34,999 | 258 (8.6%) | 231 (5.6%) |
| $35,000 to $49,999 | 476 (15.8%) | 183 (4.4%) |
| $50,000 to $74,999 | 670 (22.3%) | 392 (9.5%) |
| $75,000 to $99,999 | 356 (11.8%) | 721 (17.5%) |
| $100,000 to $149,999 | 403 (13.4%) | 731 (17.7%) |
| $150,000 or more | 288 (9.6%) | 1,117 (27.1%) |
| Total | 3,009 (100.0%) | 4,118 (100.0%) |
Property Value to Household Income Ratio in Union County
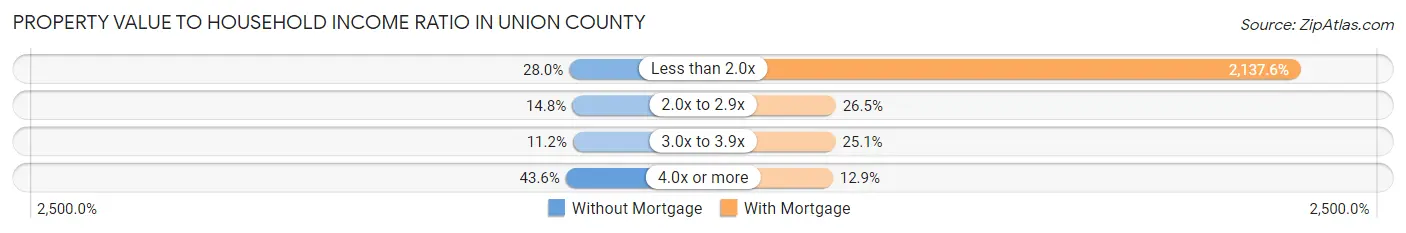
| Value-to-Income Ratio | Without Mortgage | With Mortgage |
| Less than 2.0x | 843 (28.0%) | 88,025 (2,137.6%) |
| 2.0x to 2.9x | 445 (14.8%) | 1,090 (26.5%) |
| 3.0x to 3.9x | 337 (11.2%) | 1,032 (25.1%) |
| 4.0x or more | 1,312 (43.6%) | 531 (12.9%) |
| Total | 3,009 (100.0%) | 4,118 (100.0%) |
Real Estate Taxes by Mortgage Status in Union County
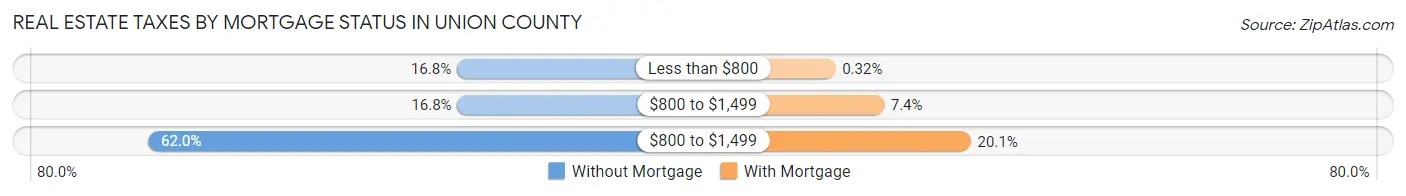
| Property Taxes | Without Mortgage | With Mortgage |
| Less than $800 | 506 (16.8%) | 13 (0.3%) |
| $800 to $1,499 | 504 (16.8%) | 305 (7.4%) |
| $800 to $1,499 | 1,864 (62.0%) | 828 (20.1%) |
| Total | 3,009 (100.0%) | 4,118 (100.0%) |
Health & Disability in Union County
Health Insurance Coverage by Age in Union County
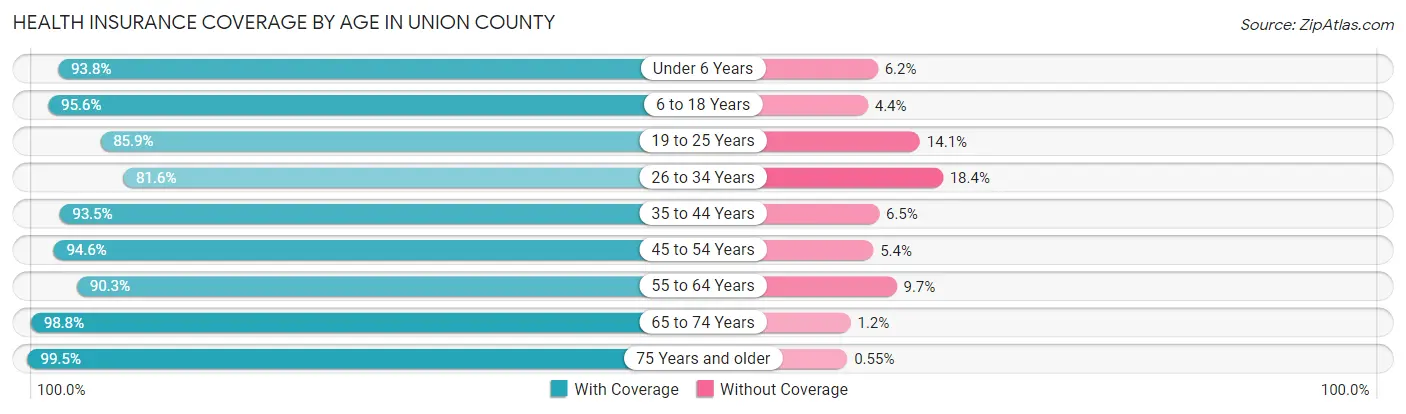
| Age Bracket | With Coverage | Without Coverage |
| Under 6 Years | 1,596 (93.8%) | 106 (6.2%) |
| 6 to 18 Years | 4,238 (95.6%) | 194 (4.4%) |
| 19 to 25 Years | 2,321 (85.9%) | 381 (14.1%) |
| 26 to 34 Years | 2,290 (81.6%) | 515 (18.4%) |
| 35 to 44 Years | 3,032 (93.5%) | 210 (6.5%) |
| 45 to 54 Years | 2,388 (94.6%) | 136 (5.4%) |
| 55 to 64 Years | 2,957 (90.3%) | 319 (9.7%) |
| 65 to 74 Years | 3,166 (98.8%) | 37 (1.2%) |
| 75 Years and older | 2,164 (99.5%) | 12 (0.5%) |
| Total | 24,152 (92.7%) | 1,910 (7.3%) |
Health Insurance Coverage by Citizenship Status in Union County
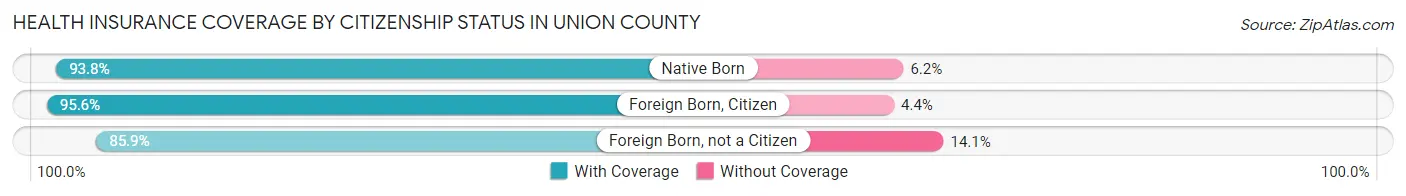
| Citizenship Status | With Coverage | Without Coverage |
| Native Born | 1,596 (93.8%) | 106 (6.2%) |
| Foreign Born, Citizen | 4,238 (95.6%) | 194 (4.4%) |
| Foreign Born, not a Citizen | 2,321 (85.9%) | 381 (14.1%) |
Health Insurance Coverage by Household Income in Union County
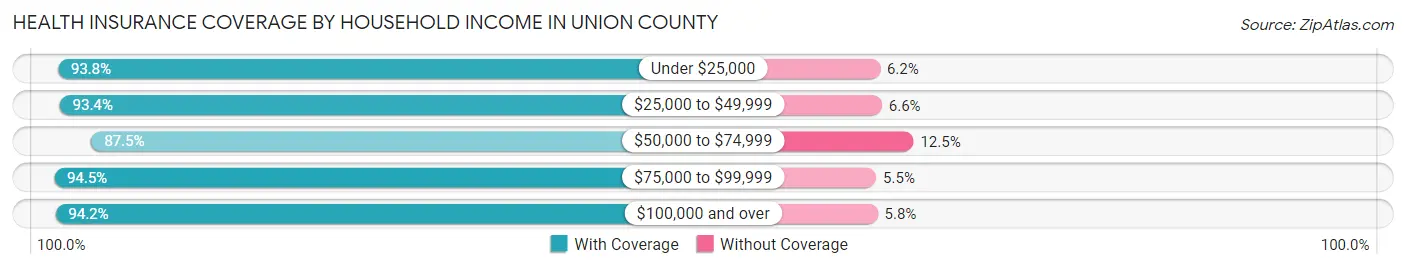
| Household Income | With Coverage | Without Coverage |
| Under $25,000 | 3,013 (93.8%) | 200 (6.2%) |
| $25,000 to $49,999 | 4,466 (93.4%) | 314 (6.6%) |
| $50,000 to $74,999 | 4,408 (87.5%) | 629 (12.5%) |
| $75,000 to $99,999 | 3,504 (94.5%) | 204 (5.5%) |
| $100,000 and over | 8,292 (94.2%) | 508 (5.8%) |
Public vs Private Health Insurance Coverage by Age in Union County
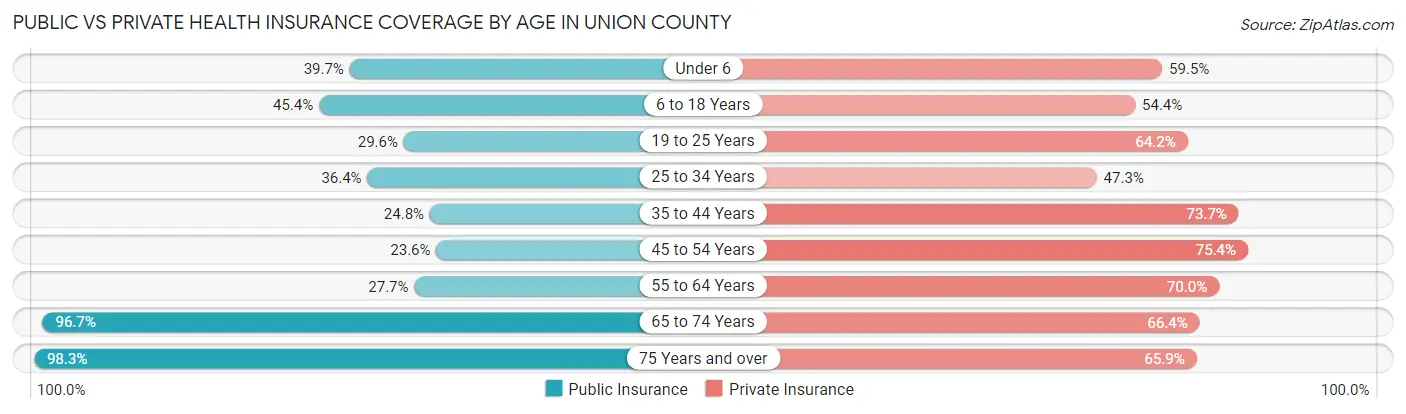
| Age Bracket | Public Insurance | Private Insurance |
| Under 6 | 675 (39.7%) | 1,012 (59.5%) |
| 6 to 18 Years | 2,010 (45.4%) | 2,413 (54.4%) |
| 19 to 25 Years | 800 (29.6%) | 1,734 (64.2%) |
| 25 to 34 Years | 1,020 (36.4%) | 1,327 (47.3%) |
| 35 to 44 Years | 803 (24.8%) | 2,388 (73.7%) |
| 45 to 54 Years | 595 (23.6%) | 1,902 (75.4%) |
| 55 to 64 Years | 906 (27.7%) | 2,294 (70.0%) |
| 65 to 74 Years | 3,096 (96.7%) | 2,127 (66.4%) |
| 75 Years and over | 2,138 (98.3%) | 1,433 (65.8%) |
| Total | 12,043 (46.2%) | 16,630 (63.8%) |
Disability Status by Sex by Age in Union County
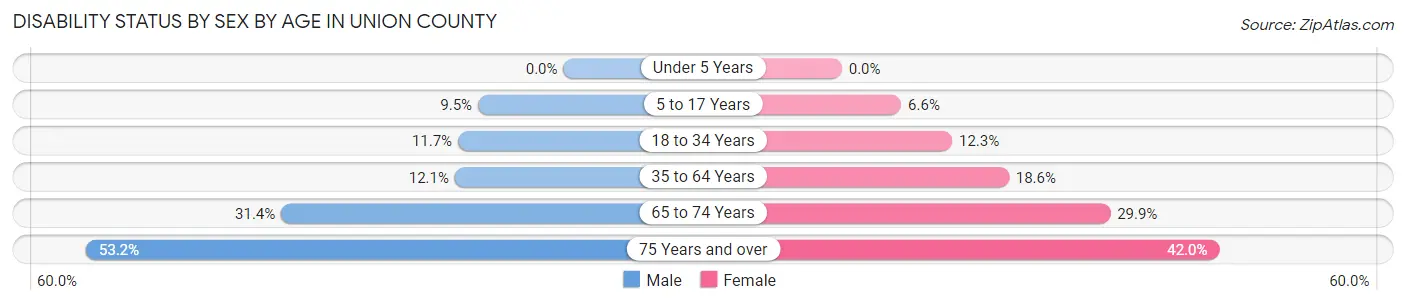
| Age Bracket | Male | Female |
| Under 5 Years | 0 (0.0%) | 0 (0.0%) |
| 5 to 17 Years | 219 (9.5%) | 140 (6.6%) |
| 18 to 34 Years | 350 (11.7%) | 359 (12.3%) |
| 35 to 64 Years | 545 (12.1%) | 843 (18.6%) |
| 65 to 74 Years | 501 (31.4%) | 481 (29.9%) |
| 75 Years and over | 512 (53.2%) | 510 (42.0%) |
Disability Class by Sex by Age in Union County
Disability Class: Hearing Difficulty
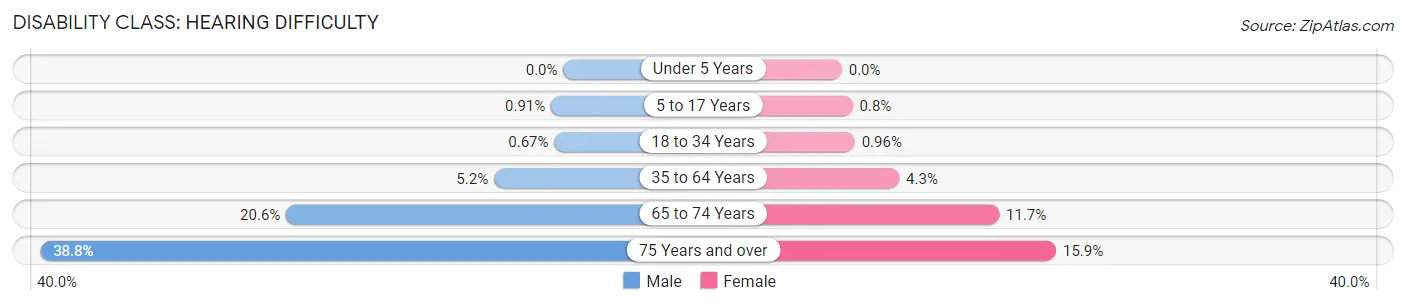
| Age Bracket | Male | Female |
| Under 5 Years | 0 (0.0%) | 0 (0.0%) |
| 5 to 17 Years | 21 (0.9%) | 17 (0.8%) |
| 18 to 34 Years | 20 (0.7%) | 28 (1.0%) |
| 35 to 64 Years | 232 (5.1%) | 193 (4.3%) |
| 65 to 74 Years | 328 (20.6%) | 188 (11.7%) |
| 75 Years and over | 374 (38.8%) | 193 (15.9%) |
Disability Class: Vision Difficulty
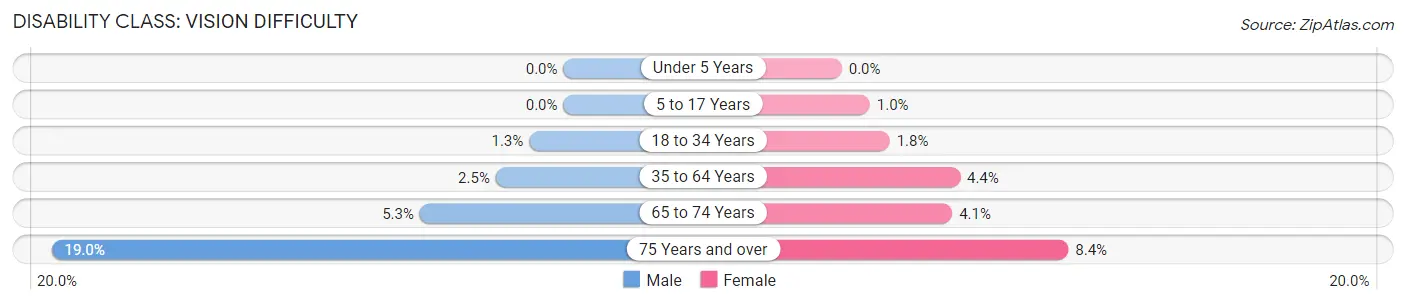
| Age Bracket | Male | Female |
| Under 5 Years | 0 (0.0%) | 0 (0.0%) |
| 5 to 17 Years | 0 (0.0%) | 22 (1.0%) |
| 18 to 34 Years | 38 (1.3%) | 52 (1.8%) |
| 35 to 64 Years | 113 (2.5%) | 199 (4.4%) |
| 65 to 74 Years | 85 (5.3%) | 66 (4.1%) |
| 75 Years and over | 183 (19.0%) | 102 (8.4%) |
Disability Class: Cognitive Difficulty
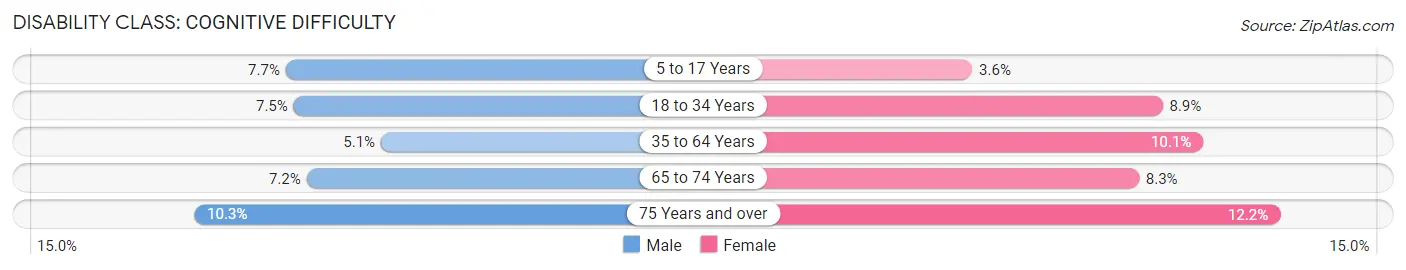
| Age Bracket | Male | Female |
| 5 to 17 Years | 178 (7.7%) | 77 (3.6%) |
| 18 to 34 Years | 224 (7.5%) | 261 (8.9%) |
| 35 to 64 Years | 229 (5.1%) | 456 (10.1%) |
| 65 to 74 Years | 114 (7.1%) | 133 (8.3%) |
| 75 Years and over | 99 (10.3%) | 148 (12.2%) |
Disability Class: Ambulatory Difficulty
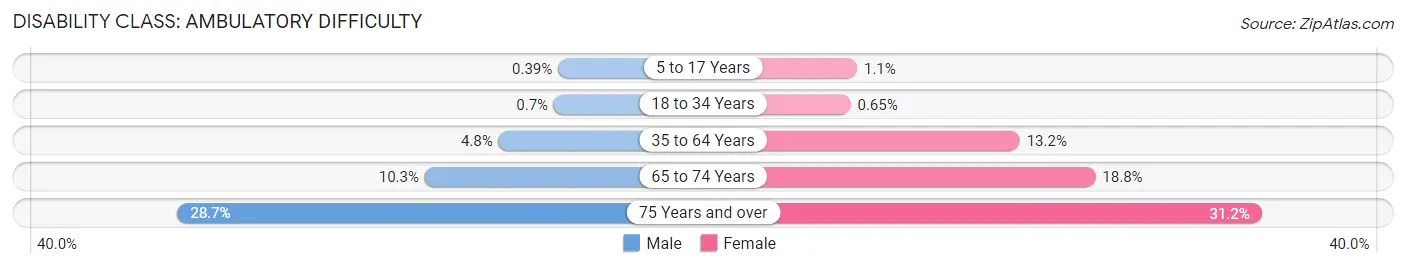
| Age Bracket | Male | Female |
| 5 to 17 Years | 9 (0.4%) | 24 (1.1%) |
| 18 to 34 Years | 21 (0.7%) | 19 (0.6%) |
| 35 to 64 Years | 217 (4.8%) | 599 (13.2%) |
| 65 to 74 Years | 164 (10.3%) | 303 (18.8%) |
| 75 Years and over | 276 (28.7%) | 378 (31.2%) |
Disability Class: Self-Care Difficulty
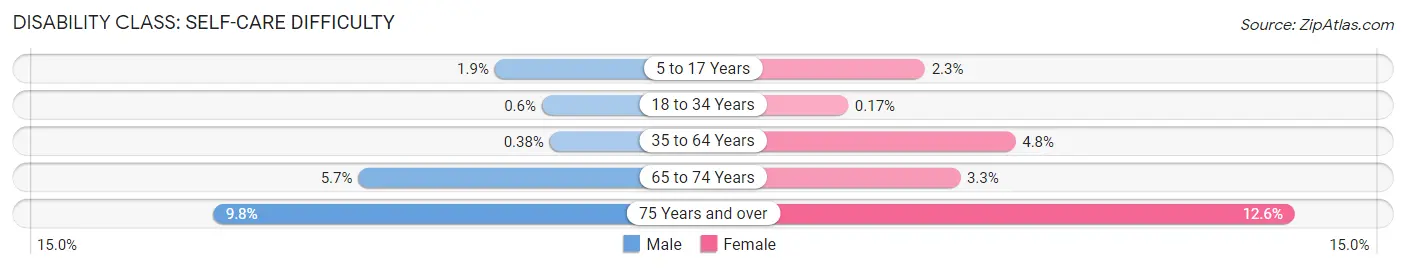
| Age Bracket | Male | Female |
| 5 to 17 Years | 44 (1.9%) | 49 (2.3%) |
| 18 to 34 Years | 18 (0.6%) | 5 (0.2%) |
| 35 to 64 Years | 17 (0.4%) | 219 (4.8%) |
| 65 to 74 Years | 91 (5.7%) | 53 (3.3%) |
| 75 Years and over | 94 (9.8%) | 153 (12.6%) |
Technology Access in Union County
Computing Device Access in Union County
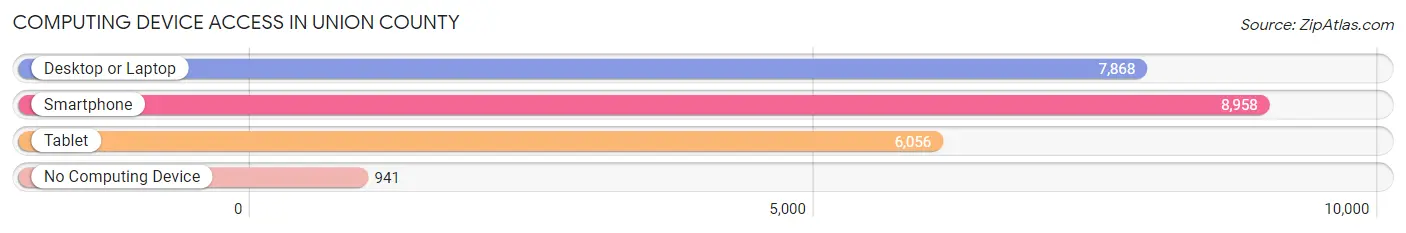
| Device Type | # Households | % Households |
| Desktop or Laptop | 7,868 | 73.5% |
| Smartphone | 8,958 | 83.7% |
| Tablet | 6,056 | 56.6% |
| No Computing Device | 941 | 8.8% |
| Total | 10,700 | 100.0% |
Internet Access in Union County
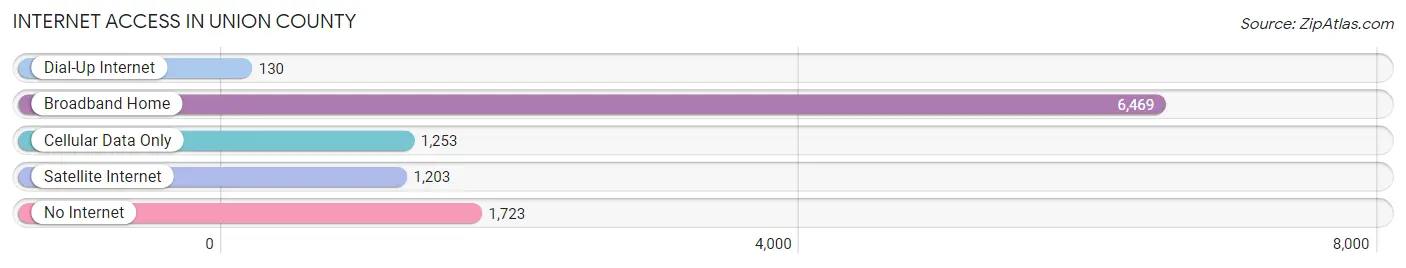
| Internet Type | # Households | % Households |
| Dial-Up Internet | 130 | 1.2% |
| Broadband Home | 6,469 | 60.5% |
| Cellular Data Only | 1,253 | 11.7% |
| Satellite Internet | 1,203 | 11.2% |
| No Internet | 1,723 | 16.1% |
| Total | 10,700 | 100.0% |
Union County Summary
Introduction
Union County is located in the northeastern corner of Oregon, and is bordered by the states of Washington and Idaho. It is the second least populous county in the state, with a population of 25,748 in 2019. The county seat is La Grande, and the largest city is Island City. Union County is home to the Wallowa-Whitman National Forest, the Eagle Cap Wilderness, and the Hells Canyon National Recreation Area.
History
Union County was created in 1864 from the eastern portion of Baker County. It was named for the Union Pacific Railroad, which was built through the area in 1884. The county was originally inhabited by the Nez Perce and Walla Walla tribes, and was later settled by pioneers in the late 1800s.
The county was an important center for the timber industry in the early 1900s, and the lumber industry was a major employer in the area. The county also had a thriving agricultural industry, with wheat, oats, and barley being the main crops.
Geography
Union County is located in the Blue Mountains region of Oregon, and is bordered by the states of Washington and Idaho. The county covers an area of 2,845 square miles, and is the second largest county in the state. The terrain is mostly mountainous, with the highest point being the summit of Sacajawea Peak at 9,838 feet. The county is home to the Wallowa-Whitman National Forest, the Eagle Cap Wilderness, and the Hells Canyon National Recreation Area.
The county is divided into two distinct regions: the Grande Ronde Valley and the Wallowa Valley. The Grande Ronde Valley is located in the western part of the county and is home to the cities of La Grande and Island City. The Wallowa Valley is located in the eastern part of the county and is home to the cities of Joseph and Enterprise.
Economy
Union County’s economy is largely based on agriculture, timber, and tourism. The county is home to several large timber companies, including Weyerhaeuser and Boise Cascade. The county is also home to several large agricultural operations, including wheat, oats, and barley.
The county is also home to several tourist attractions, including the Hells Canyon National Recreation Area, the Eagle Cap Wilderness, and the Wallowa-Whitman National Forest. The county is also home to several ski resorts, including Anthony Lakes Ski Area and Mount Emily Ski Area.
Demographics
As of the 2019 census, Union County had a population of 25,748. The population is spread out with a median age of 41.7 years. The racial makeup of the county is 91.2% White, 0.7% Black or African American, 1.2% Native American, 0.7% Asian, 0.1% Pacific Islander, 4.2% from other races, and 1.9% from two or more races. The population is also spread out with 24.2% under the age of 18, 8.2% from 18 to 24, 28.2% from 25 to 44, 25.2% from 45 to 64, and 14.2% who are 65 years of age or older.
Conclusion
Union County is a rural county located in the northeastern corner of Oregon. It is home to the Wallowa-Whitman National Forest, the Eagle Cap Wilderness, and the Hells Canyon National Recreation Area. The county’s economy is largely based on agriculture, timber, and tourism. The population of the county is 25,748, with a median age of 41.7 years. Union County is a beautiful and diverse area, and is a great place to live and visit.
Common Questions
What is Per Capita Income in Union County?
Per Capita income in Union County is $31,640.
What is the Median Family Income in Union County?
Median Family Income in Union County is $73,561.
What is the Median Household income in Union County?
Median Household Income in Union County is $61,946.
What is Income or Wage Gap in Union County?
Income or Wage Gap in Union County is 42.0%.
Women in Union County earn 58.0 cents for every dollar earned by a man.
What is Family Income Deficit in Union County?
Family Income Deficit in Union County is $7,832.
Families that are below poverty line in Union County earn $7,832 less on average than the poverty threshold level.
What is Inequality or Gini Index in Union County?
Inequality or Gini Index in Union County is 0.43.
What is the Total Population of Union County?
Total Population of Union County is 26,286.
What is the Total Male Population of Union County?
Total Male Population of Union County is 13,176.
What is the Total Female Population of Union County?
Total Female Population of Union County is 13,110.
What is the Ratio of Males per 100 Females in Union County?
There are 100.50 Males per 100 Females in Union County.
What is the Ratio of Females per 100 Males in Union County?
There are 99.50 Females per 100 Males in Union County.
What is the Median Population Age in Union County?
Median Population Age in Union County is 39.7 Years.
What is the Average Family Size in Union County
Average Family Size in Union County is 2.9 People.
What is the Average Household Size in Union County
Average Household Size in Union County is 2.4 People.
How Large is the Labor Force in Union County?
There are 12,327 People in the Labor Forcein in Union County.
What is the Percentage of People in the Labor Force in Union County?
58.2% of People are in the Labor Force in Union County.
What is the Unemployment Rate in Union County?
Unemployment Rate in Union County is 6.3%.