Cities with the Highest Percentage of Hawaiian / Pacific Population in Pennsylvania
RELATED REPORTS & OPTIONS
Hawaiian / Pacific
Pennsylvania
Compare Cities
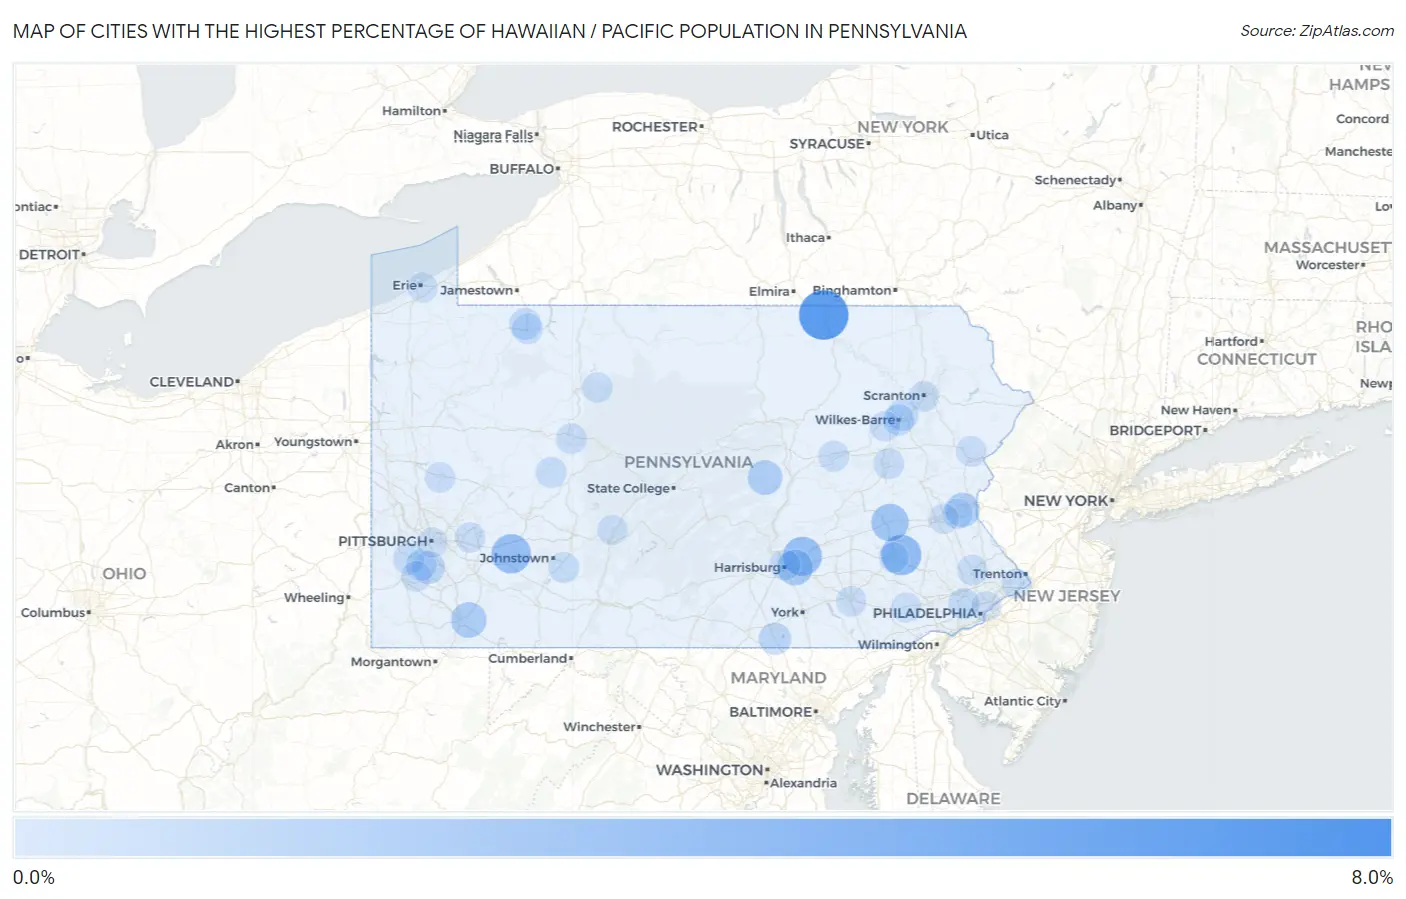
Map of Cities with the Highest Percentage of Hawaiian / Pacific Population in Pennsylvania
0.0%
8.0%
Cities with the Highest Percentage of Hawaiian / Pacific Population in Pennsylvania
| City | Hawaiian / Pacific | vs State | vs National | |
| 1. | Mcveytown Borough | 7.6% | 0.033%(+7.57)#1 | 0.19%(+7.41)#128 |
| 2. | Penn Lake Park Borough | 7.3% | 0.033%(+7.23)#2 | 0.19%(+7.07)#137 |
| 3. | Greens Landing | 6.8% | 0.033%(+6.74)#3 | 0.19%(+6.58)#146 |
| 4. | Stony Creek Mills | 3.5% | 0.033%(+3.44)#4 | 0.19%(+3.28)#265 |
| 5. | Millwood | 3.1% | 0.033%(+3.07)#5 | 0.19%(+2.91)#302 |
| 6. | Skyline View | 3.0% | 0.033%(+2.98)#6 | 0.19%(+2.82)#308 |
| 7. | Franklintown Borough | 2.8% | 0.033%(+2.77)#7 | 0.19%(+2.62)#329 |
| 8. | Edenburg | 2.5% | 0.033%(+2.43)#8 | 0.19%(+2.27)#360 |
| 9. | Media Borough | 2.4% | 0.033%(+2.41)#9 | 0.19%(+2.25)#364 |
| 10. | Lawnton | 1.9% | 0.033%(+1.86)#10 | 0.19%(+1.71)#455 |
| 11. | Lemont Furnace | 1.8% | 0.033%(+1.80)#11 | 0.19%(+1.65)#466 |
| 12. | Penns Creek | 1.5% | 0.033%(+1.48)#12 | 0.19%(+1.32)#554 |
| 13. | Middletown | 1.5% | 0.033%(+1.46)#13 | 0.19%(+1.30)#559 |
| 14. | Hallam Borough | 1.3% | 0.033%(+1.30)#14 | 0.19%(+1.15)#608 |
| 15. | Selinsgrove Borough | 1.3% | 0.033%(+1.28)#15 | 0.19%(+1.12)#618 |
| 16. | Pennsbury Village Borough | 0.95% | 0.033%(+0.915)#16 | 0.19%(+0.759)#771 |
| 17. | Export Borough | 0.94% | 0.033%(+0.907)#17 | 0.19%(+0.751)#777 |
| 18. | Loretto Borough | 0.84% | 0.033%(+0.802)#18 | 0.19%(+0.647)#852 |
| 19. | Watsontown Borough | 0.78% | 0.033%(+0.748)#19 | 0.19%(+0.593)#913 |
| 20. | Gastonville | 0.78% | 0.033%(+0.744)#20 | 0.19%(+0.588)#918 |
| 21. | South Williamsport Borough | 0.75% | 0.033%(+0.720)#21 | 0.19%(+0.564)#936 |
| 22. | Parkville | 0.73% | 0.033%(+0.697)#22 | 0.19%(+0.541)#961 |
| 23. | Larksville Borough | 0.68% | 0.033%(+0.651)#23 | 0.19%(+0.495)#1,020 |
| 24. | West Liberty Borough | 0.67% | 0.033%(+0.641)#24 | 0.19%(+0.485)#1,035 |
| 25. | Cambridge Springs Borough | 0.61% | 0.033%(+0.577)#25 | 0.19%(+0.421)#1,106 |
| 26. | Atglen Borough | 0.60% | 0.033%(+0.563)#26 | 0.19%(+0.408)#1,120 |
| 27. | Plains | 0.55% | 0.033%(+0.514)#27 | 0.19%(+0.358)#1,178 |
| 28. | Cooperstown Borough | 0.54% | 0.033%(+0.503)#28 | 0.19%(+0.347)#1,198 |
| 29. | Dillsburg Borough | 0.53% | 0.033%(+0.500)#29 | 0.19%(+0.344)#1,201 |
| 30. | North Warren | 0.52% | 0.033%(+0.488)#30 | 0.19%(+0.332)#1,221 |
| 31. | Saegertown Borough | 0.52% | 0.033%(+0.484)#31 | 0.19%(+0.328)#1,225 |
| 32. | West Brownsville Borough | 0.46% | 0.033%(+0.426)#32 | 0.19%(+0.270)#1,324 |
| 33. | Palo Alto Borough | 0.42% | 0.033%(+0.387)#33 | 0.19%(+0.231)#1,390 |
| 34. | Jacobus Borough | 0.42% | 0.033%(+0.386)#34 | 0.19%(+0.230)#1,395 |
| 35. | Bentleyville Borough | 0.42% | 0.033%(+0.382)#35 | 0.19%(+0.226)#1,403 |
| 36. | Cecil Bishop | 0.41% | 0.033%(+0.377)#36 | 0.19%(+0.221)#1,419 |
| 37. | Wilkes Barre | 0.39% | 0.033%(+0.353)#37 | 0.19%(+0.197)#1,481 |
| 38. | Folcroft Borough | 0.38% | 0.033%(+0.352)#38 | 0.19%(+0.196)#1,483 |
| 39. | Macungie Borough | 0.37% | 0.033%(+0.337)#39 | 0.19%(+0.181)#1,523 |
| 40. | Picture Rocks Borough | 0.35% | 0.033%(+0.313)#40 | 0.19%(+0.157)#1,598 |
| 41. | Bryn Mawr | 0.34% | 0.033%(+0.312)#41 | 0.19%(+0.156)#1,601 |
| 42. | Mcmurray | 0.34% | 0.033%(+0.304)#42 | 0.19%(+0.148)#1,624 |
| 43. | Wyoming Borough | 0.32% | 0.033%(+0.289)#43 | 0.19%(+0.133)#1,656 |
| 44. | Trafford Borough | 0.31% | 0.033%(+0.276)#44 | 0.19%(+0.120)#1,695 |
| 45. | Rossiter | 0.30% | 0.033%(+0.270)#45 | 0.19%(+0.114)#1,720 |
| 46. | Warren | 0.29% | 0.033%(+0.256)#46 | 0.19%(+0.100)#1,767 |
| 47. | Bloomsburg | 0.28% | 0.033%(+0.248)#47 | 0.19%(+0.092)#1,804 |
| 48. | University Of Pittsburgh Johnstown | 0.28% | 0.033%(+0.247)#48 | 0.19%(+0.091)#1,807 |
| 49. | Mcdonald Borough | 0.22% | 0.033%(+0.188)#49 | 0.19%(+0.032)#2,033 |
| 50. | South Greensburg Borough | 0.22% | 0.033%(+0.186)#50 | 0.19%(+0.030)#2,049 |
| 51. | Hazleton | 0.22% | 0.033%(+0.183)#51 | 0.19%(+0.027)#2,061 |
| 52. | Franklin Park Borough | 0.22% | 0.033%(+0.183)#52 | 0.19%(+0.027)#2,062 |
| 53. | Wylandville | 0.19% | 0.033%(+0.156)#53 | 0.19%(+0.000)#2,182 |
| 54. | Dubois | 0.19% | 0.033%(+0.154)#54 | 0.19%(-0.002)#2,193 |
| 55. | Yoe Borough | 0.18% | 0.033%(+0.150)#55 | 0.19%(-0.006)#2,215 |
| 56. | Harrisburg | 0.18% | 0.033%(+0.145)#56 | 0.19%(-0.011)#2,238 |
| 57. | Penn Estates | 0.17% | 0.033%(+0.138)#57 | 0.19%(-0.018)#2,279 |
| 58. | Montgomeryville | 0.17% | 0.033%(+0.136)#58 | 0.19%(-0.020)#2,285 |
| 59. | Forty Fort Borough | 0.17% | 0.033%(+0.132)#59 | 0.19%(-0.024)#2,316 |
| 60. | Myerstown Borough | 0.16% | 0.033%(+0.128)#60 | 0.19%(-0.028)#2,343 |
| 61. | Curwensville Borough | 0.16% | 0.033%(+0.124)#61 | 0.19%(-0.032)#2,366 |
| 62. | Norristown Borough | 0.15% | 0.033%(+0.116)#62 | 0.19%(-0.040)#2,411 |
| 63. | Boyertown Borough | 0.14% | 0.033%(+0.109)#63 | 0.19%(-0.047)#2,454 |
| 64. | Forest Hills Borough | 0.14% | 0.033%(+0.108)#64 | 0.19%(-0.048)#2,459 |
| 65. | Scranton | 0.13% | 0.033%(+0.097)#65 | 0.19%(-0.059)#2,524 |
| 66. | Adamstown Borough | 0.12% | 0.033%(+0.089)#66 | 0.19%(-0.067)#2,579 |
| 67. | Murrysville | 0.11% | 0.033%(+0.078)#67 | 0.19%(-0.078)#2,668 |
| 68. | Homeacre Lyndora | 0.10% | 0.033%(+0.071)#68 | 0.19%(-0.085)#2,709 |
| 69. | Lancaster | 0.10% | 0.033%(+0.067)#69 | 0.19%(-0.089)#2,736 |
| 70. | Waynesboro Borough | 0.091% | 0.033%(+0.058)#70 | 0.19%(-0.098)#2,811 |
| 71. | Nanticoke | 0.075% | 0.033%(+0.043)#71 | 0.19%(-0.113)#2,939 |
| 72. | St Marys | 0.071% | 0.033%(+0.038)#72 | 0.19%(-0.118)#2,977 |
| 73. | Coatesville | 0.060% | 0.033%(+0.027)#73 | 0.19%(-0.129)#3,097 |
| 74. | White Oak Borough | 0.053% | 0.033%(+0.020)#74 | 0.19%(-0.136)#3,175 |
| 75. | Philadelphia | 0.051% | 0.033%(+0.018)#75 | 0.19%(-0.138)#3,195 |
| 76. | Dunmore Borough | 0.050% | 0.033%(+0.017)#76 | 0.19%(-0.139)#3,206 |
| 77. | Altoona | 0.048% | 0.033%(+0.015)#77 | 0.19%(-0.141)#3,229 |
| 78. | Hummelstown Borough | 0.044% | 0.033%(+0.011)#78 | 0.19%(-0.145)#3,273 |
| 79. | Erie | 0.033% | 0.033%(-0.000)#79 | 0.19%(-0.156)#3,410 |
| 80. | State College Borough | 0.029% | 0.033%(-0.003)#80 | 0.19%(-0.159)#3,452 |
| 81. | Pittsburgh | 0.026% | 0.033%(-0.007)#81 | 0.19%(-0.163)#3,511 |
| 82. | Bethlehem | 0.024% | 0.033%(-0.009)#82 | 0.19%(-0.165)#3,542 |
| 83. | Allentown | 0.020% | 0.033%(-0.013)#83 | 0.19%(-0.169)#3,589 |
| 84. | Reading | 0.0085% | 0.033%(-0.024)#84 | 0.19%(-0.180)#3,732 |
| 85. | Kingston Borough | 0.0075% | 0.033%(-0.025)#85 | 0.19%(-0.181)#3,745 |
| 86. | Carlisle Borough | 0.0048% | 0.033%(-0.028)#86 | 0.19%(-0.184)#3,770 |
| 87. | Levittown | 0.0020% | 0.033%(-0.031)#87 | 0.19%(-0.187)#3,799 |
Common Questions
What are the Top 10 Cities with the Highest Percentage of Hawaiian / Pacific Population in Pennsylvania?
Top 10 Cities with the Highest Percentage of Hawaiian / Pacific Population in Pennsylvania are:
#1
6.8%
#2
3.5%
#3
3.1%
#4
3.0%
#5
2.5%
#6
1.9%
#7
1.8%
#8
1.5%
#9
1.5%
#10
0.78%
What city has the Highest Percentage of Hawaiian / Pacific Population in Pennsylvania?
Greens Landing has the Highest Percentage of Hawaiian / Pacific Population in Pennsylvania with 6.8%.
What is the Percentage of Hawaiian / Pacific Population in the State of Pennsylvania?
Percentage of Hawaiian / Pacific Population in Pennsylvania is 0.033%.
What is the Percentage of Hawaiian / Pacific Population in the United States?
Percentage of Hawaiian / Pacific Population in the United States is 0.19%.