Cities with the Highest Percentage of Population Employed in Finance & Insurance in Ohio
RELATED REPORTS & OPTIONS
Finance & Insurance
Ohio
Compare Cities
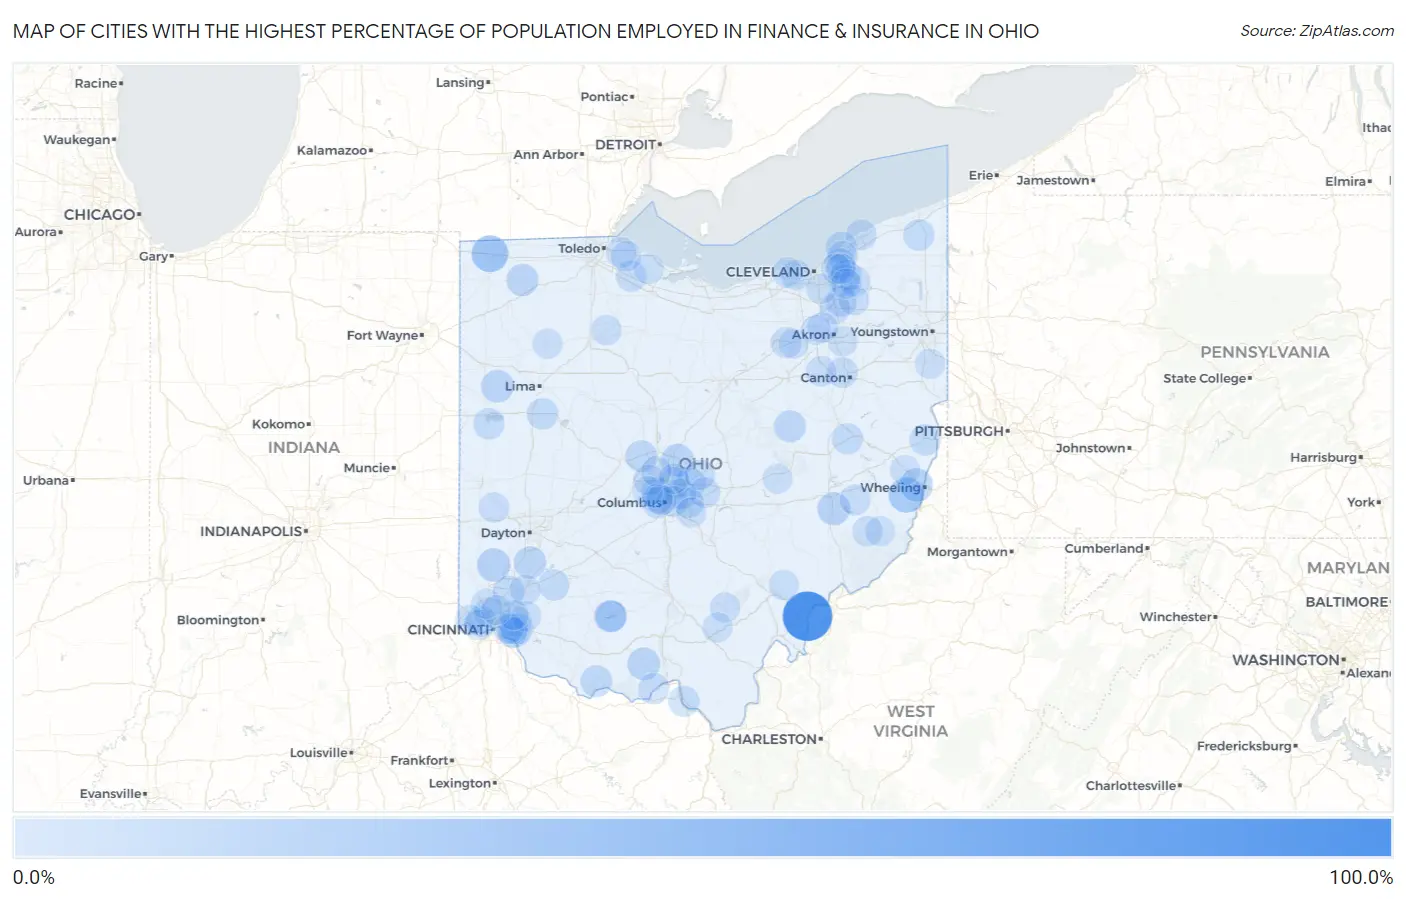
Map of Cities with the Highest Percentage of Population Employed in Finance & Insurance in Ohio
0.0%
100.0%
Cities with the Highest Percentage of Population Employed in Finance & Insurance in Ohio
| City | % Employed | vs State | vs National | |
| 1. | Hockingport | 100.0% | 5.0%(+95.0)#1 | 4.8%(+95.2)#7 |
| 2. | Holiday City | 38.5% | 5.0%(+33.4)#2 | 4.8%(+33.7)#90 |
| 3. | Glencoe | 31.7% | 5.0%(+26.6)#3 | 4.8%(+26.9)#139 |
| 4. | Petersburg | 24.2% | 5.0%(+19.1)#4 | 4.8%(+19.4)#238 |
| 5. | Jacksonburg | 23.1% | 5.0%(+18.0)#5 | 4.8%(+18.3)#259 |
| 6. | Lansing | 22.6% | 5.0%(+17.6)#6 | 4.8%(+17.9)#270 |
| 7. | Buffalo | 20.8% | 5.0%(+15.7)#7 | 4.8%(+16.0)#334 |
| 8. | Elgin | 20.0% | 5.0%(+15.0)#8 | 4.8%(+15.2)#365 |
| 9. | Otway | 20.0% | 5.0%(+15.0)#9 | 4.8%(+15.2)#368 |
| 10. | Sunbury | 19.5% | 5.0%(+14.5)#10 | 4.8%(+14.8)#396 |
| 11. | Five Points | 18.4% | 5.0%(+13.4)#11 | 4.8%(+13.7)#440 |
| 12. | Ridgeville Corners | 17.5% | 5.0%(+12.5)#12 | 4.8%(+12.8)#494 |
| 13. | Rocky Fork Point | 17.2% | 5.0%(+12.2)#13 | 4.8%(+12.4)#508 |
| 14. | Lake Buckhorn | 16.8% | 5.0%(+11.8)#14 | 4.8%(+12.1)#528 |
| 15. | Bentonville | 16.2% | 5.0%(+11.2)#15 | 4.8%(+11.5)#574 |
| 16. | Lawrenceville | 16.2% | 5.0%(+11.1)#16 | 4.8%(+11.4)#582 |
| 17. | Ostrander | 15.6% | 5.0%(+10.6)#17 | 4.8%(+10.9)#626 |
| 18. | Lakeline | 15.5% | 5.0%(+10.4)#18 | 4.8%(+10.7)#647 |
| 19. | Valleyview | 15.0% | 5.0%(+9.98)#19 | 4.8%(+10.2)#697 |
| 20. | Nashport | 14.4% | 5.0%(+9.34)#20 | 4.8%(+9.61)#767 |
| 21. | St Johns | 14.2% | 5.0%(+9.14)#21 | 4.8%(+9.41)#807 |
| 22. | Highland Holiday | 14.1% | 5.0%(+9.04)#22 | 4.8%(+9.31)#827 |
| 23. | Jefferson | 14.1% | 5.0%(+9.03)#23 | 4.8%(+9.30)#830 |
| 24. | Tuscarawas | 14.0% | 5.0%(+8.97)#24 | 4.8%(+9.24)#839 |
| 25. | New Albany | 13.8% | 5.0%(+8.74)#25 | 4.8%(+9.01)#865 |
| 26. | Friendship | 13.7% | 5.0%(+8.63)#26 | 4.8%(+8.90)#876 |
| 27. | Montezuma | 13.6% | 5.0%(+8.60)#27 | 4.8%(+8.87)#880 |
| 28. | Clarksville | 13.3% | 5.0%(+8.30)#28 | 4.8%(+8.57)#938 |
| 29. | Newport Cdp Shelby County | 13.2% | 5.0%(+8.15)#29 | 4.8%(+8.42)#964 |
| 30. | Mount Carmel | 13.1% | 5.0%(+8.09)#30 | 4.8%(+8.36)#971 |
| 31. | Wintersville | 13.1% | 5.0%(+8.05)#31 | 4.8%(+8.32)#980 |
| 32. | Wetherington | 12.8% | 5.0%(+7.79)#32 | 4.8%(+8.06)#1,027 |
| 33. | Franklin Furnace | 12.8% | 5.0%(+7.76)#33 | 4.8%(+8.03)#1,034 |
| 34. | Westfield Center | 12.5% | 5.0%(+7.49)#34 | 4.8%(+7.75)#1,088 |
| 35. | Elmore | 12.5% | 5.0%(+7.45)#35 | 4.8%(+7.72)#1,106 |
| 36. | Salesville | 12.3% | 5.0%(+7.31)#36 | 4.8%(+7.58)#1,143 |
| 37. | Highland Heights | 12.1% | 5.0%(+7.07)#37 | 4.8%(+7.34)#1,200 |
| 38. | Moreland Hills | 12.1% | 5.0%(+7.07)#38 | 4.8%(+7.34)#1,202 |
| 39. | Grand River | 12.1% | 5.0%(+7.04)#39 | 4.8%(+7.31)#1,208 |
| 40. | Hunting Valley | 12.0% | 5.0%(+6.95)#40 | 4.8%(+7.22)#1,241 |
| 41. | Hills And Dales | 11.5% | 5.0%(+6.42)#41 | 4.8%(+6.69)#1,380 |
| 42. | Upper Arlington | 11.3% | 5.0%(+6.28)#42 | 4.8%(+6.54)#1,431 |
| 43. | Cheviot | 11.3% | 5.0%(+6.23)#43 | 4.8%(+6.50)#1,442 |
| 44. | Beechwood Trails | 11.3% | 5.0%(+6.23)#44 | 4.8%(+6.50)#1,443 |
| 45. | Twinsburg Heights | 11.2% | 5.0%(+6.14)#45 | 4.8%(+6.40)#1,467 |
| 46. | Huber Ridge | 11.2% | 5.0%(+6.12)#46 | 4.8%(+6.39)#1,470 |
| 47. | Dublin | 11.1% | 5.0%(+6.07)#47 | 4.8%(+6.34)#1,498 |
| 48. | Gahanna | 11.1% | 5.0%(+6.05)#48 | 4.8%(+6.32)#1,503 |
| 49. | Bexley | 11.1% | 5.0%(+6.04)#49 | 4.8%(+6.31)#1,507 |
| 50. | South Lebanon | 11.1% | 5.0%(+6.03)#50 | 4.8%(+6.30)#1,512 |
| 51. | Reno Beach | 11.1% | 5.0%(+6.02)#51 | 4.8%(+6.29)#1,513 |
| 52. | Terrace Park | 11.0% | 5.0%(+5.97)#52 | 4.8%(+6.24)#1,527 |
| 53. | Boston Heights | 10.8% | 5.0%(+5.73)#53 | 4.8%(+6.00)#1,613 |
| 54. | Willoughby Hills | 10.6% | 5.0%(+5.60)#54 | 4.8%(+5.87)#1,655 |
| 55. | South Russell | 10.5% | 5.0%(+5.51)#55 | 4.8%(+5.78)#1,684 |
| 56. | Aurora | 10.5% | 5.0%(+5.45)#56 | 4.8%(+5.72)#1,710 |
| 57. | Reynoldsburg | 10.3% | 5.0%(+5.31)#57 | 4.8%(+5.58)#1,753 |
| 58. | Curtice | 10.3% | 5.0%(+5.30)#58 | 4.8%(+5.57)#1,764 |
| 59. | North Lawrence | 10.3% | 5.0%(+5.27)#59 | 4.8%(+5.54)#1,776 |
| 60. | Marble Cliff | 10.3% | 5.0%(+5.25)#60 | 4.8%(+5.52)#1,783 |
| 61. | Cherry Grove | 10.2% | 5.0%(+5.16)#61 | 4.8%(+5.42)#1,824 |
| 62. | Westerville | 10.2% | 5.0%(+5.13)#62 | 4.8%(+5.39)#1,838 |
| 63. | Dry Run | 10.1% | 5.0%(+5.08)#63 | 4.8%(+5.35)#1,858 |
| 64. | Lewisville | 10.1% | 5.0%(+5.08)#64 | 4.8%(+5.34)#1,861 |
| 65. | Lyndhurst | 10.1% | 5.0%(+5.02)#65 | 4.8%(+5.29)#1,889 |
| 66. | Oak Harbor | 9.9% | 5.0%(+4.88)#66 | 4.8%(+5.15)#1,956 |
| 67. | Arcadia | 9.9% | 5.0%(+4.87)#67 | 4.8%(+5.14)#1,963 |
| 68. | Covedale | 9.9% | 5.0%(+4.86)#68 | 4.8%(+5.12)#1,966 |
| 69. | Amesville | 9.8% | 5.0%(+4.77)#69 | 4.8%(+5.04)#2,007 |
| 70. | Williston | 9.8% | 5.0%(+4.75)#70 | 4.8%(+5.02)#2,022 |
| 71. | Grandview Heights | 9.7% | 5.0%(+4.69)#71 | 4.8%(+4.96)#2,046 |
| 72. | Rocky River | 9.7% | 5.0%(+4.67)#72 | 4.8%(+4.94)#2,055 |
| 73. | Bay Village | 9.7% | 5.0%(+4.65)#73 | 4.8%(+4.92)#2,065 |
| 74. | Gordon | 9.7% | 5.0%(+4.64)#74 | 4.8%(+4.91)#2,070 |
| 75. | Mcarthur | 9.6% | 5.0%(+4.58)#75 | 4.8%(+4.85)#2,099 |
| 76. | Johnstown | 9.6% | 5.0%(+4.56)#76 | 4.8%(+4.83)#2,113 |
| 77. | Powell | 9.6% | 5.0%(+4.54)#77 | 4.8%(+4.81)#2,125 |
| 78. | Fairlawn | 9.6% | 5.0%(+4.54)#78 | 4.8%(+4.81)#2,129 |
| 79. | Independence | 9.5% | 5.0%(+4.51)#79 | 4.8%(+4.78)#2,148 |
| 80. | Mayfield Heights | 9.5% | 5.0%(+4.48)#80 | 4.8%(+4.75)#2,179 |
| 81. | North College Hill | 9.5% | 5.0%(+4.47)#81 | 4.8%(+4.74)#2,186 |
| 82. | Hilliard | 9.5% | 5.0%(+4.47)#82 | 4.8%(+4.74)#2,189 |
| 83. | Ottawa | 9.5% | 5.0%(+4.45)#83 | 4.8%(+4.72)#2,199 |
| 84. | Pigeon Creek | 9.4% | 5.0%(+4.33)#84 | 4.8%(+4.60)#2,270 |
| 85. | Mount Healthy Heights | 9.3% | 5.0%(+4.23)#85 | 4.8%(+4.50)#2,318 |
| 86. | Woodsfield | 9.2% | 5.0%(+4.13)#86 | 4.8%(+4.40)#2,378 |
| 87. | Columbiana | 9.2% | 5.0%(+4.13)#87 | 4.8%(+4.40)#2,380 |
| 88. | Bentleyville | 9.2% | 5.0%(+4.11)#88 | 4.8%(+4.38)#2,388 |
| 89. | Sawyerwood | 9.1% | 5.0%(+4.10)#89 | 4.8%(+4.37)#2,397 |
| 90. | Miami Heights | 9.1% | 5.0%(+4.08)#90 | 4.8%(+4.35)#2,404 |
| 91. | Wellston | 9.0% | 5.0%(+3.98)#91 | 4.8%(+4.24)#2,485 |
| 92. | Forestville | 9.0% | 5.0%(+3.95)#92 | 4.8%(+4.22)#2,500 |
| 93. | Pickerington | 9.0% | 5.0%(+3.95)#93 | 4.8%(+4.22)#2,501 |
| 94. | Mount Repose | 9.0% | 5.0%(+3.94)#94 | 4.8%(+4.21)#2,503 |
| 95. | Dresden | 8.8% | 5.0%(+3.80)#95 | 4.8%(+4.07)#2,593 |
| 96. | Seville | 8.8% | 5.0%(+3.80)#96 | 4.8%(+4.06)#2,596 |
| 97. | Turpin Hills | 8.8% | 5.0%(+3.79)#97 | 4.8%(+4.06)#2,602 |
| 98. | Harrisville | 8.8% | 5.0%(+3.79)#98 | 4.8%(+4.06)#2,607 |
| 99. | The Village Of Indian Hill | 8.8% | 5.0%(+3.75)#99 | 4.8%(+4.02)#2,625 |
| 100. | Wyoming | 8.8% | 5.0%(+3.71)#100 | 4.8%(+3.98)#2,648 |
Common Questions
What are the Top 10 Cities with the Highest Percentage of Population Employed in Finance & Insurance in Ohio?
Top 10 Cities with the Highest Percentage of Population Employed in Finance & Insurance in Ohio are:
#1
100.0%
#2
38.5%
#3
31.7%
#4
23.1%
#5
22.6%
#6
20.8%
#7
20.0%
#8
20.0%
#9
19.5%
#10
18.4%
What city has the Highest Percentage of Population Employed in Finance & Insurance in Ohio?
Hockingport has the Highest Percentage of Population Employed in Finance & Insurance in Ohio with 100.0%.
What is the Percentage of Population Employed in Finance & Insurance in the State of Ohio?
Percentage of Population Employed in Finance & Insurance in Ohio is 5.0%.
What is the Percentage of Population Employed in Finance & Insurance in the United States?
Percentage of Population Employed in Finance & Insurance in the United States is 4.8%.